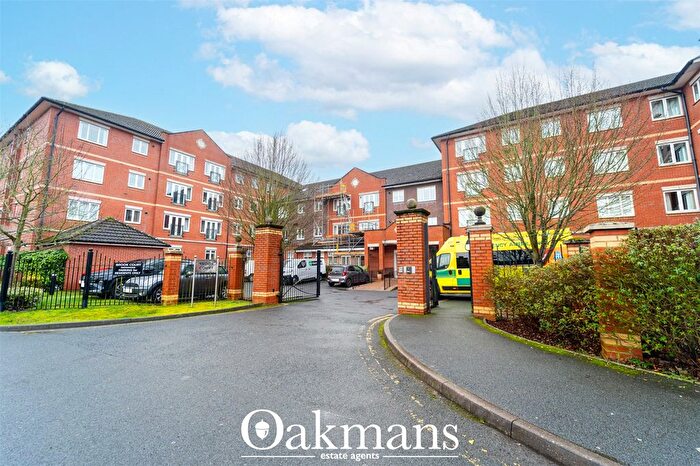
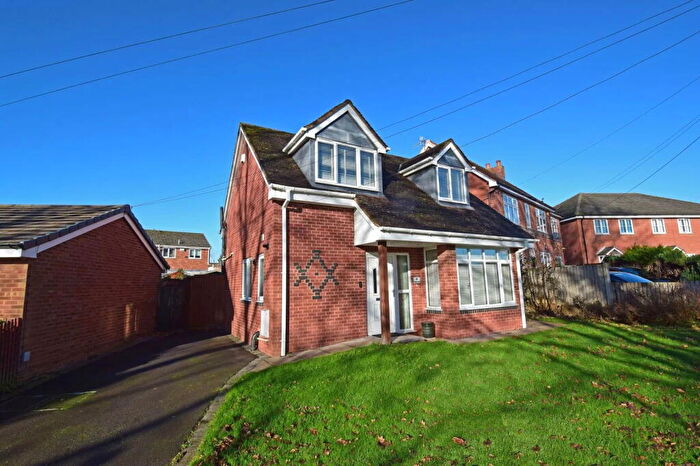
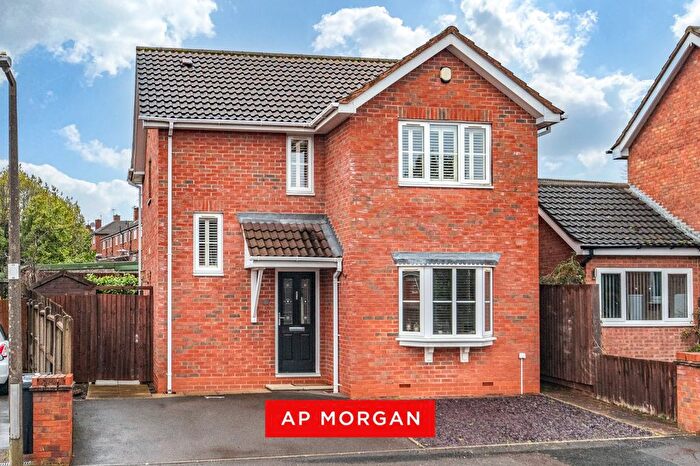
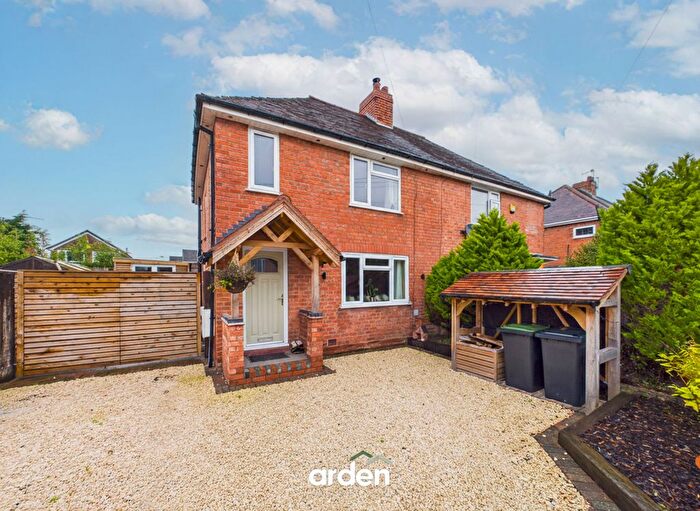
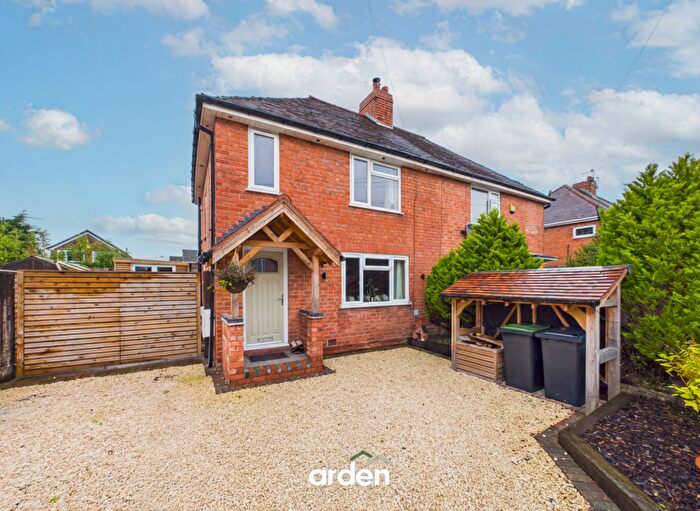
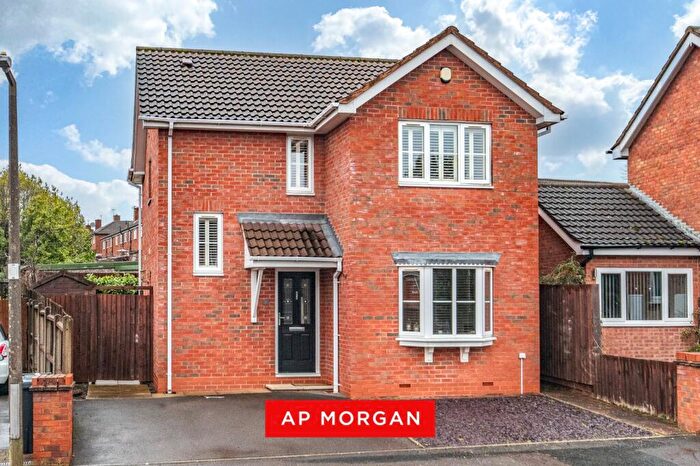
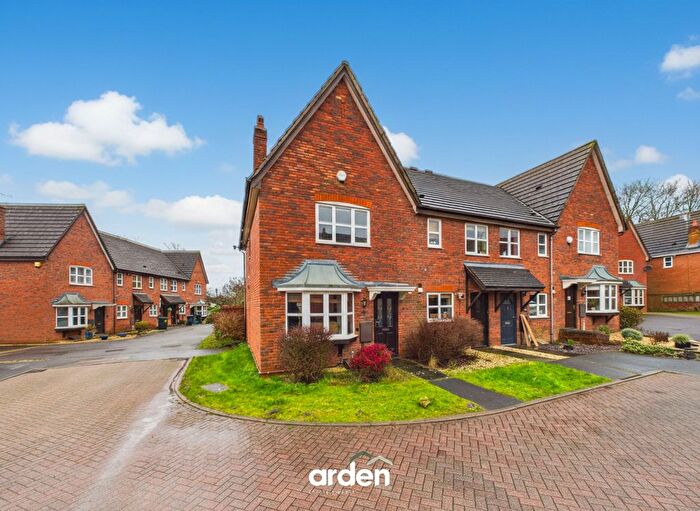
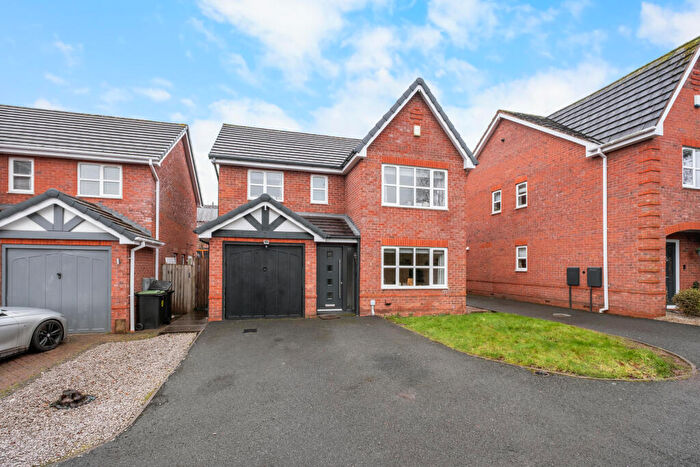
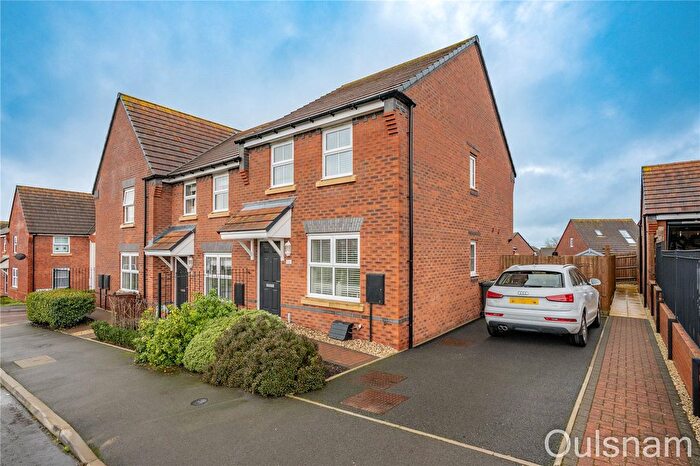
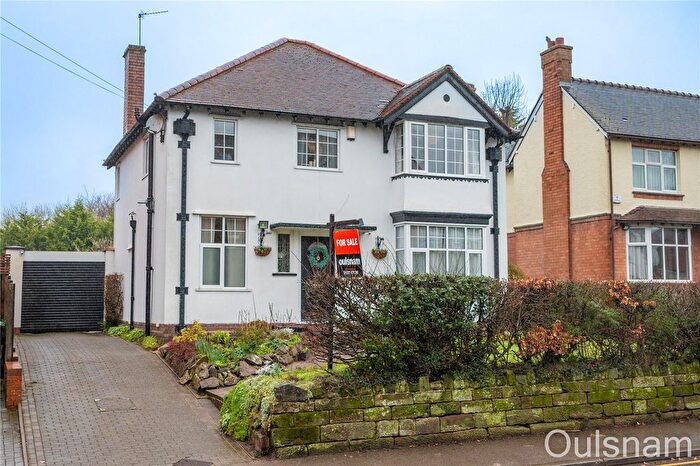
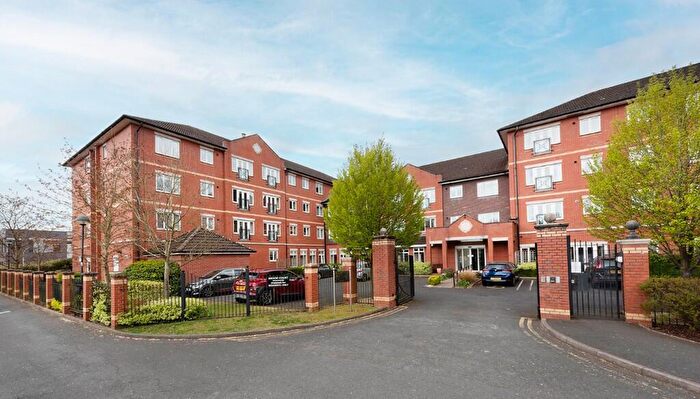
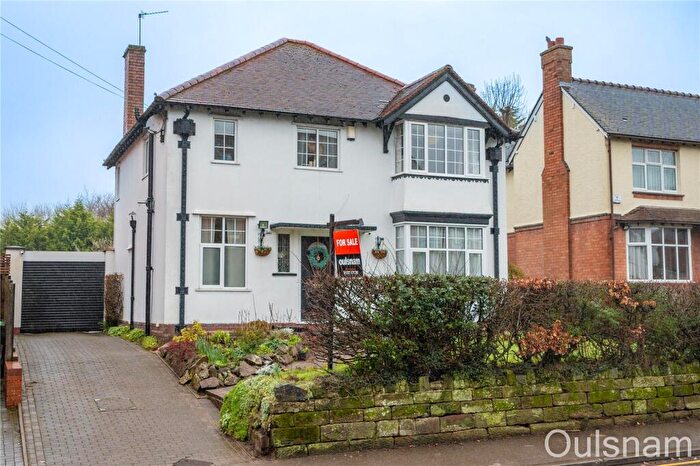
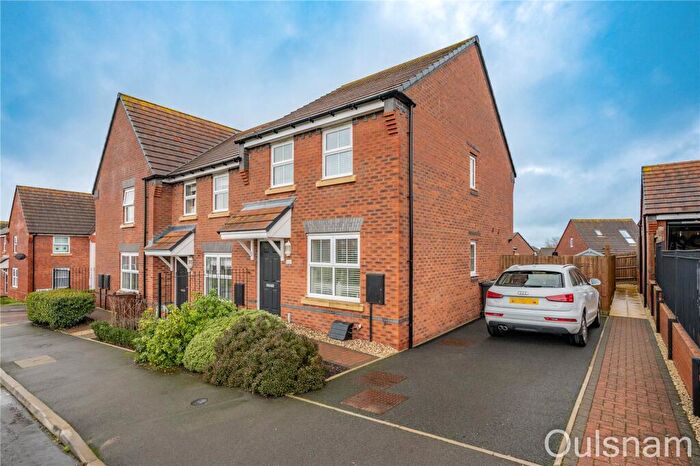
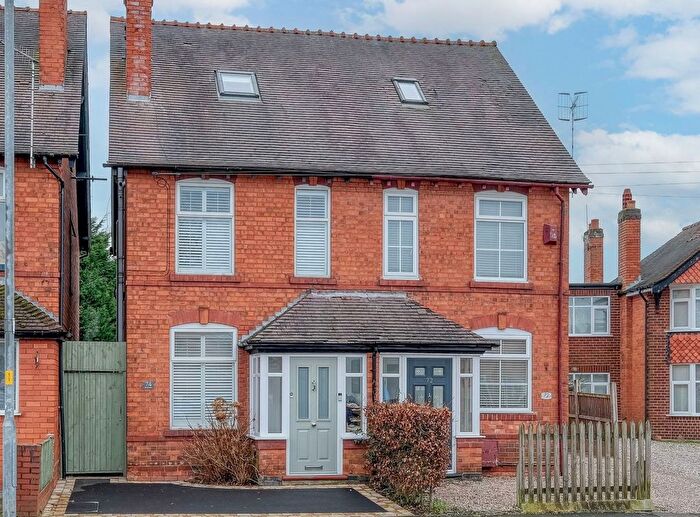
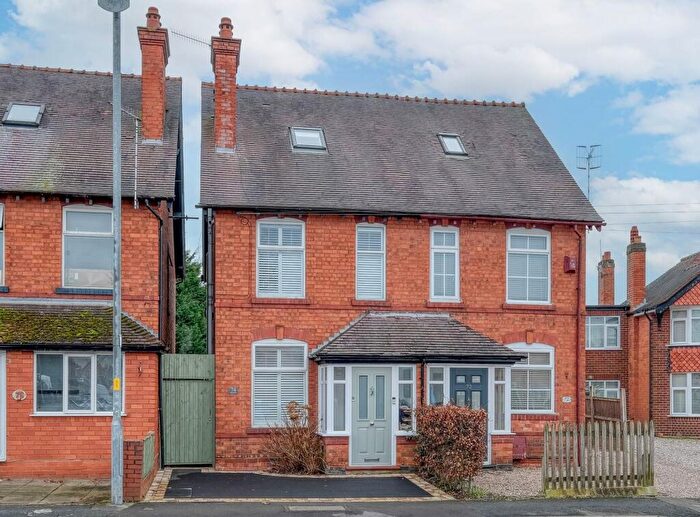
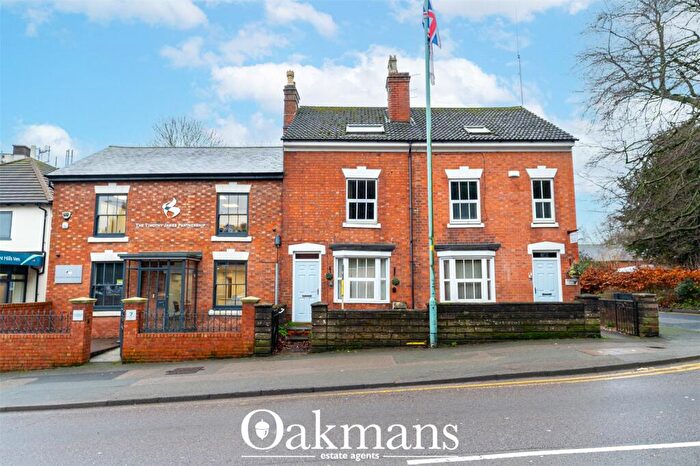
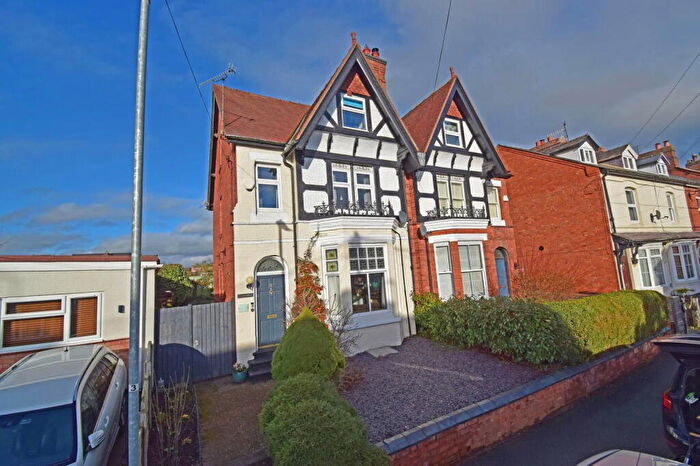
Houses for sale & to rent in Sidemoor, Bromsgrove
House Prices in Sidemoor
Properties in Sidemoor have an average house price of £262,975.00 and had 196 Property Transactions within the last 3 years¹.
Sidemoor is an area in Bromsgrove, Worcestershire with 2,162 households², where the most expensive property was sold for £585,000.00.
Properties for sale in Sidemoor
Roads and Postcodes in Sidemoor
Navigate through our locations to find the location of your next house in Sidemoor, Bromsgrove for sale or to rent.
| Streets | Postcodes |
|---|---|
| All Saints Road | B61 0AG B61 0AQ |
| Arlingham Avenue | B61 8AP B61 8AX |
| Beech Road | B61 8ND B61 8NE B61 8NF B61 8NA |
| Belvedere Drive | B61 0AJ |
| Bewell Gardens | B61 8HW |
| Bewell Head | B61 8HX B61 8HY |
| Birmingham Road | B61 0DJ B61 0DL B61 0DR |
| Broad Street | B61 8LN B61 8LR B61 8LS B61 8LW B61 8NG B61 8NJ B61 8NL B61 8NQ |
| Canberra Close | B61 8BE |
| Chestnut Road | B61 8LT B61 8LY B61 8LZ |
| Churchfields | B61 8DS B61 8DX B61 8EA B61 8BP |
| Churchfields Close | B61 8EE |
| Churchfields Gardens | B61 8DP |
| Churchfields Road | B61 8EB B61 8ED |
| Conifer Grove | B61 8LL |
| Consort Gardens | B61 0DA |
| Crabtree Drive | B61 8NX |
| Crabtree Lane | B61 8NU B61 8NY B61 8PA B61 8PH B61 8PQ |
| Durham Close | B61 8SD |
| Fockbury Mill Lane | B61 8TD |
| Forge Drive | B61 8DR |
| Holly Grove | B61 8LH |
| Holly Road | B61 8LG B61 8LJ B61 8LQ |
| Jasmine Grove | B61 8JX |
| Junction Road | B61 8PG |
| King Edward Avenue | B61 8SP |
| King Edward Road | B61 8SR B61 8SU B61 8SX |
| King George Avenue | B61 8SJ |
| King George Close | B61 8SH B61 8SL B61 8SN B61 8SQ B61 8SW |
| Laburnum Grove | B61 8NB |
| Laurel Grove | B61 8LU |
| Lime Grove | B61 8LX |
| Lincoln Road | B61 8SB B61 8SE |
| Maple Gardens | B61 8NN |
| Melbourne Avenue | B61 8SF B61 8SG |
| Melbourne Close | B61 8NP |
| Melbourne Road | B61 8PE B61 8PF |
| Middleton Road | B61 8NH |
| Moorfield Drive | B61 8EH B61 8EJ |
| Oakland Grove | B61 0AF |
| Oldfield Road | B61 8AD B61 8BA B61 8BB B61 8BD |
| Orchard Road | B61 8HZ |
| Perryfields Crescent | B61 8SS B61 8ST |
| Perryfields Road | B61 8SY B61 8SZ B61 8TA B61 8TB B61 8TH |
| Providence Road | B61 8EF B61 8EG B61 8EL B61 8EQ |
| Recreation Road | B61 8DT B61 8DY |
| Red Pear Drive | B61 8AY |
| Santridge Lane | B61 8JY B61 8JZ |
| Silverdale | B61 8LD |
| Spire View | B61 8DZ |
| Stourbridge Road | B61 0AE B61 0AH B61 0AL B61 0AP B61 0AS B61 0AT B61 0BH B61 0AZ |
| Sydney Road | B61 8PB |
| The Flats | B61 8LB B61 8LE B61 8LF |
| The Orchard | B61 8PZ |
| Victoria Road | B61 0DW |
| York Avenue | B61 8SA |
| York Close | B61 8RX |
| York Road | B61 8RU B61 8RY B61 8RZ |
Transport near Sidemoor
- FAQ
- Price Paid By Year
- Property Type Price
Frequently asked questions about Sidemoor
What is the average price for a property for sale in Sidemoor?
The average price for a property for sale in Sidemoor is £262,975. This amount is 20% lower than the average price in Bromsgrove. There are 1,260 property listings for sale in Sidemoor.
What streets have the most expensive properties for sale in Sidemoor?
The streets with the most expensive properties for sale in Sidemoor are Victoria Road at an average of £469,333, Holly Road at an average of £425,000 and Melbourne Avenue at an average of £348,500.
What streets have the most affordable properties for sale in Sidemoor?
The streets with the most affordable properties for sale in Sidemoor are Oldfield Road at an average of £126,625, Arlingham Avenue at an average of £150,000 and Spire View at an average of £181,000.
Which train stations are available in or near Sidemoor?
Some of the train stations available in or near Sidemoor are Bromsgrove, Barnt Green and Alvechurch.
Property Price Paid in Sidemoor by Year
The average sold property price by year was:
| Year | Average Sold Price | Price Change |
Sold Properties
|
|---|---|---|---|
| 2025 | £249,088 | -12% |
56 Properties |
| 2024 | £278,911 | 7% |
70 Properties |
| 2023 | £258,150 | 1% |
70 Properties |
| 2022 | £254,358 | 5% |
79 Properties |
| 2021 | £241,906 | 5% |
115 Properties |
| 2020 | £230,499 | 4% |
69 Properties |
| 2019 | £221,962 | -4% |
75 Properties |
| 2018 | £229,849 | 12% |
123 Properties |
| 2017 | £202,048 | 6% |
160 Properties |
| 2016 | £189,298 | 6% |
91 Properties |
| 2015 | £177,928 | 11% |
83 Properties |
| 2014 | £157,689 | -1% |
82 Properties |
| 2013 | £159,651 | 10% |
67 Properties |
| 2012 | £143,669 | 2% |
67 Properties |
| 2011 | £140,418 | -12% |
70 Properties |
| 2010 | £156,815 | 7% |
54 Properties |
| 2009 | £146,031 | -18% |
73 Properties |
| 2008 | £172,442 | 5% |
47 Properties |
| 2007 | £164,315 | 5% |
97 Properties |
| 2006 | £155,835 | 4% |
101 Properties |
| 2005 | £149,441 | -5% |
97 Properties |
| 2004 | £156,733 | 14% |
100 Properties |
| 2003 | £134,801 | 22% |
110 Properties |
| 2002 | £105,401 | 13% |
106 Properties |
| 2001 | £91,727 | 16% |
89 Properties |
| 2000 | £77,500 | 4% |
79 Properties |
| 1999 | £74,134 | 10% |
98 Properties |
| 1998 | £66,866 | 3% |
113 Properties |
| 1997 | £65,155 | 14% |
98 Properties |
| 1996 | £55,908 | -1% |
75 Properties |
| 1995 | £56,524 | - |
62 Properties |
Property Price per Property Type in Sidemoor
Here you can find historic sold price data in order to help with your property search.
The average Property Paid Price for specific property types in the last three years are:
| Property Type | Average Sold Price | Sold Properties |
|---|---|---|
| Semi Detached House | £260,853.00 | 87 Semi Detached Houses |
| Detached House | £367,712.00 | 33 Detached Houses |
| Terraced House | £223,459.00 | 49 Terraced Houses |
| Flat | £213,518.00 | 27 Flats |

