Houses for sale & to rent in Whitford, Bromsgrove
House Prices in Whitford
Properties in Whitford have an average house price of £305,033.00 and had 151 Property Transactions within the last 3 years¹.
Whitford is an area in Bromsgrove, Worcestershire with 1,803 households², where the most expensive property was sold for £1,125,000.00.
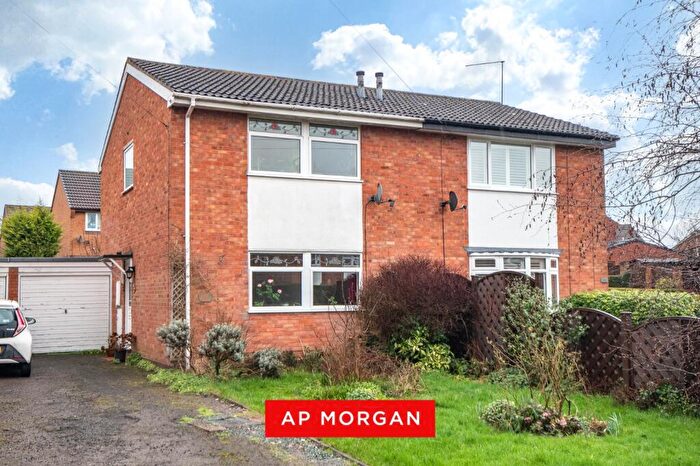
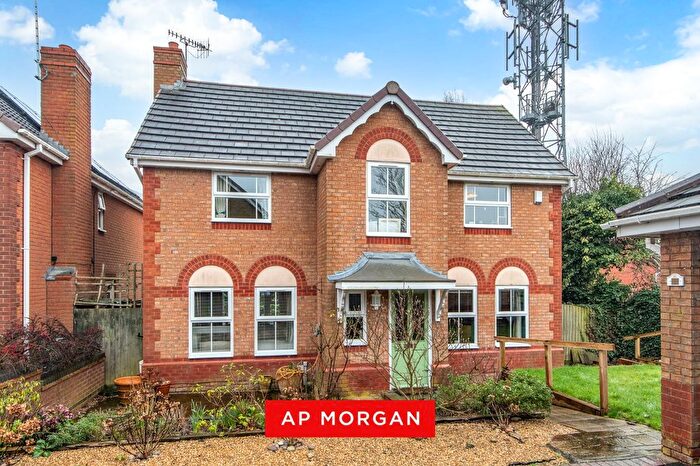
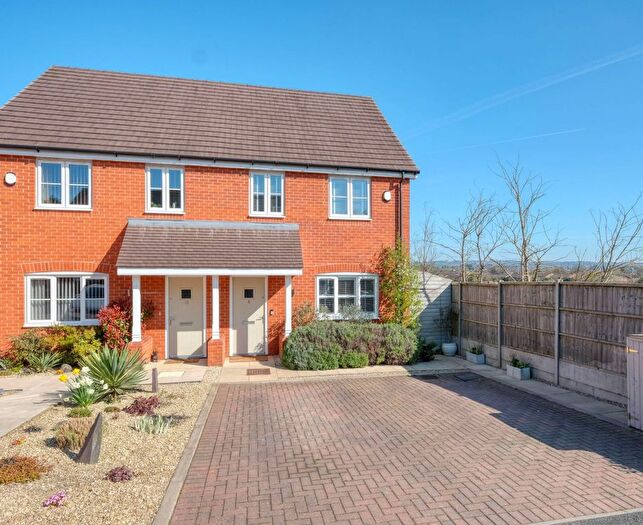
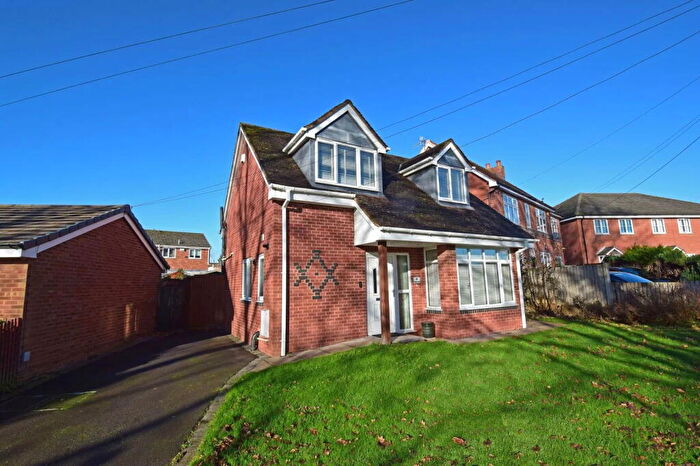
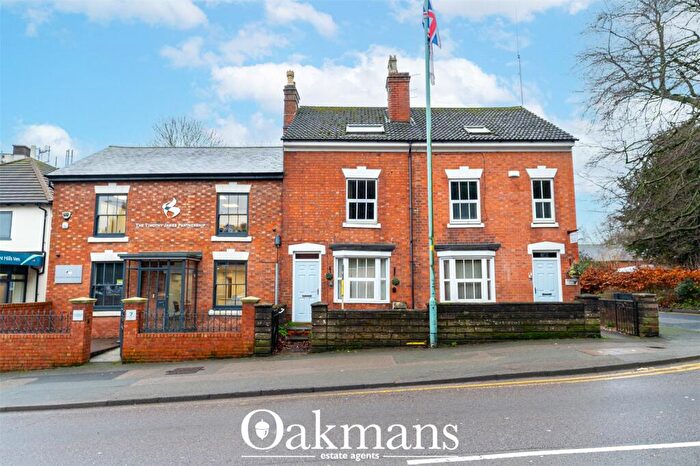
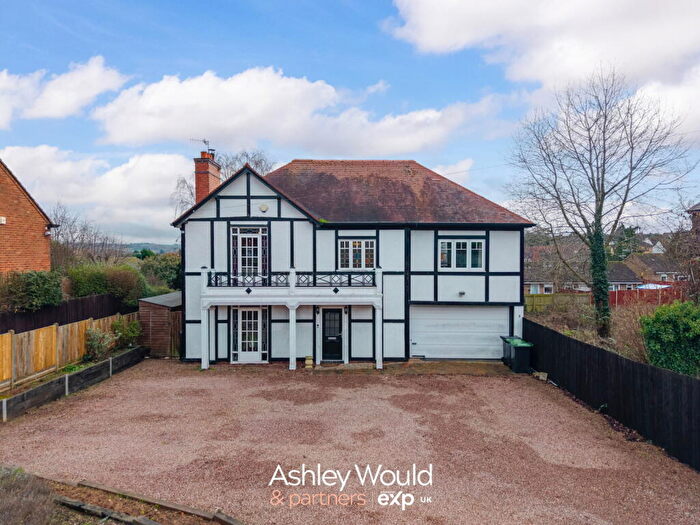
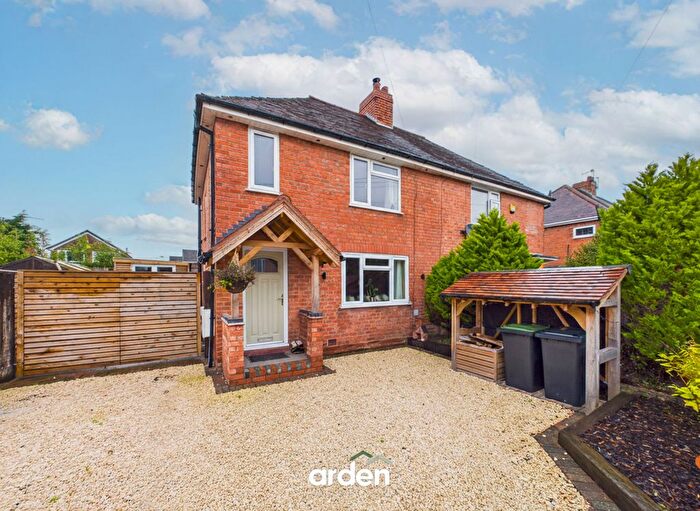
Properties for sale in Whitford
Roads and Postcodes in Whitford
Navigate through our locations to find the location of your next house in Whitford, Bromsgrove for sale or to rent.
| Streets | Postcodes |
|---|---|
| Albert Road | B61 7BE |
| Alderley Road | B61 7LX |
| Barnfield Road | B61 7BJ |
| Breakback Road | B61 7LS B61 7LT B61 7LU B61 7LY |
| Brook Road | B61 7DD B61 7DE |
| Buckfast Close | B61 7PE |
| Bylands Close | B61 7PL |
| Cardinal Crescent | B61 7PR |
| Carnoustie Close | B61 7NP |
| Carol Avenue | B61 8RH B61 8RN B61 8RW |
| Cherry Crescent | B61 7JX |
| Cherry Orchard Drive | B61 8RJ B61 8RL |
| Cotton Pool Road | B61 8RQ |
| Crabtree Lane | B61 8PJ |
| Dawson Road | B61 7JF |
| Deansway | B61 7PF B61 7PG B61 7PJ B61 7PN |
| Dovecote Road | B61 7BN B61 7BP |
| Echells Close | B61 7EB |
| Forelands Grove | B61 7NQ |
| Fox Lane | B61 7NG B61 7NJ B61 7NL |
| Foxwalks Avenue | B61 7NA B61 7NB B61 7ND B61 7NE |
| Grayshott Close | B61 8PT B61 8QA |
| Greenacres Road | B61 8QJ |
| Greyfriars Drive | B61 7LF |
| Harland Close | B61 8QR |
| Highfield Road | B61 7BB B61 7BD |
| Highfields | B61 7BZ B61 7DA |
| Howard Avenue | B61 8PP |
| Kidderminster Road | B61 7JU B61 7JY B61 7JZ B61 7LA B61 7LD |
| Larchmere Drive | B61 8QL |
| Leadbetter Drive | B61 7JG |
| Lynden Close | B61 8PD |
| Malcolm Avenue | B61 8PR |
| Martin Close | B61 7BW |
| Millfield Road | B61 7BL B61 7BT B61 7BU B61 7BX B61 7BY B61 7DB |
| Paget Close | B61 7JE |
| Parkstone Avenue | B61 7NS |
| Parkwood Road | B61 8UA |
| Perryfields Road | B61 8QW |
| Quarry Lane | B61 7NH |
| Regal Gardens | B61 7BF |
| Rock Hill | B61 7HX B61 7LJ B61 7LP B61 7LW |
| Shrubbery Road | B61 7BG B61 7BH B61 7BQ |
| St Andrews Way | B61 7NR |
| Sunningdale Road | B61 7NN |
| Swift Close | B61 7BS |
| Tintern Close | B61 7PH |
| Waltham Close | B61 7PQ |
| Westminster Close | B61 7PP |
| Whitford Close | B61 7LZ |
| Whitford Gardens | B61 7LE |
| Whitford Road | B61 7ED |
| Willow Road | B61 8PS |
| Woburn Close | B61 7PW |
| Worcester Road | B61 7AZ |
Transport near Whitford
- FAQ
- Price Paid By Year
- Property Type Price
Frequently asked questions about Whitford
What is the average price for a property for sale in Whitford?
The average price for a property for sale in Whitford is £305,033. This amount is 8% lower than the average price in Bromsgrove. There are 806 property listings for sale in Whitford.
What streets have the most expensive properties for sale in Whitford?
The streets with the most expensive properties for sale in Whitford are Greyfriars Drive at an average of £815,000, Cotton Pool Road at an average of £620,000 and Kidderminster Road at an average of £521,875.
What streets have the most affordable properties for sale in Whitford?
The streets with the most affordable properties for sale in Whitford are Breakback Road at an average of £193,000, Foxwalks Avenue at an average of £206,750 and Whitford Close at an average of £233,600.
Which train stations are available in or near Whitford?
Some of the train stations available in or near Whitford are Bromsgrove, Barnt Green and Alvechurch.
Property Price Paid in Whitford by Year
The average sold property price by year was:
| Year | Average Sold Price | Price Change |
Sold Properties
|
|---|---|---|---|
| 2025 | £304,282 | -0,4% |
39 Properties |
| 2024 | £305,365 | - |
51 Properties |
| 2023 | £305,235 | -7% |
61 Properties |
| 2022 | £325,928 | 18% |
67 Properties |
| 2021 | £267,175 | 7% |
97 Properties |
| 2020 | £248,469 | 1% |
54 Properties |
| 2019 | £247,223 | 4% |
84 Properties |
| 2018 | £236,895 | -1% |
75 Properties |
| 2017 | £238,603 | 15% |
81 Properties |
| 2016 | £202,687 | 4% |
65 Properties |
| 2015 | £194,853 | 3% |
75 Properties |
| 2014 | £188,104 | 9% |
94 Properties |
| 2013 | £171,692 | -2% |
52 Properties |
| 2012 | £175,627 | -6% |
54 Properties |
| 2011 | £185,358 | -1% |
77 Properties |
| 2010 | £186,430 | 5% |
56 Properties |
| 2009 | £177,578 | 1% |
50 Properties |
| 2008 | £174,997 | -16% |
52 Properties |
| 2007 | £203,722 | 12% |
82 Properties |
| 2006 | £179,635 | -0,1% |
82 Properties |
| 2005 | £179,817 | 9% |
84 Properties |
| 2004 | £162,775 | 4% |
89 Properties |
| 2003 | £156,553 | 26% |
76 Properties |
| 2002 | £116,173 | 9% |
115 Properties |
| 2001 | £106,113 | -14% |
115 Properties |
| 2000 | £121,460 | 28% |
120 Properties |
| 1999 | £87,852 | 10% |
123 Properties |
| 1998 | £79,499 | 8% |
82 Properties |
| 1997 | £72,824 | -13% |
111 Properties |
| 1996 | £82,397 | 6% |
135 Properties |
| 1995 | £77,451 | - |
86 Properties |
Property Price per Property Type in Whitford
Here you can find historic sold price data in order to help with your property search.
The average Property Paid Price for specific property types in the last three years are:
| Property Type | Average Sold Price | Sold Properties |
|---|---|---|
| Semi Detached House | £287,840.00 | 53 Semi Detached Houses |
| Detached House | £452,474.00 | 39 Detached Houses |
| Terraced House | £234,712.00 | 53 Terraced Houses |
| Flat | £119,700.00 | 6 Flats |

