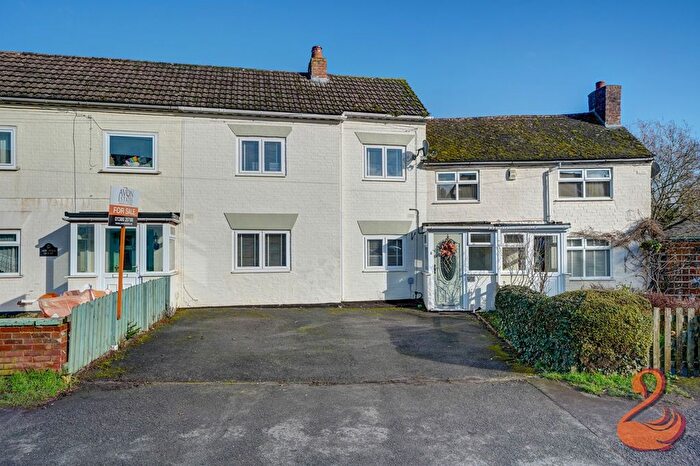
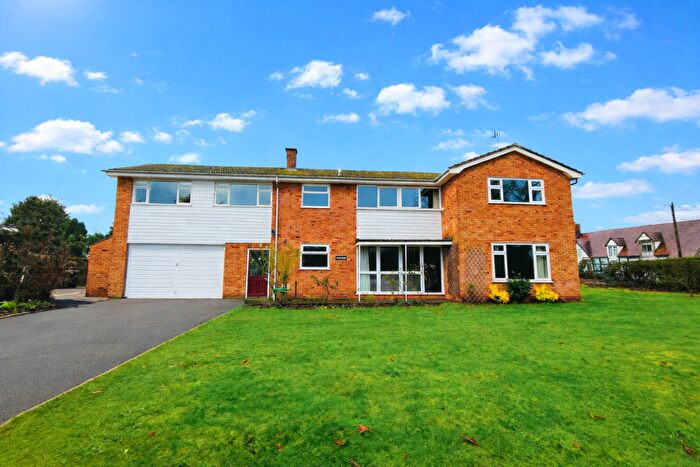
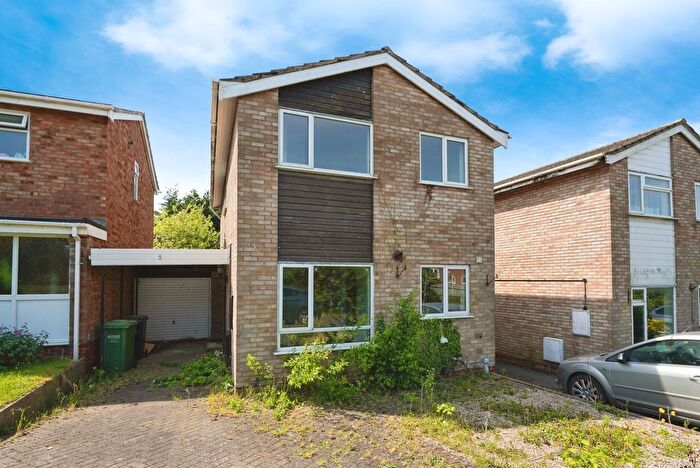
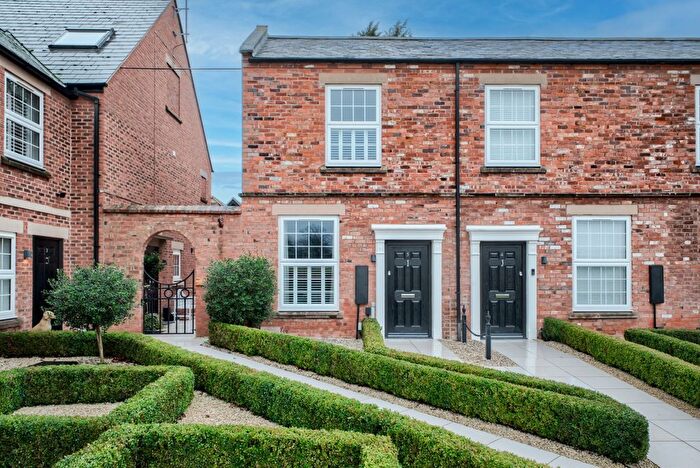
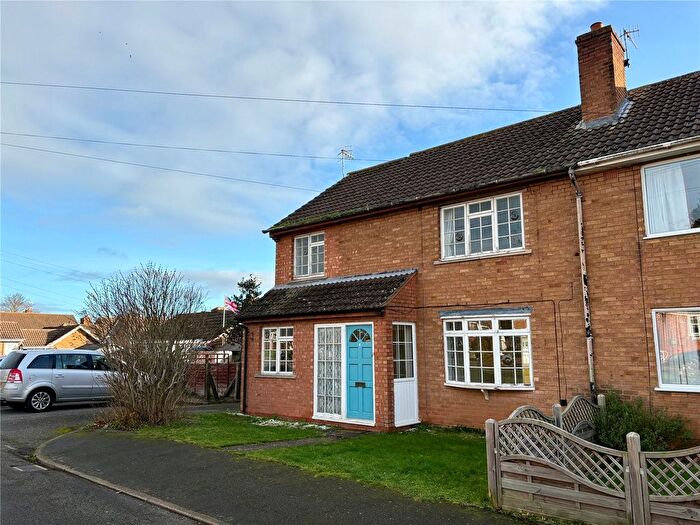
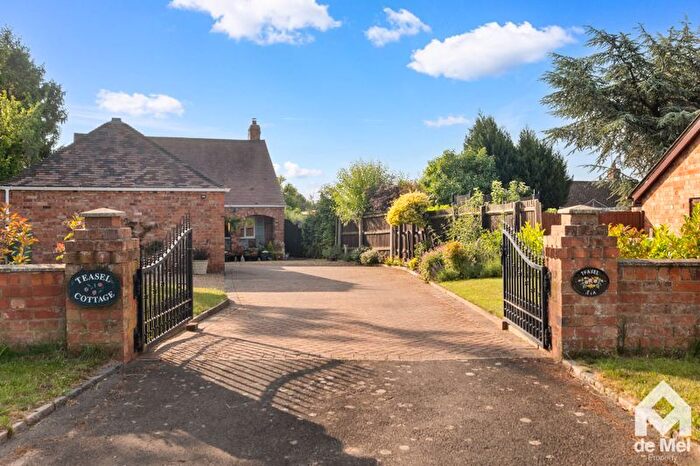
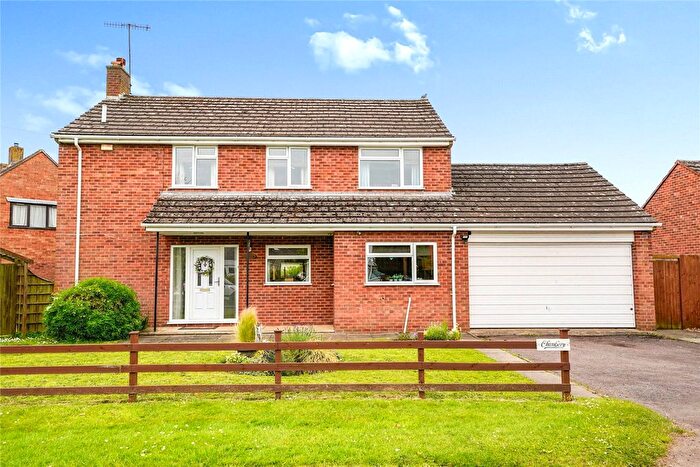
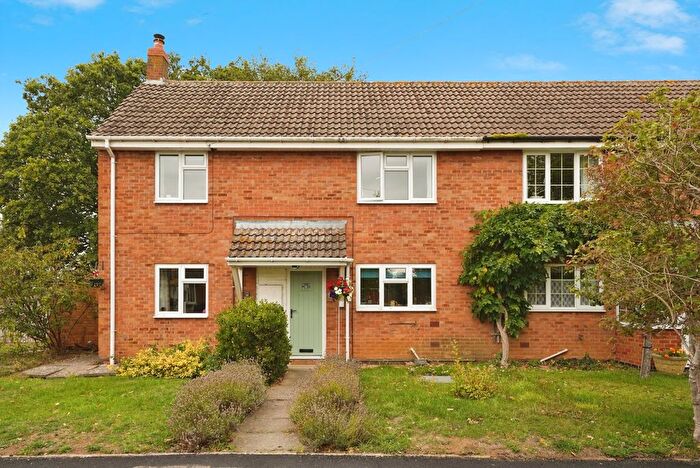
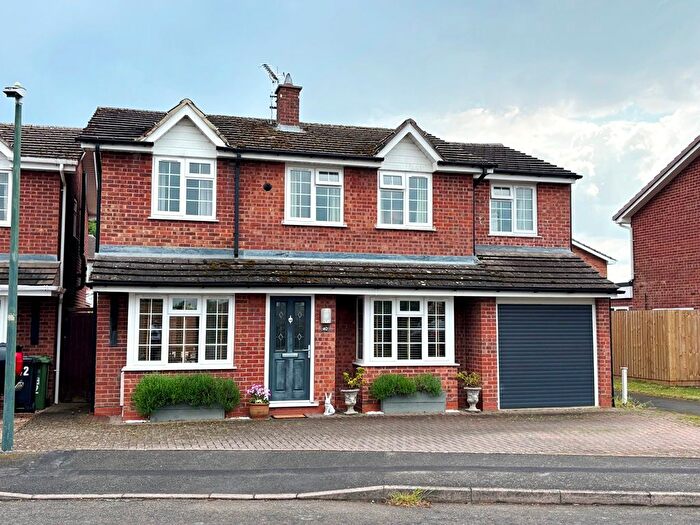
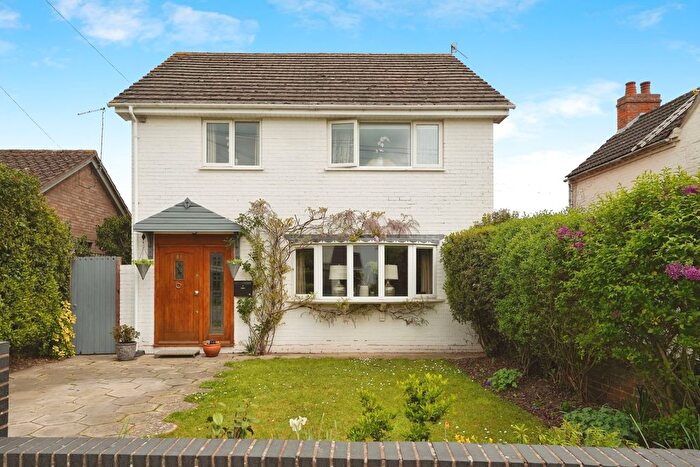
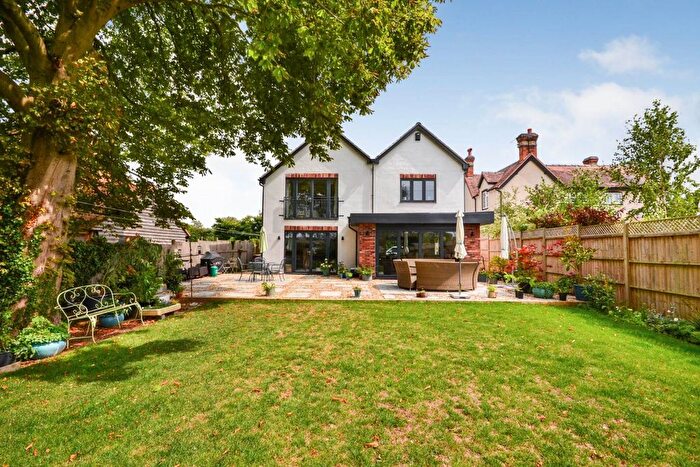
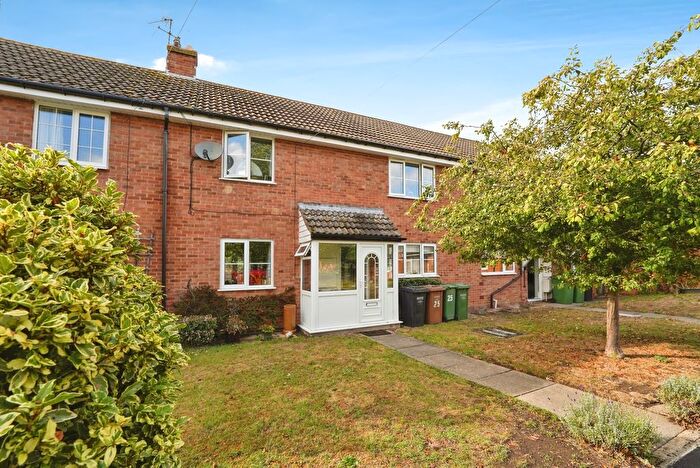
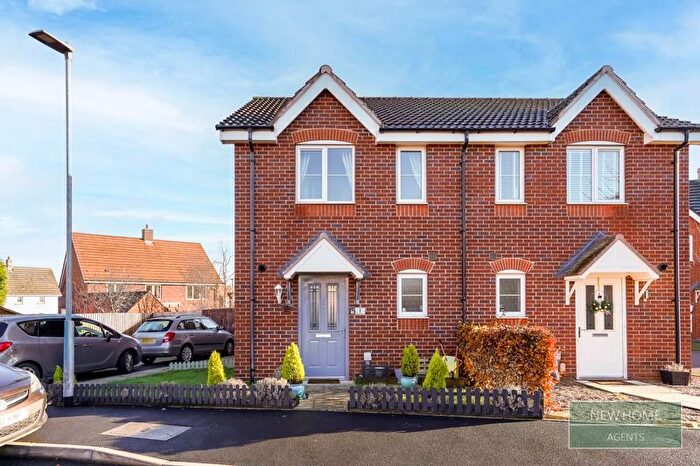
Houses for sale & to rent in Harvington And Norton, Evesham
House Prices in Harvington And Norton
Properties in Harvington And Norton have an average house price of £405,547.00 and had 108 Property Transactions within the last 3 years¹.
Harvington And Norton is an area in Evesham, Worcestershire with 1,097 households², where the most expensive property was sold for £1,340,000.00.
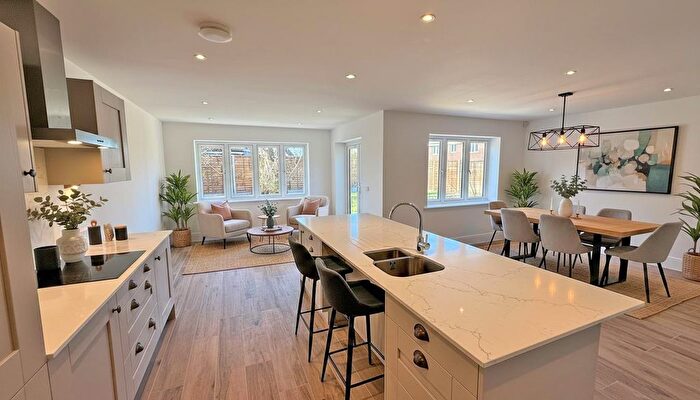
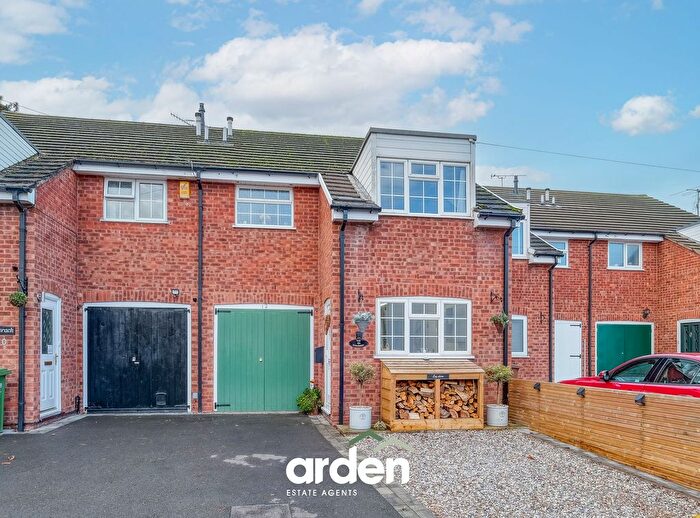
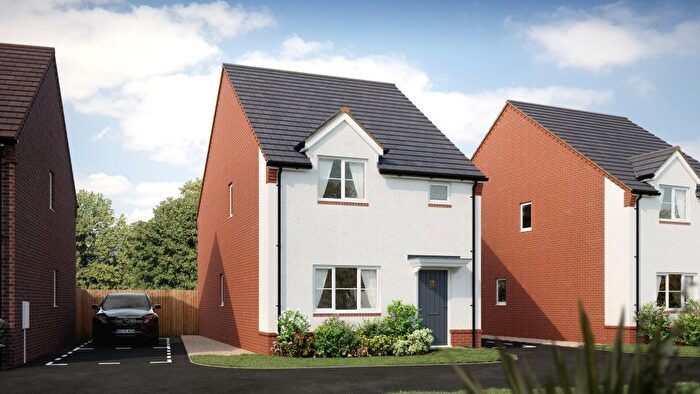
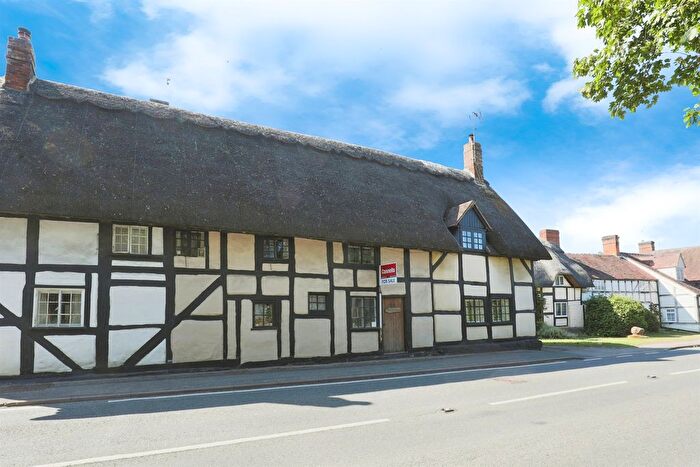
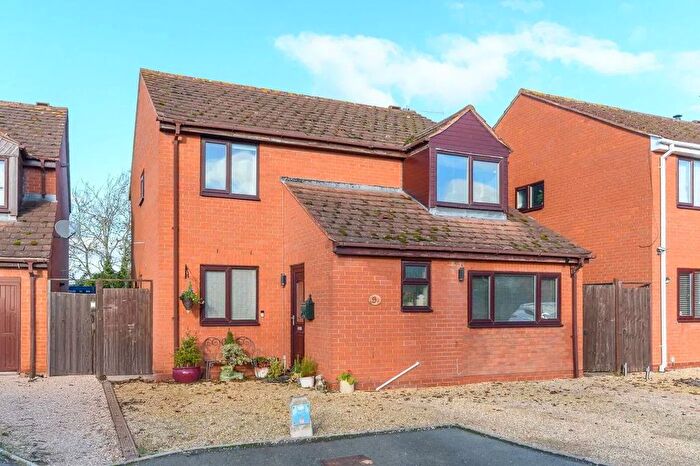
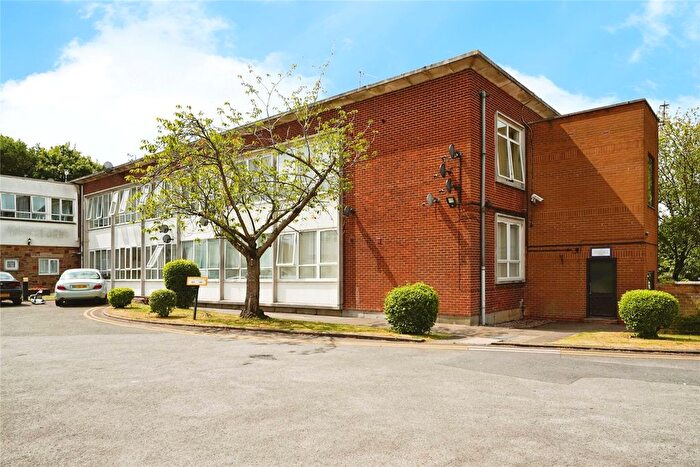
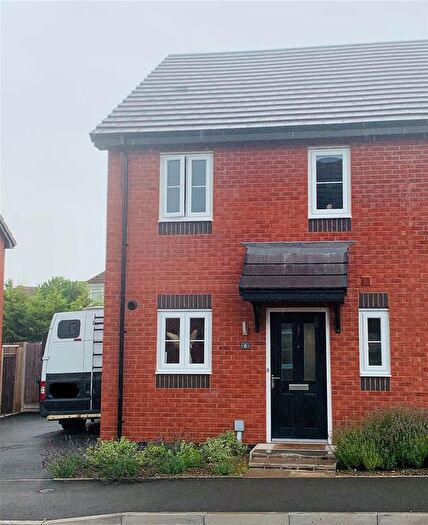
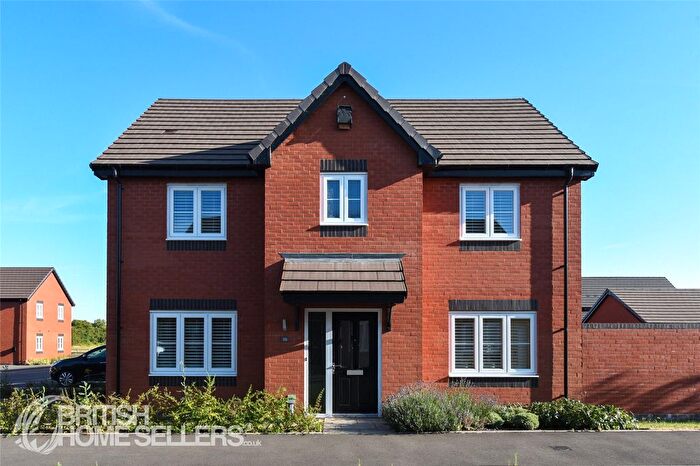
Properties for sale in Harvington And Norton
Previously listed properties in Harvington And Norton
Roads and Postcodes in Harvington And Norton
Navigate through our locations to find the location of your next house in Harvington And Norton, Evesham for sale or to rent.
| Streets | Postcodes |
|---|---|
| Abbots Salford Road | WR11 8XJ |
| Alcester Road | WR11 8LY WR11 8NT |
| Anchor Lane | WR11 8PA |
| Blakenhurst | WR11 8NB |
| Blayneys Lane | WR11 4TR |
| Bromley Close | WR11 8GR |
| Brookedale | WR11 8ND |
| Byrd Row | WR11 4TF |
| Chadbury Road | WR11 4TX |
| Church Street | WR11 8PB |
| Church Walk | WR11 4HY WR11 4LT |
| Copper Beech Close | WR11 8PF |
| Crest Hill | WR11 8NS |
| Evesham Road | WR11 4TL WR11 4TW WR11 8AD WR11 8HU WR11 8HX WR11 8LU WR11 4TY WR11 8HY |
| Finch Lane | WR11 8DQ WR11 8NY |
| Glebe Cottages | WR11 8NN |
| Grange Lane | WR11 8NL |
| Greenacres Lane | WR11 8PE |
| Groves Close | WR11 8JG |
| Harvest Court | WR11 8LT |
| Harvington Lane | WR11 4TN |
| Harvington Mews | WR11 8HB |
| Hawkes Piece | WR11 8HW |
| Heathfield Road | WR11 4TQ |
| Hipton Hill | WR11 4UA |
| Hopkiln Cottages | WR11 8PU |
| Hughes Close | WR11 8NZ |
| Hughes Lane | WR11 8NH |
| Kings Lane | WR11 4TJ |
| Leys Road | WR11 8JA WR11 8LZ WR11 8NA WR11 8SS |
| Leysfield | WR11 8JF |
| Lloyd Close | WR11 4LZ |
| Malt House Close | WR11 8NX |
| Manor Park | WR11 8DH |
| Marsh Close | WR11 8JE |
| Myatts Field | WR11 8NG |
| Newing Court | WR11 8EJ |
| Oak Tree Road | WR11 8NE |
| Orchard Place | WR11 8NF |
| Poplar Way | WR11 8JD |
| Ragley Road | WR11 8NU |
| Rectory Close | WR11 8NW |
| St Egwins Road | WR11 4TH |
| St James Close | WR11 8PZ |
| Station Road | WR11 8NJ |
| Stratford Road | WR11 8NP WR11 8PX WR11 8PP |
| The Grove | WR11 8NR |
| The Orchard | WR11 4RT |
| The Rowans | WR11 8SX |
| Twyford Gardens | WR11 4DF |
| Village Street | WR11 8NQ WR11 8PQ |
| Walnut Close | WR11 8LS |
| Worcester Road | WR11 4TD |
| WR11 4TG WR11 4TP WR11 4DS WR11 4YB |
Transport near Harvington And Norton
-
Evesham Station
-
Honeybourne Station
-
Pershore Station
-
Wilmcote Station
-
Stratford Pkway Station
-
Stratford-Upon-Avon Station
- FAQ
- Price Paid By Year
- Property Type Price
Frequently asked questions about Harvington And Norton
What is the average price for a property for sale in Harvington And Norton?
The average price for a property for sale in Harvington And Norton is £405,547. This amount is 26% higher than the average price in Evesham. There are 432 property listings for sale in Harvington And Norton.
What streets have the most expensive properties for sale in Harvington And Norton?
The streets with the most expensive properties for sale in Harvington And Norton are Worcester Road at an average of £991,666, Greenacres Lane at an average of £975,000 and Blayneys Lane at an average of £607,250.
What streets have the most affordable properties for sale in Harvington And Norton?
The streets with the most affordable properties for sale in Harvington And Norton are Poplar Way at an average of £245,000, Heathfield Road at an average of £257,500 and Hughes Lane at an average of £259,750.
Which train stations are available in or near Harvington And Norton?
Some of the train stations available in or near Harvington And Norton are Evesham, Honeybourne and Pershore.
Property Price Paid in Harvington And Norton by Year
The average sold property price by year was:
| Year | Average Sold Price | Price Change |
Sold Properties
|
|---|---|---|---|
| 2025 | £416,725 | 0,2% |
31 Properties |
| 2024 | £416,060 | 8% |
41 Properties |
| 2023 | £383,948 | -2% |
36 Properties |
| 2022 | £392,857 | -7% |
40 Properties |
| 2021 | £419,807 | 10% |
67 Properties |
| 2020 | £377,620 | -11% |
29 Properties |
| 2019 | £419,947 | 21% |
61 Properties |
| 2018 | £331,364 | 8% |
57 Properties |
| 2017 | £303,594 | -1% |
42 Properties |
| 2016 | £306,926 | 7% |
41 Properties |
| 2015 | £286,161 | 7% |
55 Properties |
| 2014 | £264,927 | 1% |
33 Properties |
| 2013 | £263,528 | 16% |
38 Properties |
| 2012 | £221,369 | -19% |
32 Properties |
| 2011 | £262,713 | -6% |
37 Properties |
| 2010 | £277,933 | 4% |
30 Properties |
| 2009 | £267,492 | 12% |
20 Properties |
| 2008 | £234,463 | -13% |
18 Properties |
| 2007 | £264,110 | 8% |
49 Properties |
| 2006 | £241,750 | 0,1% |
60 Properties |
| 2005 | £241,524 | -5% |
44 Properties |
| 2004 | £253,856 | 20% |
44 Properties |
| 2003 | £203,241 | 20% |
49 Properties |
| 2002 | £162,279 | -1% |
64 Properties |
| 2001 | £164,445 | 22% |
43 Properties |
| 2000 | £128,228 | 12% |
37 Properties |
| 1999 | £112,696 | 5% |
57 Properties |
| 1998 | £106,540 | 10% |
51 Properties |
| 1997 | £95,890 | 15% |
31 Properties |
| 1996 | £81,570 | -5% |
45 Properties |
| 1995 | £85,633 | - |
26 Properties |
Property Price per Property Type in Harvington And Norton
Here you can find historic sold price data in order to help with your property search.
The average Property Paid Price for specific property types in the last three years are:
| Property Type | Average Sold Price | Sold Properties |
|---|---|---|
| Semi Detached House | £317,333.00 | 21 Semi Detached Houses |
| Detached House | £505,745.00 | 46 Detached Houses |
| Terraced House | £293,528.00 | 17 Terraced Houses |
| Flat | £370,035.00 | 24 Flats |

