Houses for sale & to rent in Evesham, Worcestershire
House Prices in Evesham
Properties in Evesham have an average house price of £321,468.00 and had 1,692 Property Transactions within the last 3 years.¹
Evesham is an area in Worcestershire with 16,631 households², where the most expensive property was sold for £1,606,600.00.
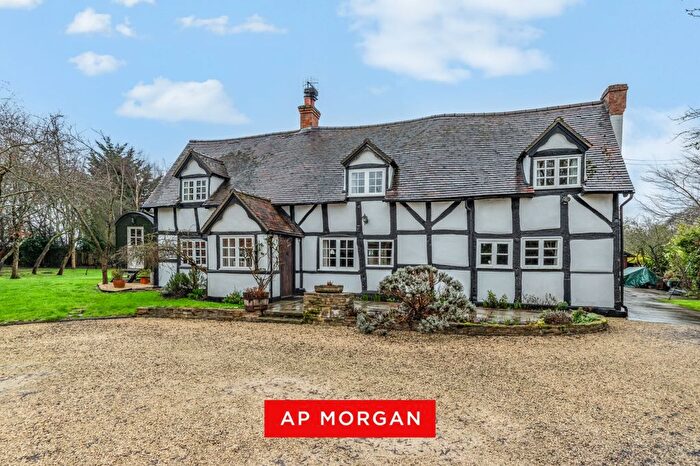
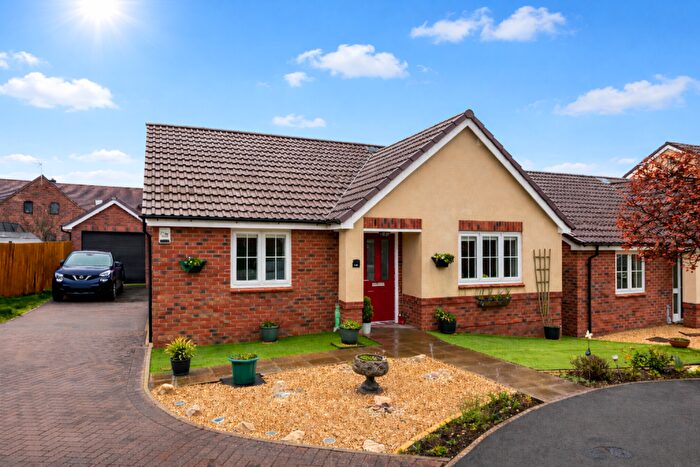
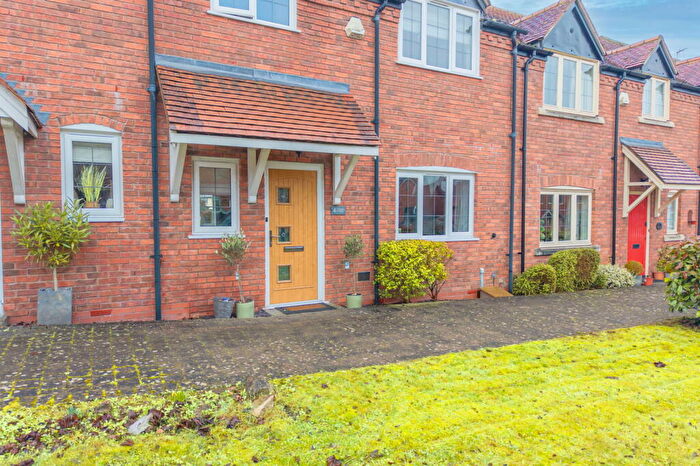
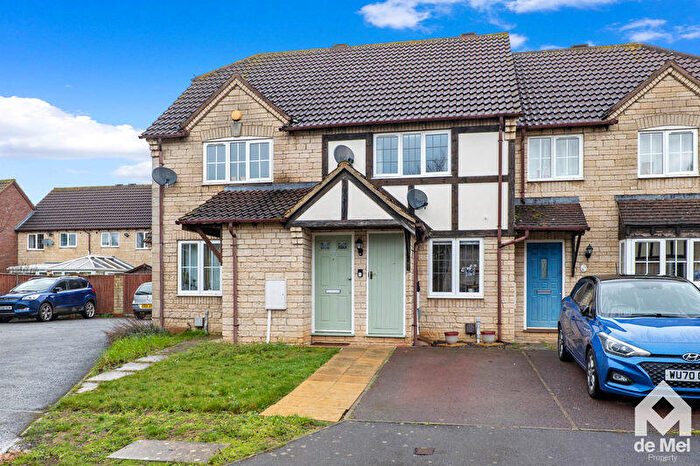
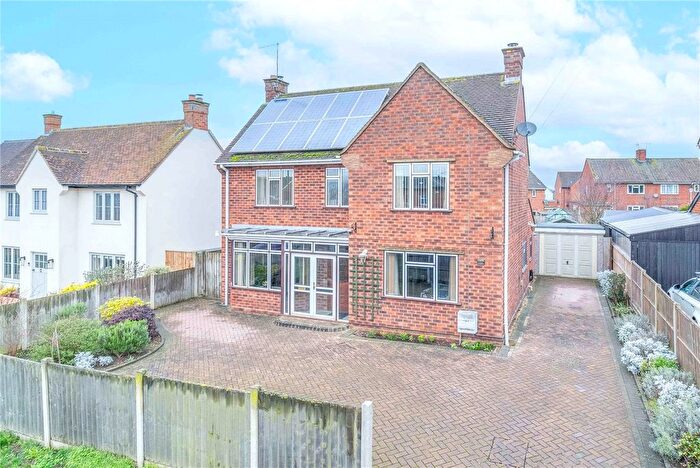
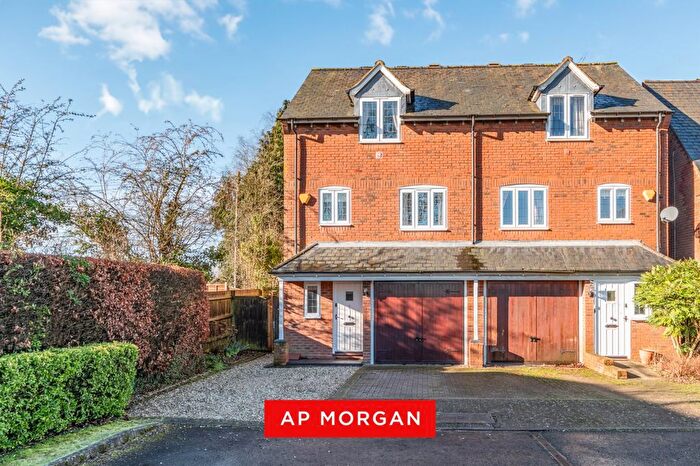
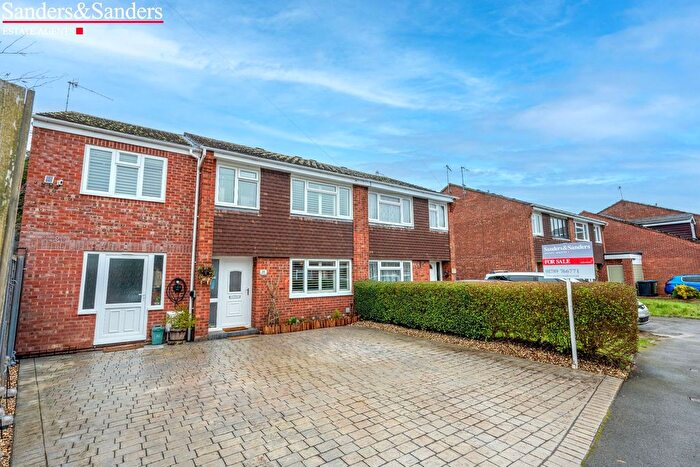
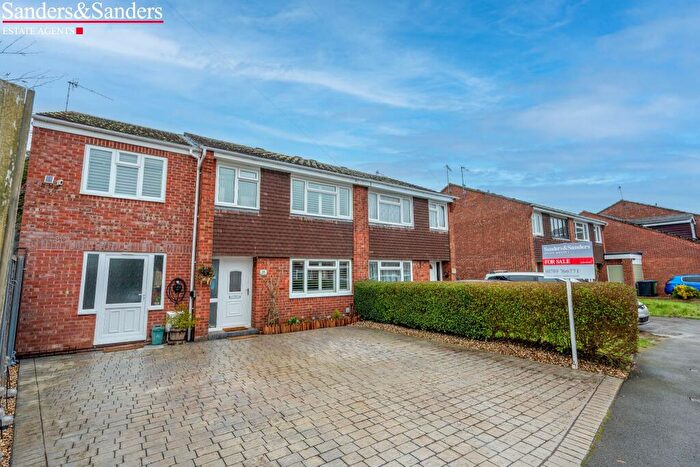
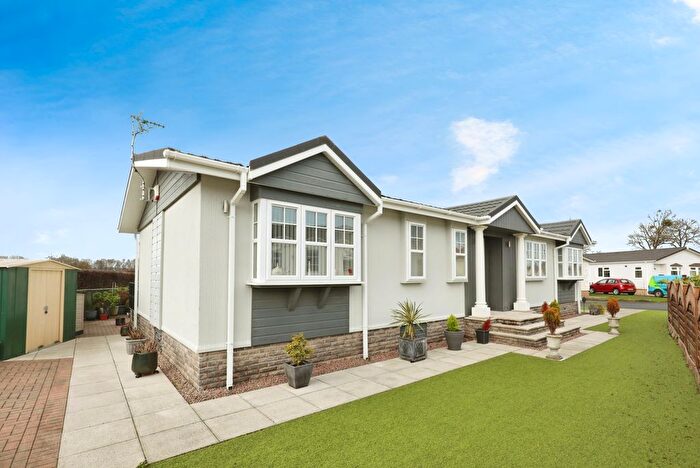
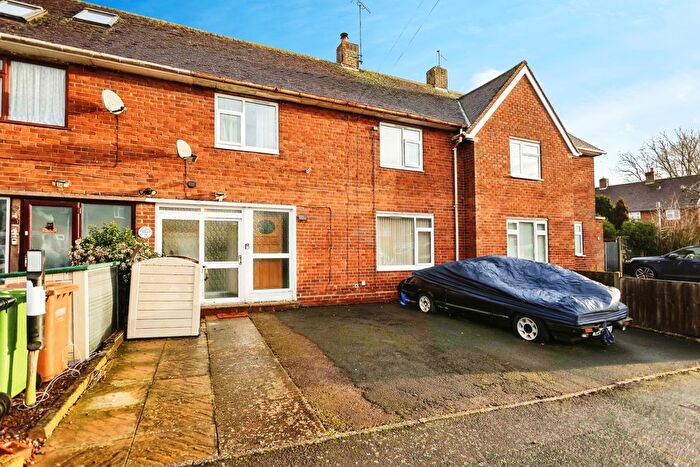
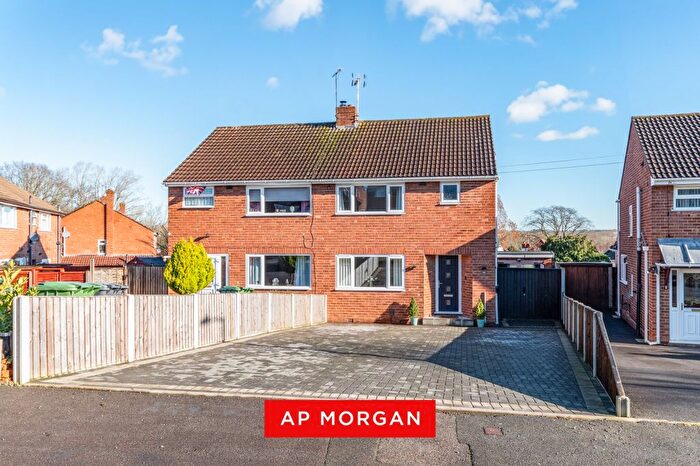
Properties for sale in Evesham
Neighbourhoods in Evesham
Navigate through our locations to find the location of your next house in Evesham, Worcestershire for sale or to rent.
- Badsey
- Bengeworth
- Bretforton And Offenham
- Broadway And Wickhamford
- Elmley Castle And Somerville
- Evesham North
- Evesham South
- Fladbury
- Great Hampton
- Harvington And Norton
- Honeybourne And Pebworth
- Inkberrow
- Link
- Little Hampton
- South Bredon Hill
- The Littletons
- Hampton
- Honeybourne, Pebworth & The Littletons
- Bretforton & Offenham
- Bredon Hill
- Harvington & Norton
Transport in Evesham
Please see below transportation links in this area:
- FAQ
- Price Paid By Year
- Property Type Price
Frequently asked questions about Evesham
What is the average price for a property for sale in Evesham?
The average price for a property for sale in Evesham is £321,468. This amount is 0.15% lower than the average price in Worcestershire. There are more than 10,000 property listings for sale in Evesham.
What locations have the most expensive properties for sale in Evesham?
The locations with the most expensive properties for sale in Evesham are Inkberrow at an average of £587,227, South Bredon Hill at an average of £481,071 and Fladbury at an average of £455,000.
What locations have the most affordable properties for sale in Evesham?
The locations with the most affordable properties for sale in Evesham are Link at an average of £242,500, Evesham North at an average of £249,622 and Bengeworth at an average of £269,721.
Which train stations are available in or near Evesham?
Some of the train stations available in or near Evesham are Evesham, Honeybourne and Pershore.
Property Price Paid in Evesham by Year
The average sold property price by year was:
| Year | Average Sold Price | Price Change |
Sold Properties
|
|---|---|---|---|
| 2025 | £323,307 | -2% |
535 Properties |
| 2024 | £328,302 | 5% |
617 Properties |
| 2023 | £311,837 | 1% |
540 Properties |
| 2022 | £307,439 | 1% |
721 Properties |
| 2021 | £305,765 | 8% |
908 Properties |
| 2020 | £281,420 | 6% |
650 Properties |
| 2019 | £263,399 | -1% |
752 Properties |
| 2018 | £267,107 | 5% |
931 Properties |
| 2017 | £253,383 | 5% |
853 Properties |
| 2016 | £241,933 | 5% |
963 Properties |
| 2015 | £230,144 | 8% |
1,102 Properties |
| 2014 | £211,747 | 2% |
953 Properties |
| 2013 | £207,710 | 4% |
714 Properties |
| 2012 | £199,045 | -5% |
540 Properties |
| 2011 | £209,405 | -4% |
518 Properties |
| 2010 | £218,285 | 9% |
469 Properties |
| 2009 | £198,192 | -3% |
436 Properties |
| 2008 | £204,465 | -4% |
394 Properties |
| 2007 | £212,416 | 4% |
808 Properties |
| 2006 | £204,892 | 5% |
916 Properties |
| 2005 | £194,306 | 3% |
710 Properties |
| 2004 | £187,614 | 16% |
830 Properties |
| 2003 | £157,250 | 13% |
964 Properties |
| 2002 | £136,395 | 15% |
1,071 Properties |
| 2001 | £116,176 | 6% |
970 Properties |
| 2000 | £108,785 | 16% |
921 Properties |
| 1999 | £90,950 | 10% |
1,021 Properties |
| 1998 | £81,537 | 8% |
941 Properties |
| 1997 | £75,086 | 10% |
985 Properties |
| 1996 | £67,353 | 7% |
932 Properties |
| 1995 | £62,437 | - |
735 Properties |
Property Price per Property Type in Evesham
Here you can find historic sold price data in order to help with your property search.
The average Property Paid Price for specific property types in the last three years are:
| Property Type | Average Sold Price | Sold Properties |
|---|---|---|
| Semi Detached House | £281,765.00 | 527 Semi Detached Houses |
| Terraced House | £243,501.00 | 411 Terraced Houses |
| Detached House | £452,415.00 | 587 Detached Houses |
| Flat | £178,366.00 | 167 Flats |

