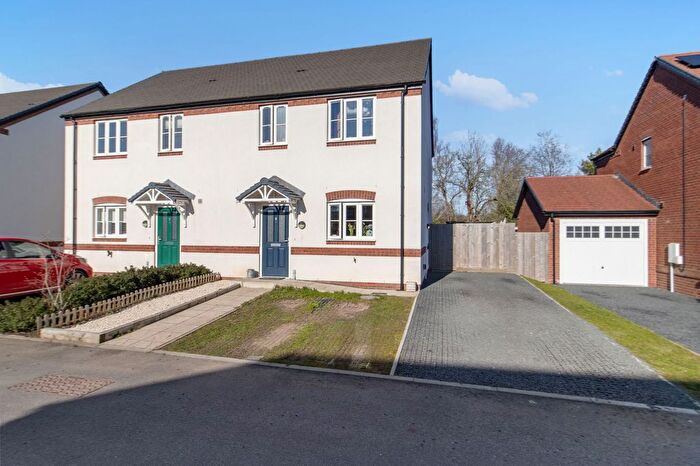
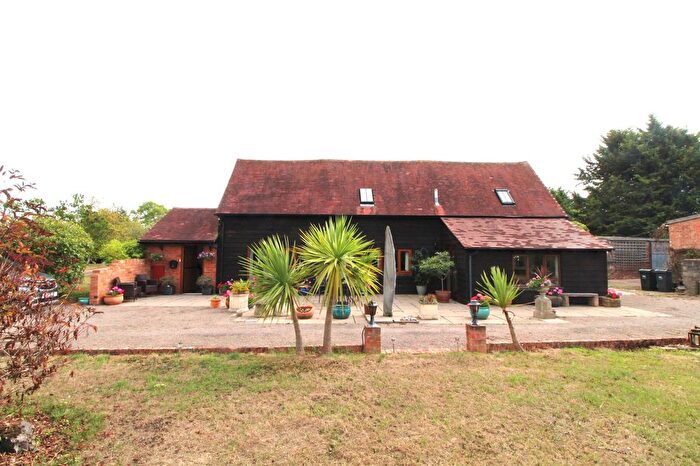
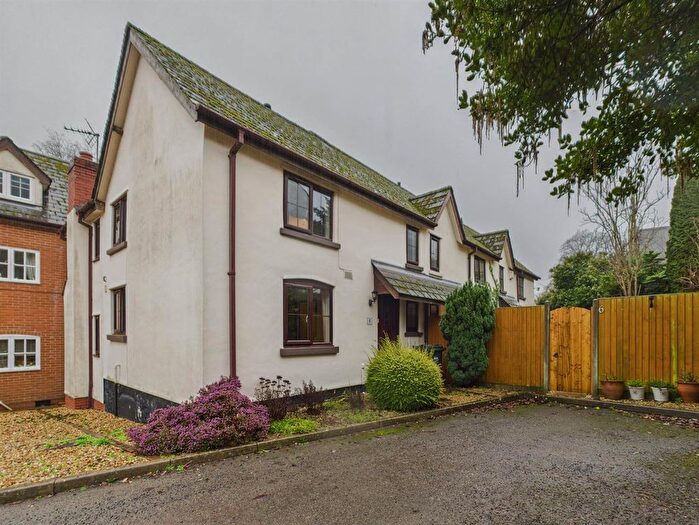
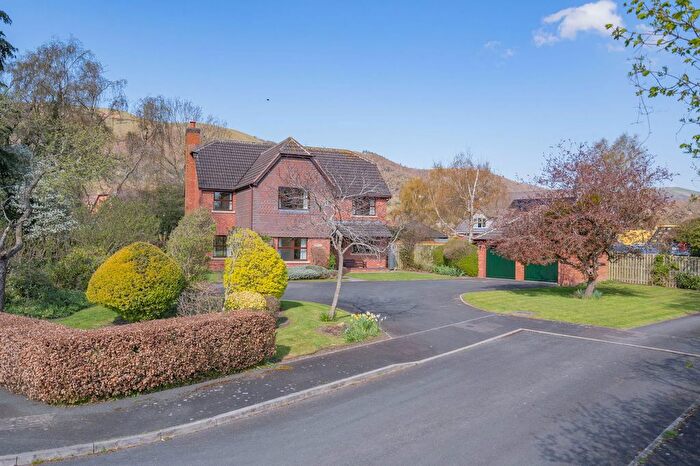
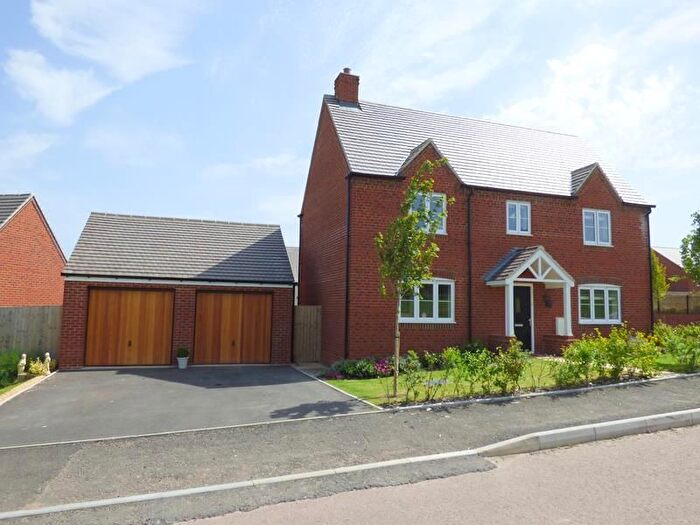
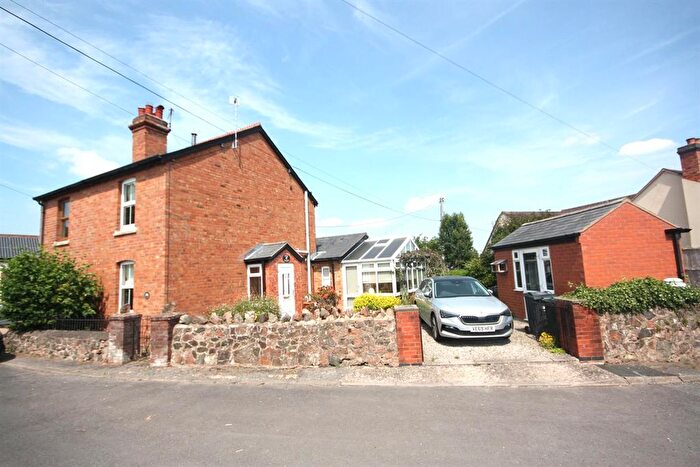
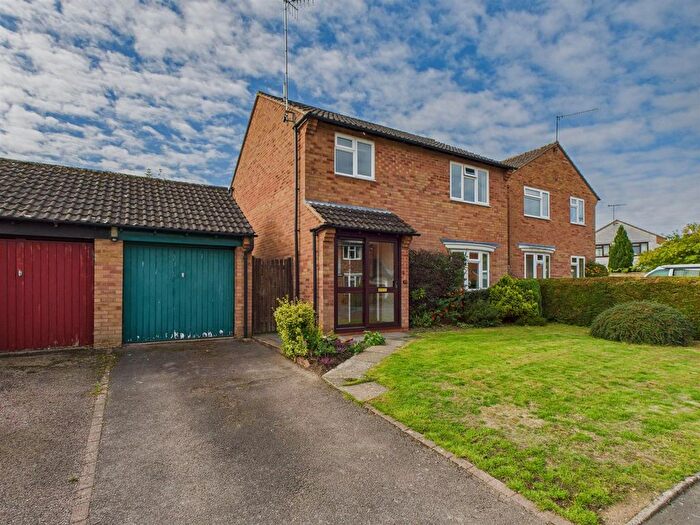
Houses for sale & to rent in Morton, Malvern
House Prices in Morton
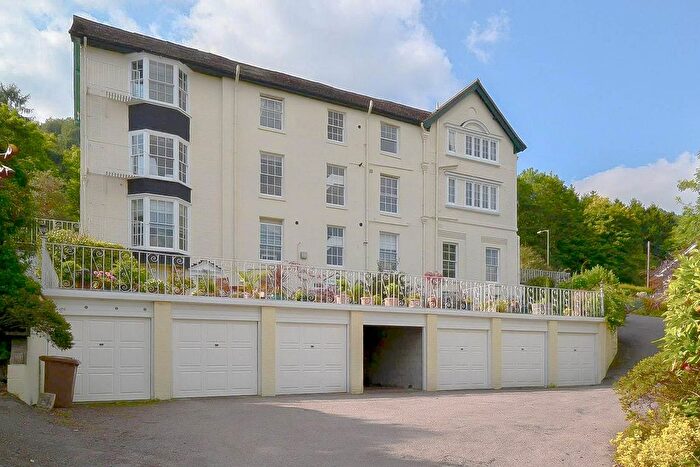
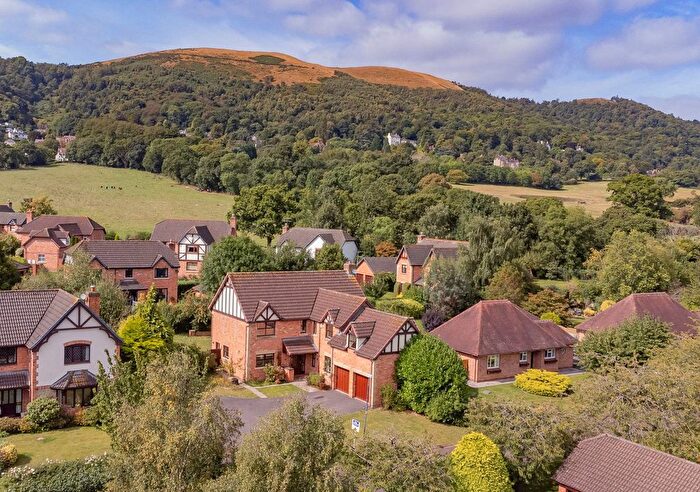
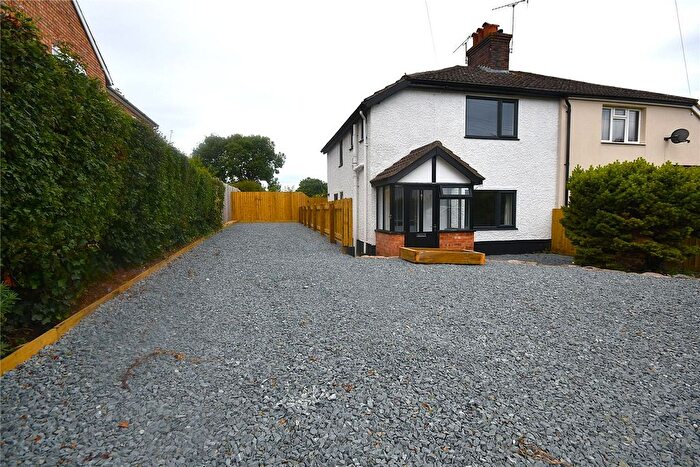
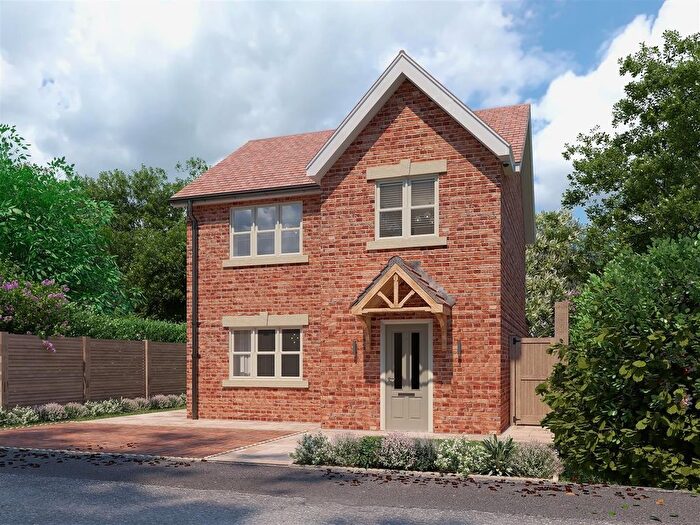
Properties in Morton have an average house price of £463,734.00 and had 69 Property Transactions within the last 3 years¹.
Morton is an area in Malvern, Worcestershire with 736 households², where the most expensive property was sold for £1,150,000.00.
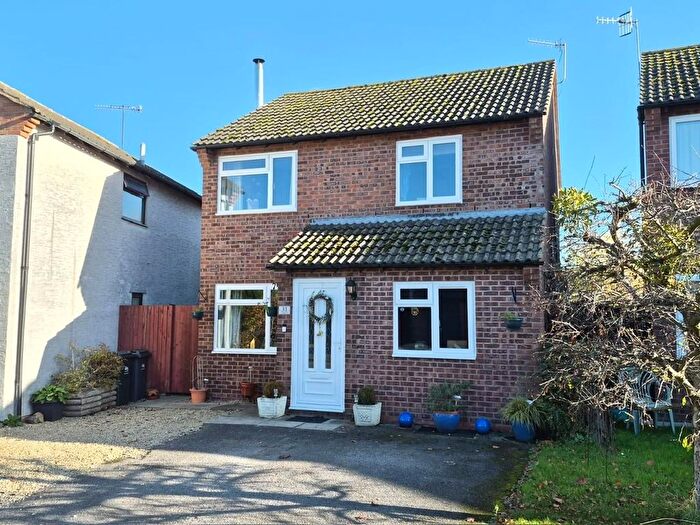
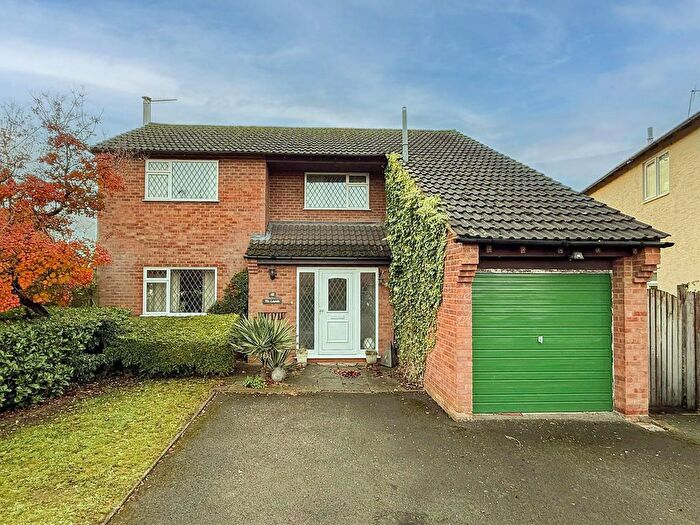
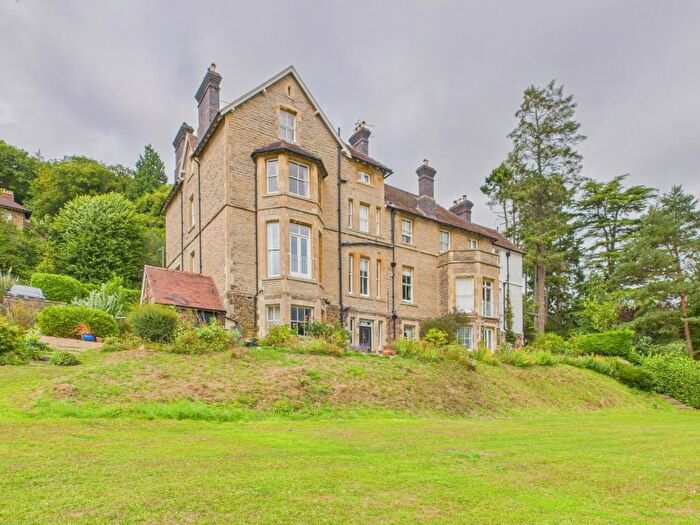
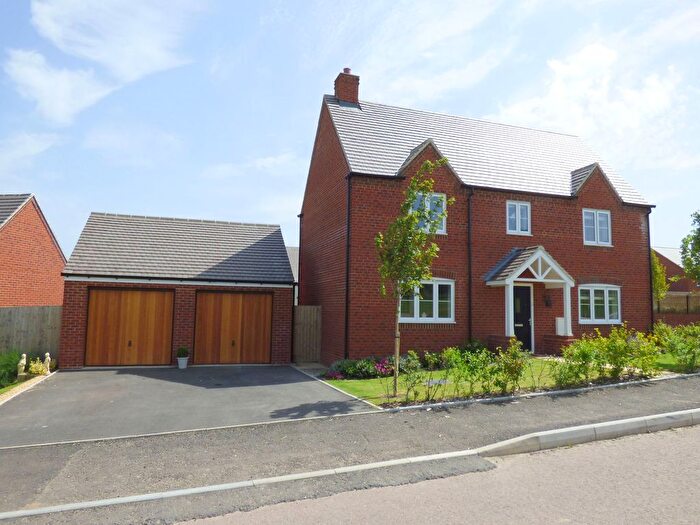
Properties for sale in Morton
Previously listed properties in Morton
Roads and Postcodes in Morton
Navigate through our locations to find the location of your next house in Morton, Malvern for sale or to rent.
| Streets | Postcodes |
|---|---|
| Berrow | WR13 6AL |
| Birts Street | WR13 6AP WR13 6AW |
| Blackmore Park Road | WR13 6NL |
| Blandford Close | WR13 6SF |
| Brookside | WR13 6SA |
| Byefields Lane | WR13 6LW |
| Castlemorton Common | WR13 6LE WR13 6LH WR13 6LQ |
| Chestnut Close | WR13 6SD |
| Church Road | WR13 6BE WR13 6BG WR13 6BH WR13 6BQ |
| Cobham Close | WR13 6SG |
| Coombe Green | WR13 6AD WR13 6AN |
| Cornfield Close | WR13 6RS |
| Drake Street | WR13 6LN WR13 6LP |
| Druggers End Lane | WR13 6JD |
| Eight Oaks | WR13 6BU |
| Fortune Avenue | WR13 6SR |
| Gainsborough Close | WR13 6SH |
| Garrett Bank | WR13 6NF |
| Giffard Drive | WR13 6SE |
| Gloucester Road | WR13 6AF WR13 6BS WR13 6JB WR13 6LA WR13 6LD WR13 6JA WR13 6JF |
| Golden Valley | WR13 6AA |
| Hancocks Lane | WR13 6LG |
| Hill End | WR13 6BL |
| Hollybed Street | WR13 6DB |
| Kingston Close | WR13 6LZ |
| Lime Grove | WR13 6LY |
| Little Welland Lane | WR13 6BN |
| Marlbank Road | WR13 6NA WR13 6ND WR13 6NE |
| Merryfields | WR13 6LL |
| Merrylegs Close | WR13 6ST |
| Morton Green | WR13 6LR |
| New Road | WR13 6BT |
| Orchard Close | WR13 6AJ |
| Orleton Close | WR13 6SQ |
| Pearmain Avenue | WR13 6SU |
| Pippin Drive | WR13 6SL WR13 6SN |
| Reynolds Close | WR13 6SJ |
| Rye Street | WR13 6AS |
| Spring Meadows Close | WR13 6LX |
| The Avenue | WR13 6SB |
| Thorn Grove | WR13 6SS |
| Upper Welland Road | WR14 4LD |
| Welland | WR13 6NB WR13 6NQ WR13 6NH WR13 6NJ |
| Welland Gardens | WR13 6LB |
| Woodside Lane | WR13 6NG |
| WR13 6AR WR13 6BJ WR13 6BX WR13 6BY WR13 6DA WR13 6JG WR13 6LT WR13 6LU WR13 6BZ WR13 6HZ WR13 6JS WR13 6JT WR13 6LS |
Transport near Morton
- FAQ
- Price Paid By Year
- Property Type Price
Frequently asked questions about Morton
What is the average price for a property for sale in Morton?
The average price for a property for sale in Morton is £463,734. This amount is 33% higher than the average price in Malvern. There are 299 property listings for sale in Morton.
What streets have the most expensive properties for sale in Morton?
The streets with the most expensive properties for sale in Morton are Upper Welland Road at an average of £885,000, Morton Green at an average of £834,166 and Garrett Bank at an average of £707,500.
What streets have the most affordable properties for sale in Morton?
The streets with the most affordable properties for sale in Morton are Chestnut Close at an average of £220,000, Blandford Close at an average of £290,000 and Gainsborough Close at an average of £295,000.
Which train stations are available in or near Morton?
Some of the train stations available in or near Morton are Colwall, Great Malvern and Ledbury.
Property Price Paid in Morton by Year
The average sold property price by year was:
| Year | Average Sold Price | Price Change |
Sold Properties
|
|---|---|---|---|
| 2025 | £394,469 | -26% |
18 Properties |
| 2024 | £496,185 | 4% |
31 Properties |
| 2023 | £475,775 | -14% |
20 Properties |
| 2022 | £541,921 | 24% |
33 Properties |
| 2021 | £414,146 | 1% |
29 Properties |
| 2020 | £408,542 | -4% |
26 Properties |
| 2019 | £422,955 | 12% |
34 Properties |
| 2018 | £371,447 | 1% |
43 Properties |
| 2017 | £368,384 | -16% |
53 Properties |
| 2016 | £429,008 | 30% |
33 Properties |
| 2015 | £299,250 | -8% |
20 Properties |
| 2014 | £324,565 | -13% |
22 Properties |
| 2013 | £367,532 | 6% |
14 Properties |
| 2012 | £346,027 | 19% |
9 Properties |
| 2011 | £281,220 | -31% |
12 Properties |
| 2010 | £368,409 | 17% |
22 Properties |
| 2009 | £307,357 | -18% |
14 Properties |
| 2008 | £364,037 | -46% |
16 Properties |
| 2007 | £530,708 | 35% |
12 Properties |
| 2006 | £344,172 | 27% |
29 Properties |
| 2005 | £250,044 | -15% |
28 Properties |
| 2004 | £287,896 | 7% |
26 Properties |
| 2003 | £267,812 | 13% |
16 Properties |
| 2002 | £231,691 | 3% |
31 Properties |
| 2001 | £223,740 | 42% |
25 Properties |
| 2000 | £130,700 | 12% |
16 Properties |
| 1999 | £114,584 | 8% |
35 Properties |
| 1998 | £104,996 | 6% |
14 Properties |
| 1997 | £99,063 | 5% |
26 Properties |
| 1996 | £94,076 | -29% |
19 Properties |
| 1995 | £120,968 | - |
24 Properties |
Property Price per Property Type in Morton
Here you can find historic sold price data in order to help with your property search.
The average Property Paid Price for specific property types in the last three years are:
| Property Type | Average Sold Price | Sold Properties |
|---|---|---|
| Semi Detached House | £323,083.00 | 24 Semi Detached Houses |
| Detached House | £546,231.00 | 42 Detached Houses |
| Terraced House | £434,000.00 | 3 Terraced Houses |

