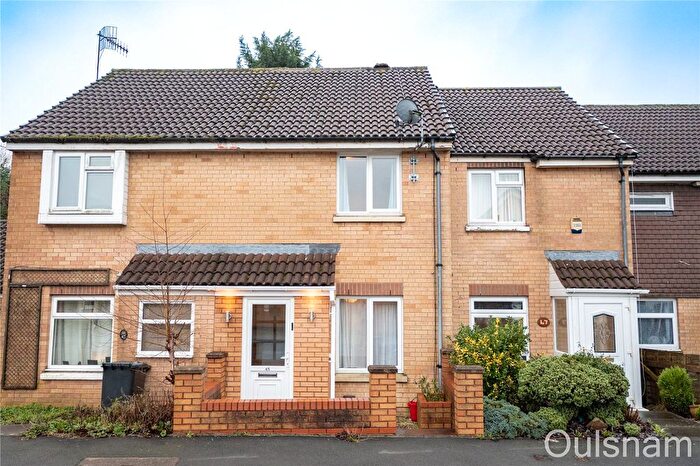
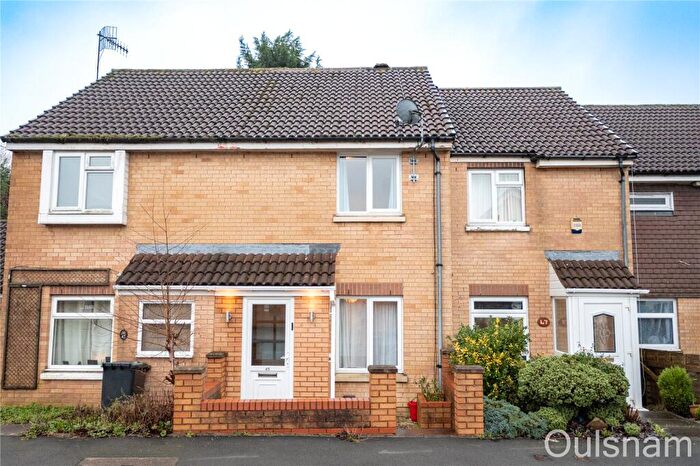
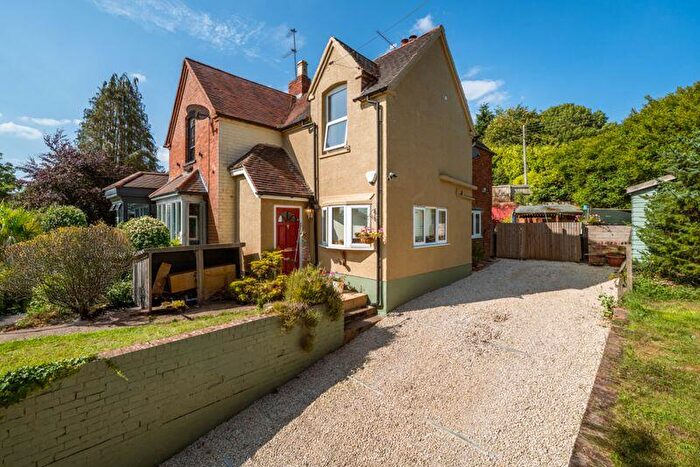
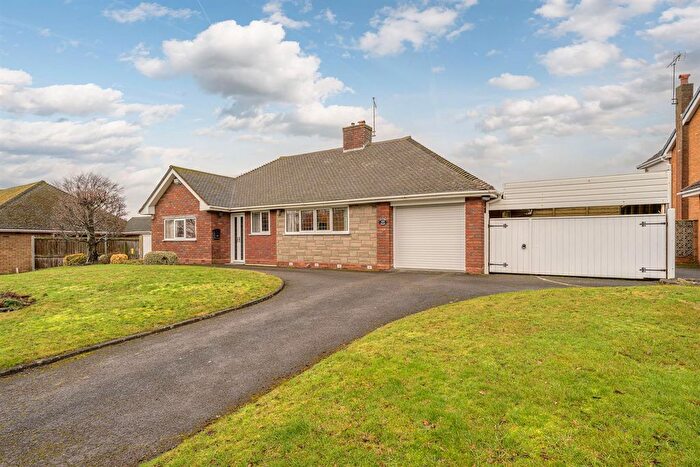
Houses for sale & to rent in Belbroughton & Romsley, Stourbridge
House Prices in Belbroughton & Romsley
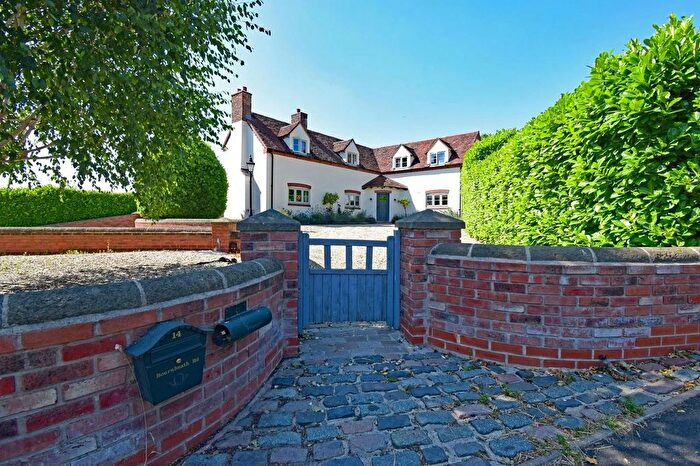
Properties in Belbroughton & Romsley have an average house price of £782,500.00 and had 2 Property Transactions within the last 3 years¹.
Belbroughton & Romsley is an area in Stourbridge, Worcestershire with 50 households², where the most expensive property was sold for £925,000.00.
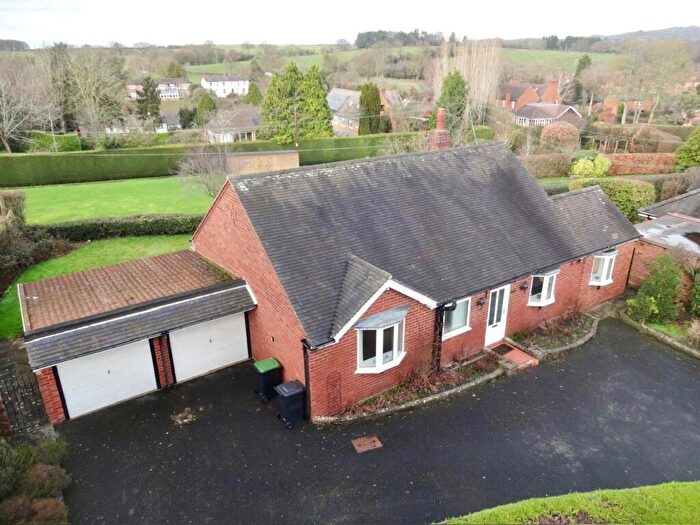
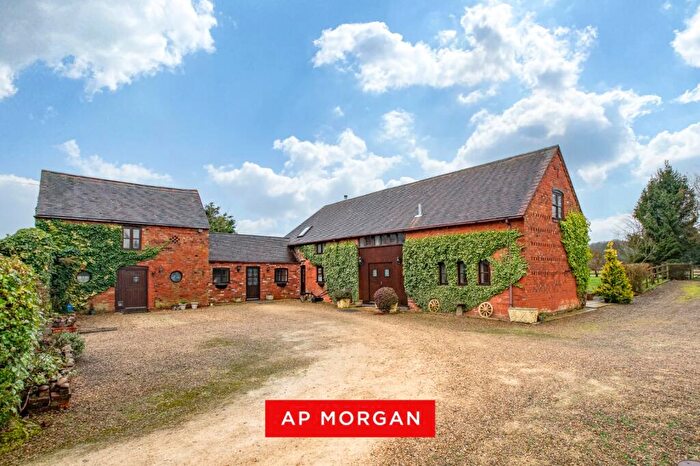
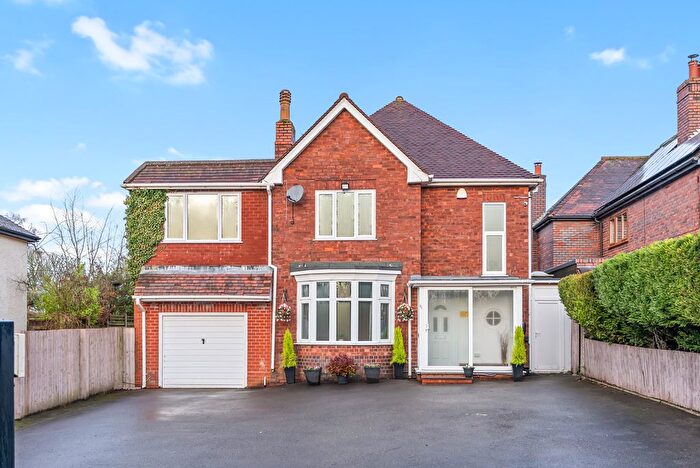
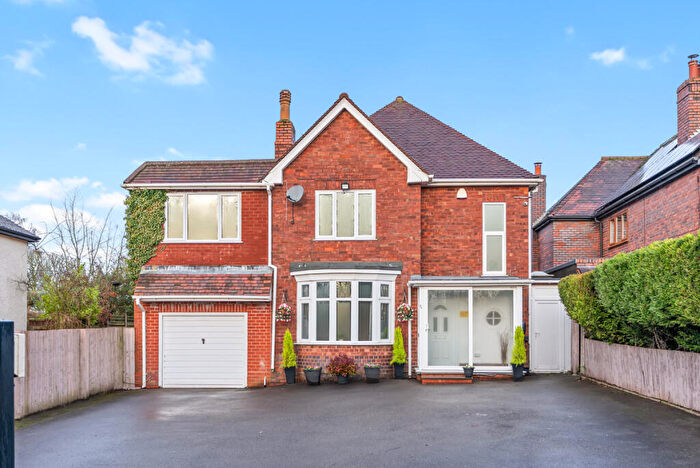
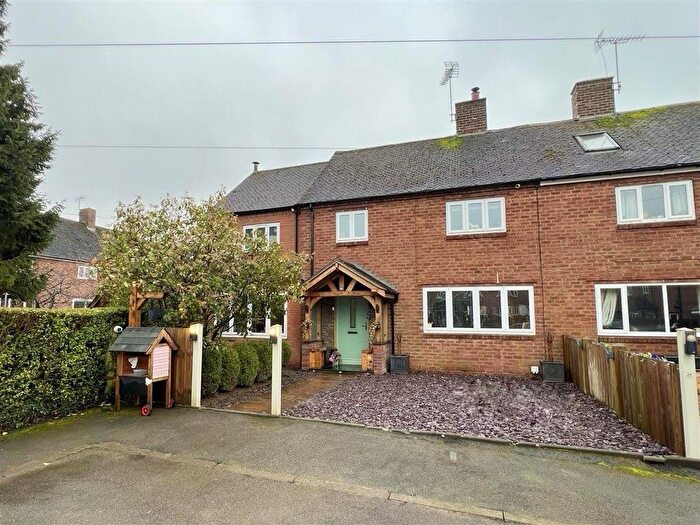
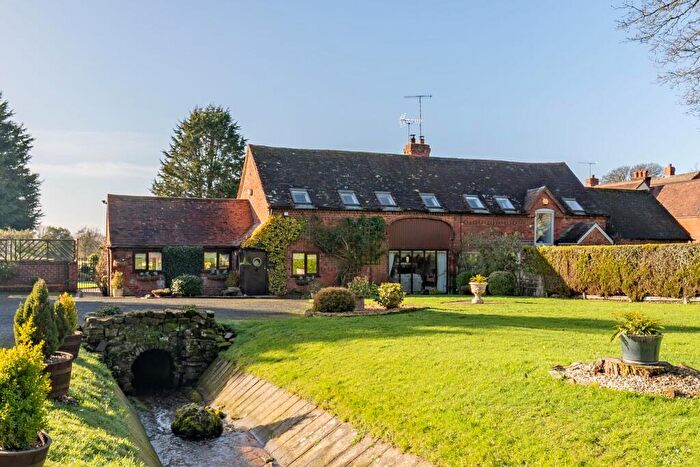
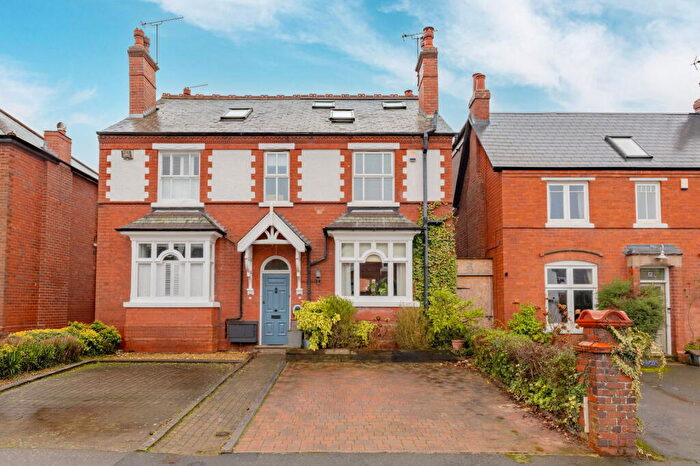
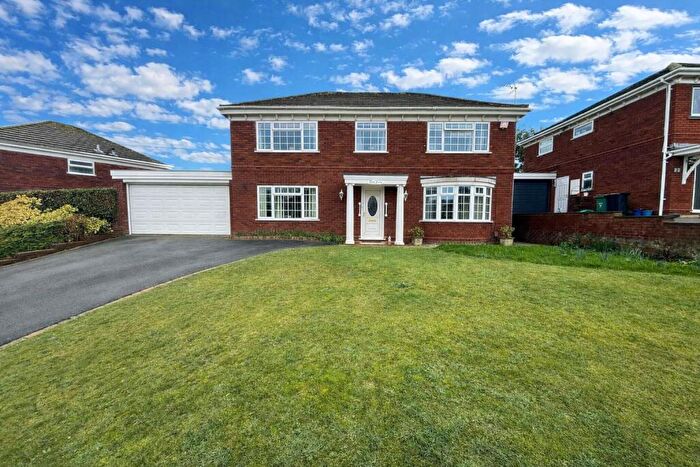
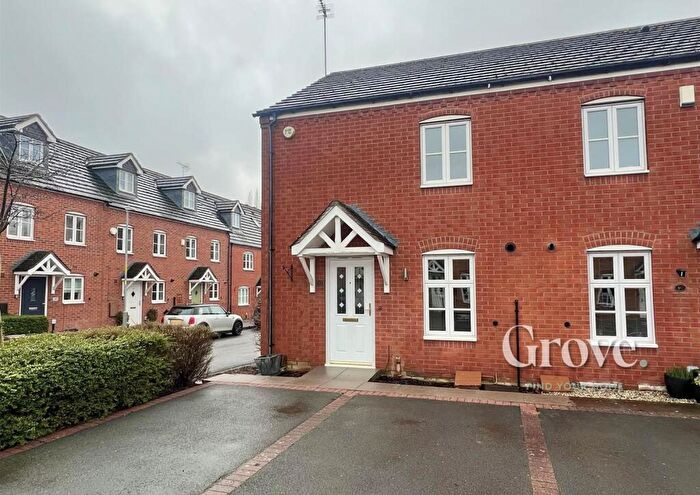
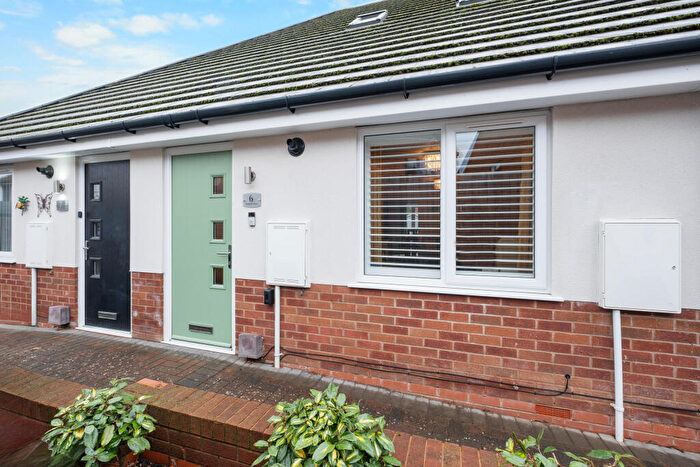
Properties for sale in Belbroughton & Romsley
Roads and Postcodes in Belbroughton & Romsley
Navigate through our locations to find the location of your next house in Belbroughton & Romsley, Stourbridge for sale or to rent.
| Streets | Postcodes |
|---|---|
| Bellamy Close | DY9 9AN |
| Bromsgrove Road | DY9 9QL DY9 9TX DY9 9UA DY9 9UG DY9 9XX |
| Broome Lane | DY9 0HH |
| Calcot Hill | DY9 9RX |
| Chadwich Lane | DY9 9UX |
| Church Avenue | DY9 9QS |
| Clent Grove | DY9 9PB |
| Dordale Road | DY9 0AZ |
| Forge Lane | DY9 9TD |
| Hackmans Gate Lane | DY9 0DW |
| Hartle Lane | DY9 9TP DY9 9TR |
| Hockley Brook Lane | DY9 0AA DY9 0AB DY9 0AD DY9 0AH |
| Horsall Lane | DY9 0HF |
| Moorhall | DY9 9RY |
| Mount Lane | DY9 9PQ |
| Nash Court | DY9 9TB |
| Nash Lane | DY9 9AF |
| Stourbridge Road | DY9 9XU |
| Thicknall Lane | DY9 0HJ |
| Walton Hill | DY9 9RU |
| Walton Pool | DY9 9RP |
| Warbage Lane | DY9 0AN DY9 0AR |
| Waystone Lane | DY9 0BG DY9 0BH |
| Woodcote Lane | DY9 0AU |
Transport near Belbroughton & Romsley
- FAQ
- Price Paid By Year
- Property Type Price
Frequently asked questions about Belbroughton & Romsley
What is the average price for a property for sale in Belbroughton & Romsley?
The average price for a property for sale in Belbroughton & Romsley is £782,500. This amount is 51% higher than the average price in Stourbridge. There are 1,728 property listings for sale in Belbroughton & Romsley.
What streets have the most expensive properties for sale in Belbroughton & Romsley?
The street with the most expensive properties for sale in Belbroughton & Romsley is Warbage Lane at an average of £925,000.
What streets have the most affordable properties for sale in Belbroughton & Romsley?
The street with the most affordable properties for sale in Belbroughton & Romsley is Mount Lane at an average of £640,000.
Which train stations are available in or near Belbroughton & Romsley?
Some of the train stations available in or near Belbroughton & Romsley are Hagley, Blakedown and Stourbridge Junction.
Property Price Paid in Belbroughton & Romsley by Year
The average sold property price by year was:
| Year | Average Sold Price | Price Change |
Sold Properties
|
|---|---|---|---|
| 2025 | £640,000 | -45% |
1 Property |
| 2024 | £925,000 | 35% |
1 Property |
| 2022 | £605,833 | -52% |
3 Properties |
| 2021 | £920,000 | 35% |
1 Property |
| 2020 | £601,375 | 26% |
4 Properties |
| 2019 | £447,500 | 27% |
2 Properties |
| 2018 | £326,833 | -21% |
3 Properties |
| 2017 | £396,666 | -1% |
3 Properties |
| 2016 | £400,000 | 25% |
7 Properties |
| 2015 | £299,062 | -20% |
8 Properties |
| 2014 | £360,000 | -47% |
1 Property |
| 2000 | £530,000 | - |
1 Property |
Property Price per Property Type in Belbroughton & Romsley
Here you can find historic sold price data in order to help with your property search.
The average Property Paid Price for specific property types in the last three years are:
| Property Type | Average Sold Price | Sold Properties |
|---|---|---|
| Detached House | £782,500.00 | 2 Detached Houses |

