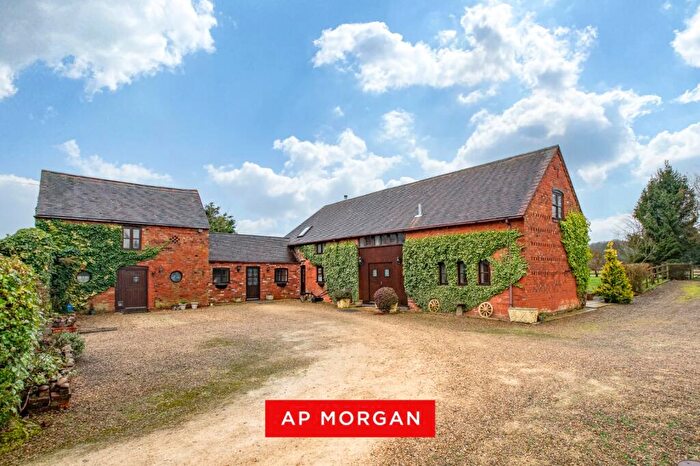
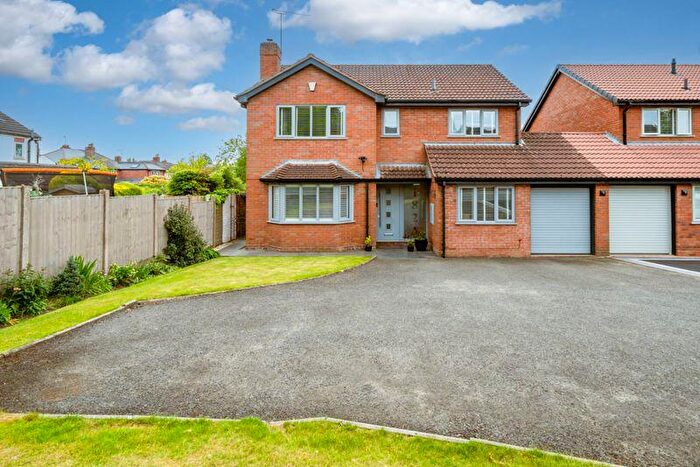
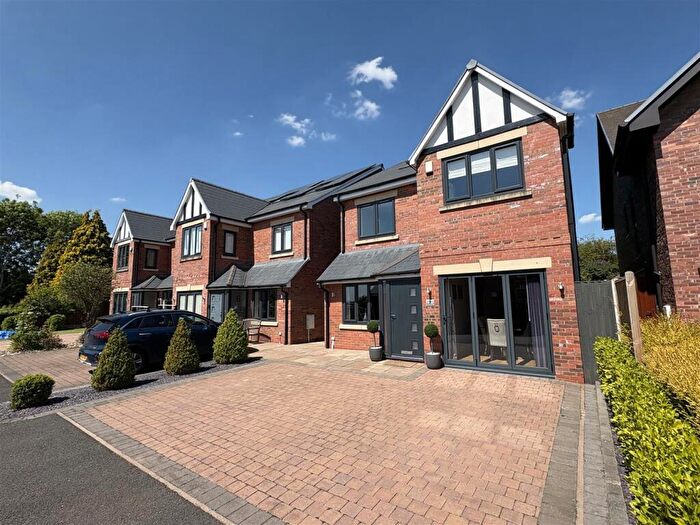
Houses for sale & to rent in Furlongs, Stourbridge
House Prices in Furlongs
Properties in Furlongs have an average house price of £570,840.00 and had 132 Property Transactions within the last 3 years¹.
Furlongs is an area in Stourbridge, Worcestershire with 1,604 households², where the most expensive property was sold for £2,000,000.00.
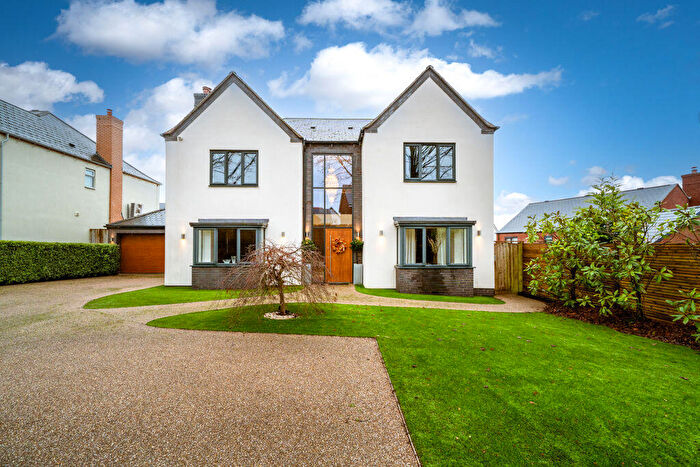
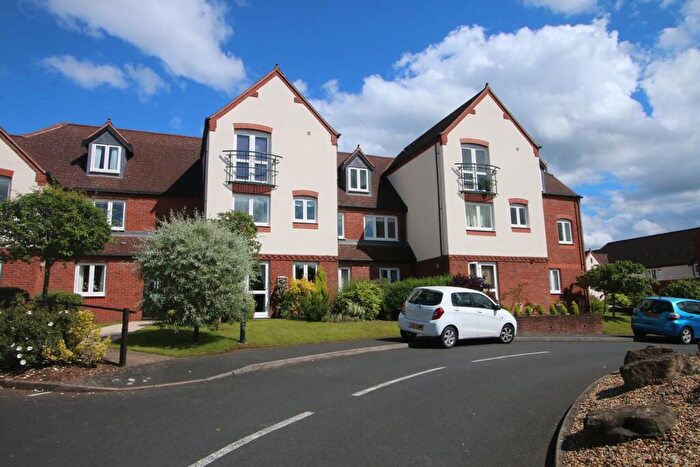
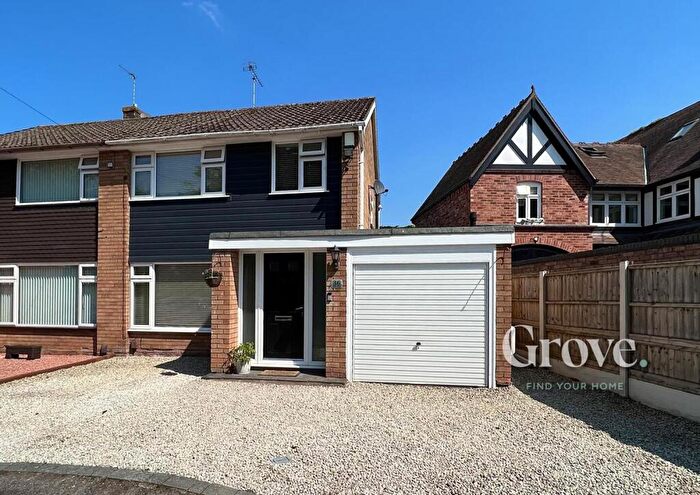
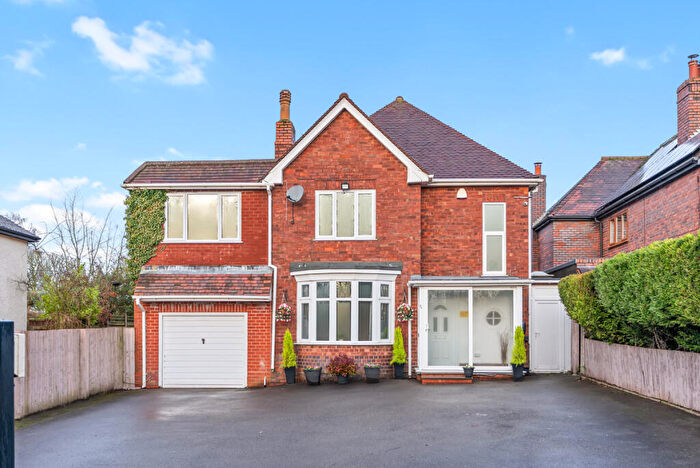
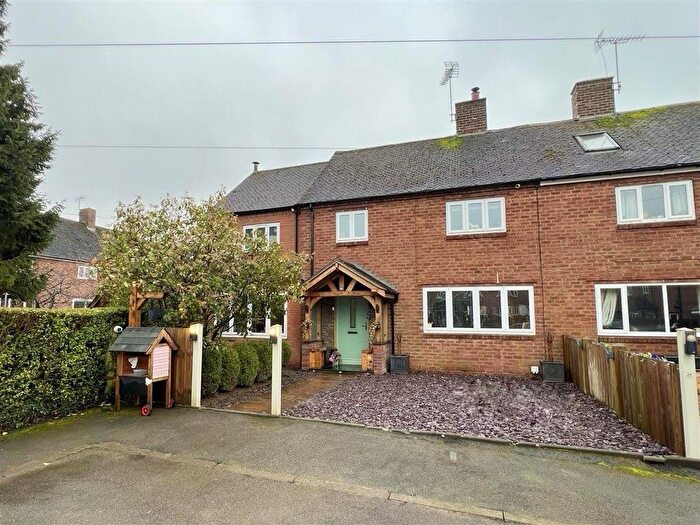
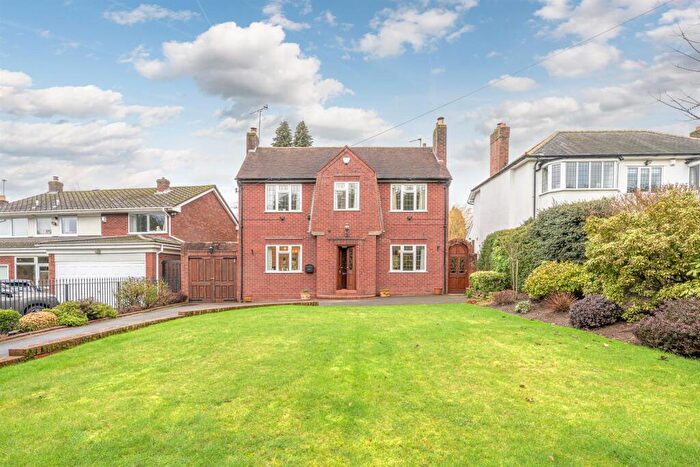
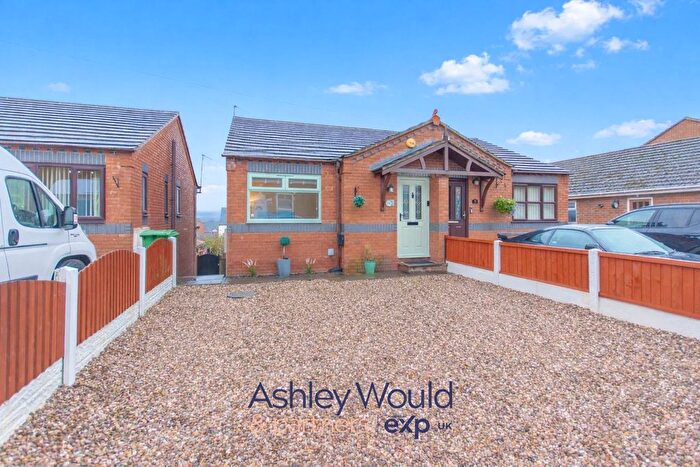
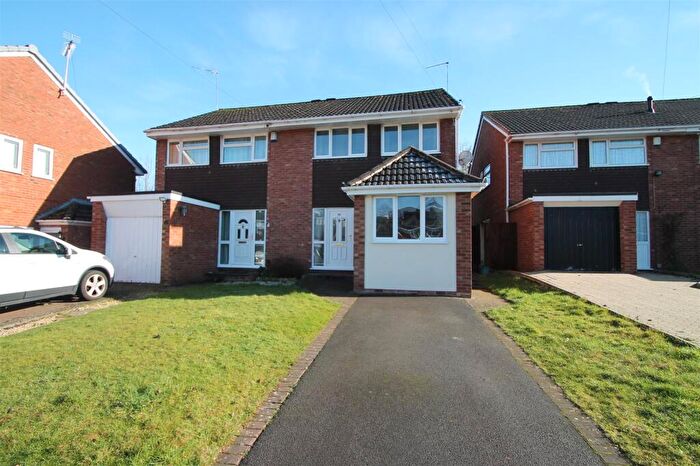
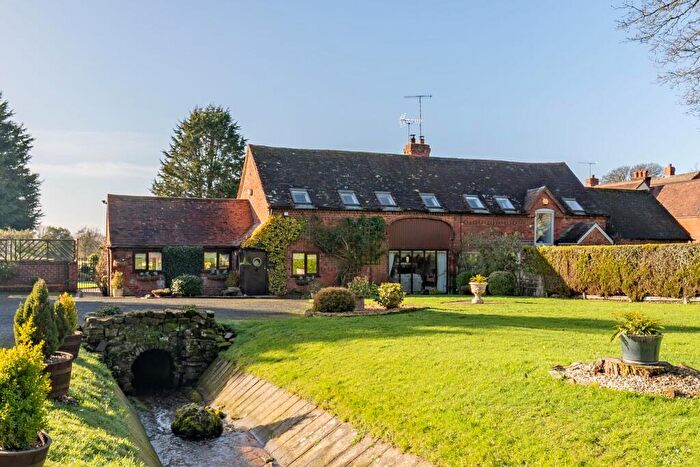
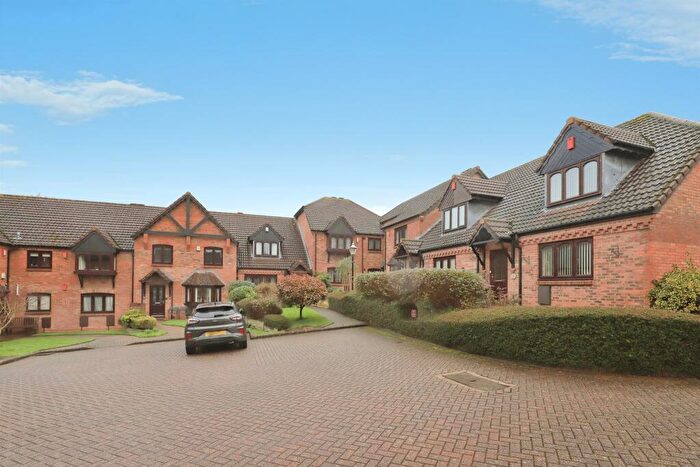
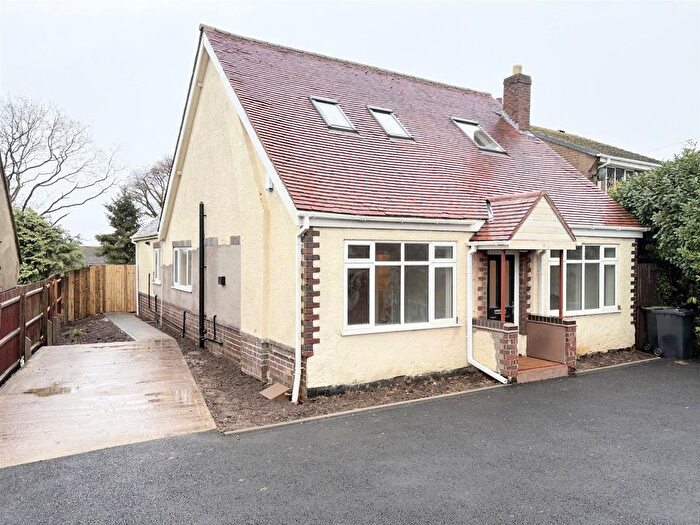
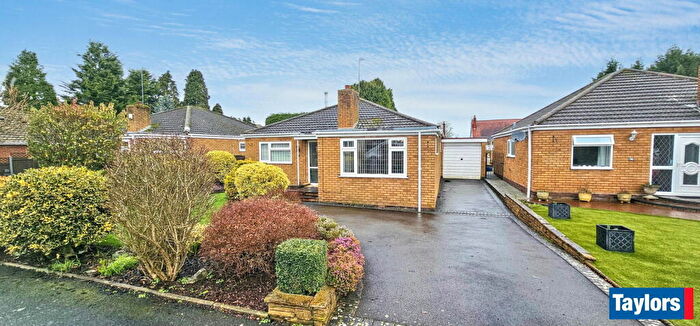
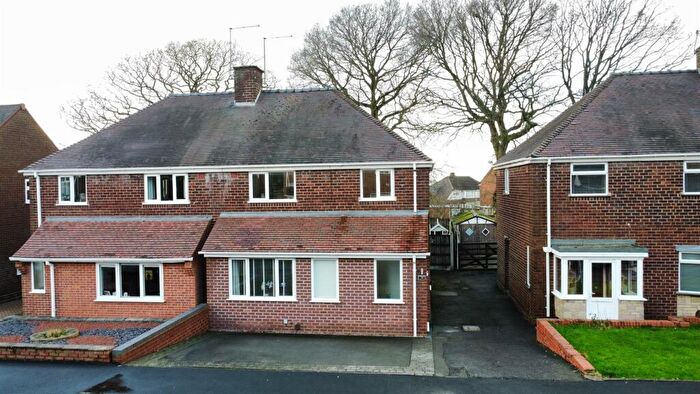
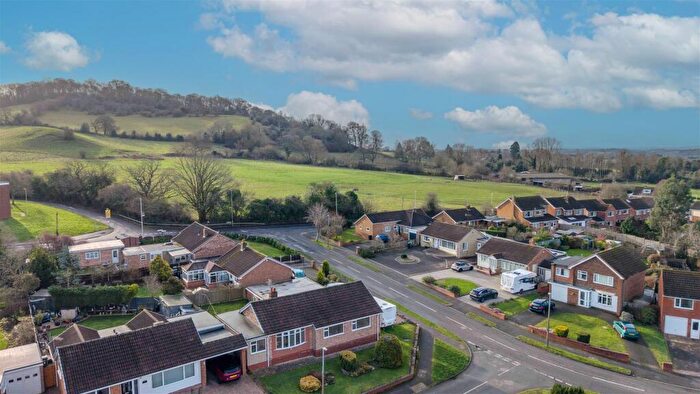
Properties for sale in Furlongs
Roads and Postcodes in Furlongs
Navigate through our locations to find the location of your next house in Furlongs, Stourbridge for sale or to rent.
| Streets | Postcodes |
|---|---|
| Adams Hill | DY9 9PS |
| Beeches Mews | DY9 0BE |
| Belbroughton Road | DY9 9RA DY9 9RB DY9 9RD |
| Bonfire Hill | DY9 9XD |
| Bradford Lane | DY9 0DP DY9 9TF |
| Broadwaters Drive | DY9 0JU |
| Bromsgrove Road | DY9 9PY DY9 9QA DY9 9QB DY9 9QD DY9 9QE DY9 9QF DY9 9QG DY9 9QP DY9 9RH DY9 9RJ DY9 9RL DY9 9TY DY9 9UE DY9 9UJ |
| Broom Hill | DY9 0BB |
| Chapel Lane | DY9 9XJ |
| Church Avenue | DY9 9PL DY9 9QT |
| Church Hill | DY9 0DT |
| Church Road | DY9 9TE |
| Clatterbach Lane | DY9 9PG |
| Cross Keys Mews | DY9 0LG |
| Dark Lane | DY9 9SS DY9 9TT |
| Dordale Road | DY9 0AX DY9 0BA |
| Drayton Road | DY9 0DX |
| Field Lane | DY9 0JA |
| Galtons Lane | DY9 9TS |
| Glebe Fields | DY9 9TA |
| Gorse Green Lane | DY9 9UH DY9 9UN DY9 9UP |
| Hackmans Gate Lane | DY9 0DL |
| Hartle Lane | DY9 9TG DY9 9TJ DY9 9TN DY9 9UL |
| Heath End Road | DY9 9XG DY9 9XH |
| High Street | DY9 9ST DY9 9SU DY9 9SY |
| Hockley Brook Lane | DY9 0AE DY9 0AG |
| Holy Cross Green | DY9 0HG |
| Holy Cross Lane | DY9 9SH DY9 9SJ DY9 9SN DY9 9SP DY9 9SR DY9 9UB |
| Kidderminster Road South | DY9 0JB DY9 0JD DY9 0JH DY9 0JJ |
| Kings Meadow | DY9 9QN DY9 9QR |
| Little Bell Hall Cottages | DY9 0DN |
| Madeley Road | DY9 9XA |
| Meadowcroft | DY9 0LJ |
| Mearse Lane | DY9 9YD DY9 9YE DY9 9YG |
| Mill Pool Close | DY9 0JN |
| Mount Lane | DY9 9PR |
| Nash Lane | DY9 9SW |
| Newfield Place | DY9 0FB |
| Newfield Road | DY9 0HY DY9 0JP DY9 0JR |
| Newtown Lane | DY9 9UR |
| Odnall Lane | DY9 9PP DY9 9PU DY9 9PW |
| Orchard Close | DY9 0LE |
| Pearmain Garden | DY9 0AL |
| Pinchers Close | DY9 9SX |
| Pinewoods Avenue | DY9 0JF |
| Pinewoods Close | DY9 0JG |
| Pinewoods Court | DY9 0JQ |
| Pool Furlong | DY9 9RE |
| Quantry Lane | DY9 9UY |
| Queens Hill | DY9 0DU |
| Ryefield Close | DY9 0JS |
| South Gardens | DY9 0EA |
| South Road | DY9 0JT |
| St Kenelms Pass | DY9 9PE |
| St Leonards Square | DY9 9PN |
| Stakenbridge Lane | DY9 0JE |
| Summerfield Road | DY9 9AL DY9 9RG |
| The Glebe | DY9 9TH |
| The Gutter | DY9 9XB |
| Thicknall Lane | DY9 0HL DY9 0HP DY9 0HR DY9 0HW |
| Thicknall Rise | DY9 0LQ |
| Vine Lane | DY9 9PH |
| Violet Lane | DY9 9PT |
| Walton Farm Cottages | DY9 9RN |
| Walton Pool | DY9 9RR DY9 9RS |
| Walton Pool Lane | DY9 9PJ |
| Walton Rise | DY9 9RT |
| Waystone Lane | DY9 0AY DY9 0BD |
| Western Road | DY9 0HZ DY9 0JX DY9 0JY DY9 0LA DY9 0LB |
| Woodchester | DY9 0NF |
| Woodfield | DY9 9SZ |
| Woodfield Lane | DY9 9UT |
| Woodgate Way | DY9 9TL |
| Woodhouse Orchard | DY9 9TQ |
| Woodman Lane | DY9 9PX |
| Worcester Road | DY9 0HU DY9 0JW DY9 0LD |
| Yew Tree Avenue | DY9 9SL |
Transport near Furlongs
-
Hagley Station
-
Blakedown Station
-
Stourbridge Junction Station
-
Stourbridge Town Station
-
Lye Station
-
Cradley Heath Station
- FAQ
- Price Paid By Year
- Property Type Price
Frequently asked questions about Furlongs
What is the average price for a property for sale in Furlongs?
The average price for a property for sale in Furlongs is £570,840. This amount is 10% higher than the average price in Stourbridge. There are 2,244 property listings for sale in Furlongs.
What streets have the most expensive properties for sale in Furlongs?
The streets with the most expensive properties for sale in Furlongs are Dordale Road at an average of £2,000,000, Dark Lane at an average of £1,865,000 and St Leonards Square at an average of £1,600,000.
What streets have the most affordable properties for sale in Furlongs?
The streets with the most affordable properties for sale in Furlongs are Pinewoods Court at an average of £187,500, Glebe Fields at an average of £210,000 and Woodhouse Orchard at an average of £214,000.
Which train stations are available in or near Furlongs?
Some of the train stations available in or near Furlongs are Hagley, Blakedown and Stourbridge Junction.
Property Price Paid in Furlongs by Year
The average sold property price by year was:
| Year | Average Sold Price | Price Change |
Sold Properties
|
|---|---|---|---|
| 2025 | £635,120 | 23% |
49 Properties |
| 2024 | £487,492 | -24% |
51 Properties |
| 2023 | £605,250 | 20% |
32 Properties |
| 2022 | £485,952 | -3% |
61 Properties |
| 2021 | £498,432 | 13% |
80 Properties |
| 2020 | £431,793 | 3% |
51 Properties |
| 2019 | £418,643 | 2% |
67 Properties |
| 2018 | £411,730 | 12% |
90 Properties |
| 2017 | £363,460 | -0,2% |
60 Properties |
| 2016 | £364,119 | -2% |
80 Properties |
| 2015 | £373,196 | 0,5% |
66 Properties |
| 2014 | £371,410 | 15% |
80 Properties |
| 2013 | £314,585 | -10% |
58 Properties |
| 2012 | £344,735 | 4% |
48 Properties |
| 2011 | £331,961 | -26% |
42 Properties |
| 2010 | £417,867 | 31% |
67 Properties |
| 2009 | £287,592 | -38% |
49 Properties |
| 2008 | £397,781 | 13% |
37 Properties |
| 2007 | £347,081 | 8% |
84 Properties |
| 2006 | £319,550 | -12% |
76 Properties |
| 2005 | £359,386 | 9% |
64 Properties |
| 2004 | £327,164 | 28% |
75 Properties |
| 2003 | £234,375 | 14% |
98 Properties |
| 2002 | £201,658 | 5% |
87 Properties |
| 2001 | £190,924 | 5% |
91 Properties |
| 2000 | £181,630 | 7% |
75 Properties |
| 1999 | £169,749 | 30% |
86 Properties |
| 1998 | £118,879 | -3% |
72 Properties |
| 1997 | £122,386 | -4% |
78 Properties |
| 1996 | £127,775 | 22% |
70 Properties |
| 1995 | £99,436 | - |
60 Properties |
Property Price per Property Type in Furlongs
Here you can find historic sold price data in order to help with your property search.
The average Property Paid Price for specific property types in the last three years are:
| Property Type | Average Sold Price | Sold Properties |
|---|---|---|
| Semi Detached House | £445,605.00 | 34 Semi Detached Houses |
| Detached House | £782,865.00 | 64 Detached Houses |
| Terraced House | £366,631.00 | 19 Terraced Houses |
| Flat | £208,733.00 | 15 Flats |

