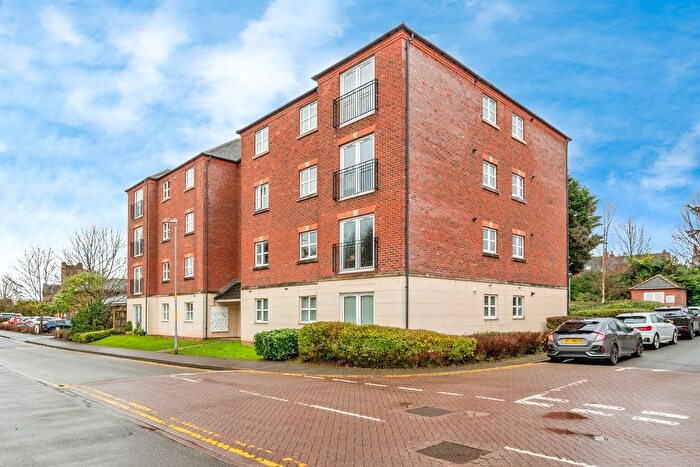
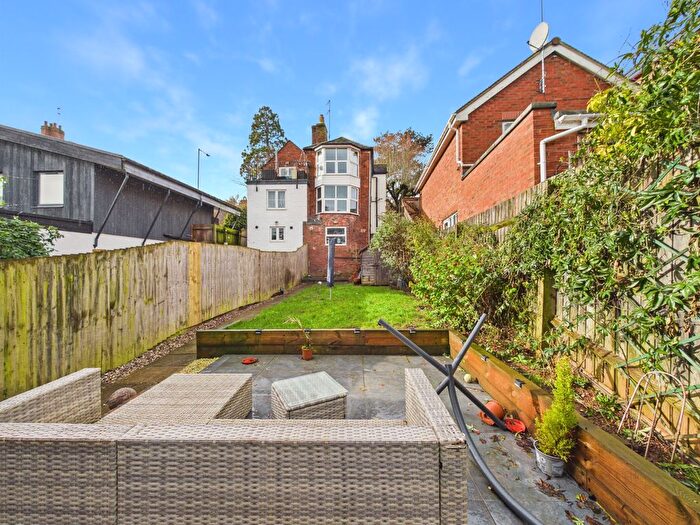
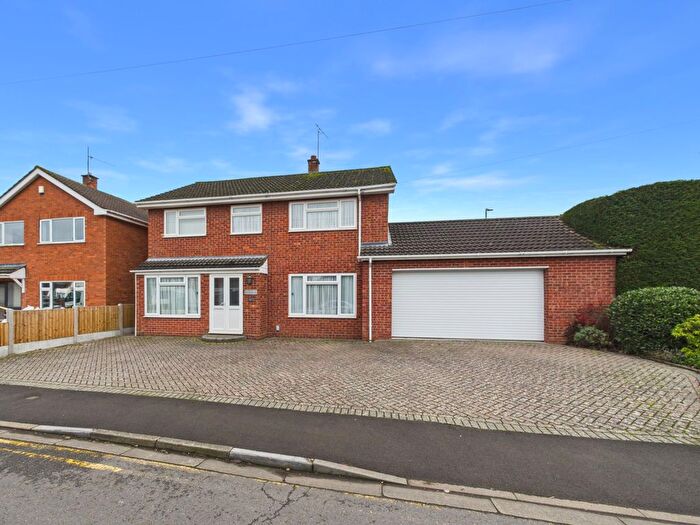
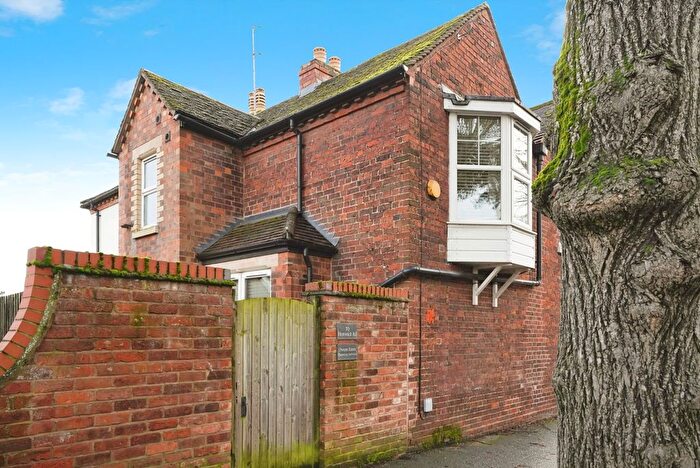
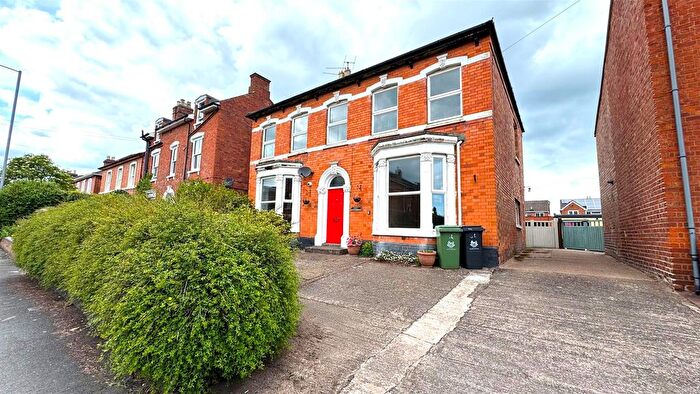
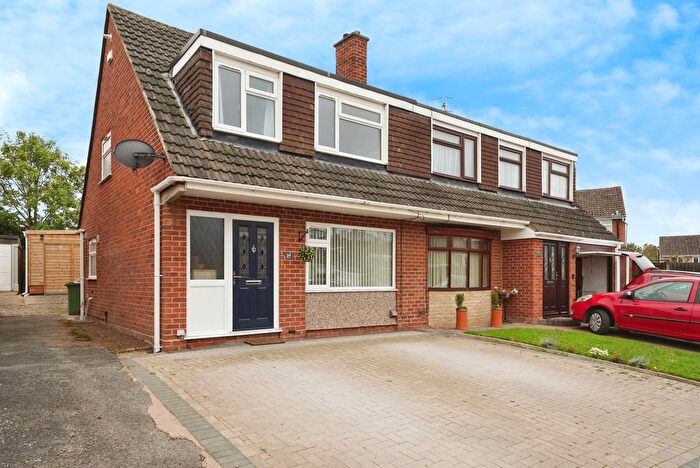
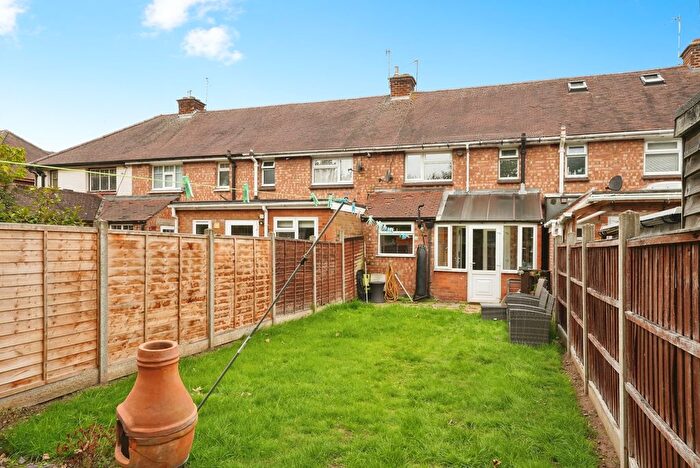
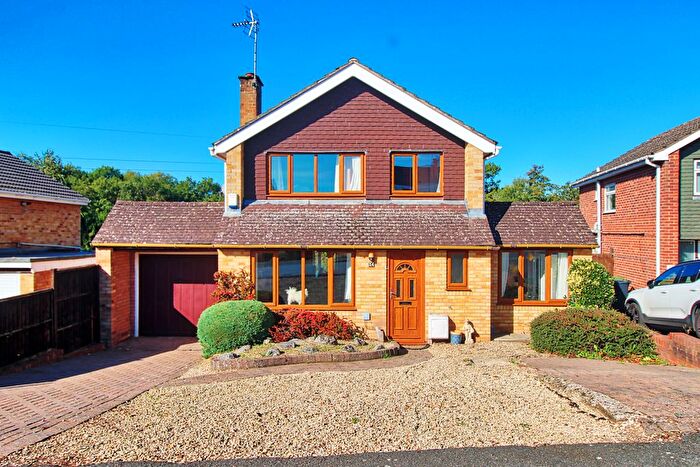
Houses for sale & to rent in St Clement, Worcester
House Prices in St Clement
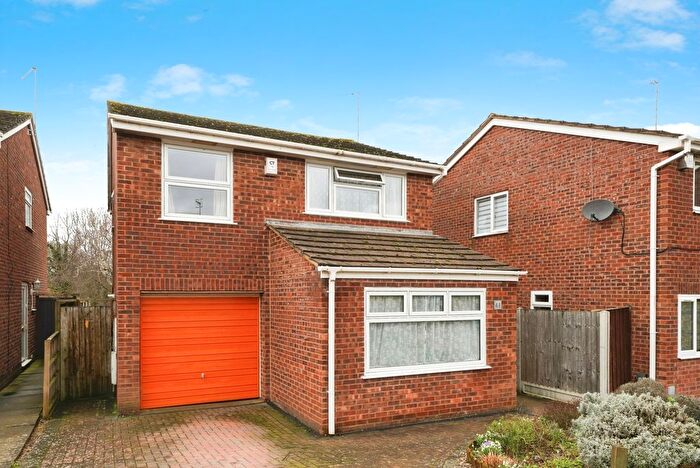
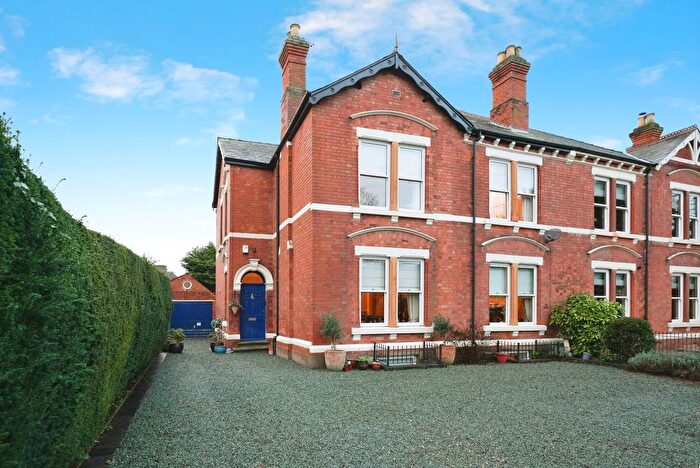
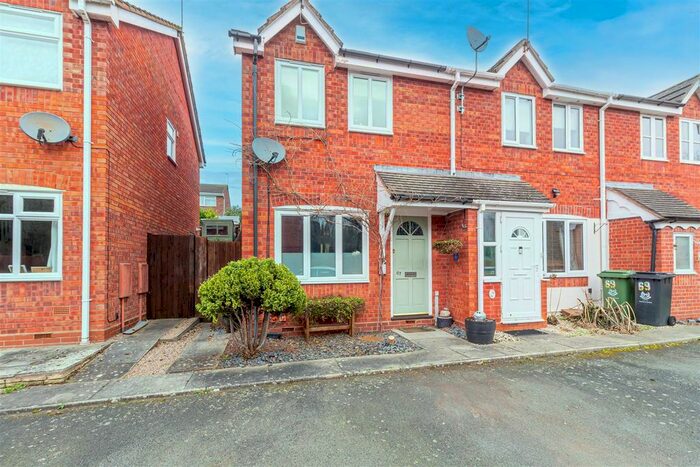
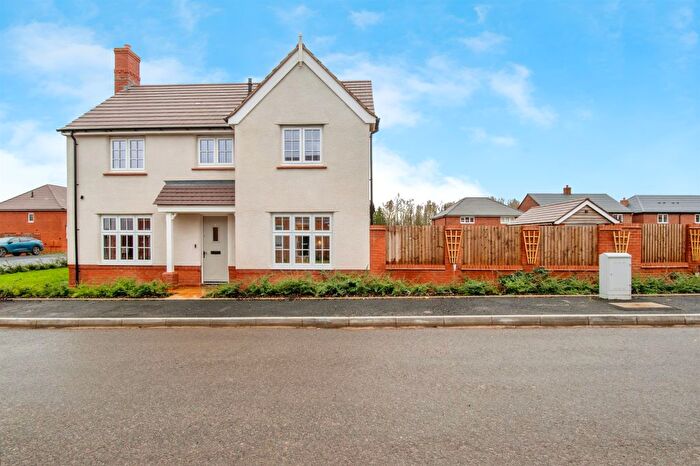
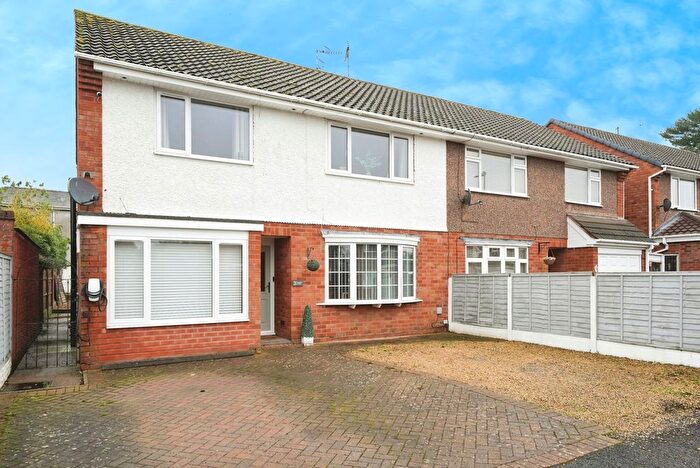
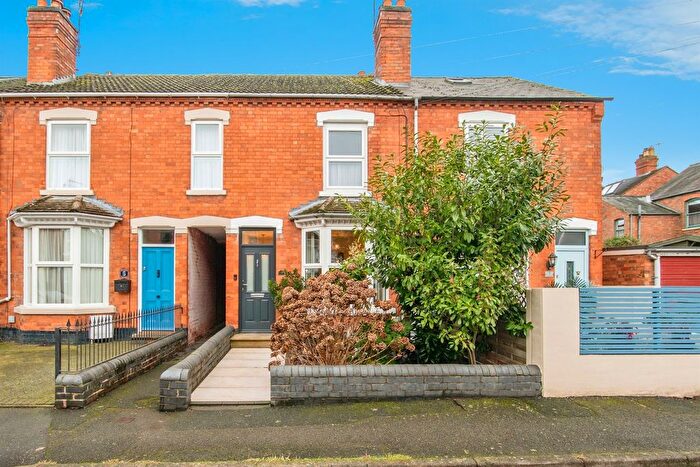
Properties in St Clement have an average house price of £290,938.00 and had 182 Property Transactions within the last 3 years¹.
St Clement is an area in Worcester, Worcestershire with 2,092 households², where the most expensive property was sold for £755,000.00.
Properties for sale in St Clement
Previously listed properties in St Clement
Roads and Postcodes in St Clement
Navigate through our locations to find the location of your next house in St Clement, Worcester for sale or to rent.
| Streets | Postcodes |
|---|---|
| Albert Terrace | WR2 6AP |
| Andrew Close | WR2 6JQ |
| Arrowsmith Avenue | WR2 5JA |
| Baveney Road | WR2 6DS |
| Beaconhill Drive | WR2 6DL WR2 6DR |
| Bracken Close | WR2 6HN |
| Bramley Avenue | WR2 6DG WR2 6DQ |
| Carriage Close | WR2 6AE |
| Cecilia Avenue | WR2 6EN |
| Comer Avenue | WR2 5HZ |
| Comer Gardens | WR2 6JA WR2 6JE WR2 6JG WR2 6JH |
| Croydon Villas | WR2 6AW |
| Dolphin Close | WR2 6BG |
| East Comer | WR2 6BE |
| Ellison Avenue | WR2 6EG |
| Elm Road | WR2 5JY |
| Everard Close | WR2 6ET |
| Farley Street | WR2 6JD |
| Fern Road | WR2 6HJ WR2 6HP WR2 6HR |
| Ferry Close | WR2 5PQ |
| Fitcher Close | WR2 6DP |
| Forest Close | WR2 6BW |
| Greenford Gardens | WR2 6HQ |
| Hallow Road | WR2 6BU WR2 6BX WR2 6BY WR2 6DD WR2 6DE WR2 6DF WR2 6DJ WR2 6DT |
| Hardwicke Close | WR2 5NX |
| Hawkwood Crescent | WR2 6BN WR2 6BP |
| Henwick Avenue | WR2 5JB |
| Henwick Green | WR2 5NN |
| Henwick Grove | WR2 6AJ WR2 6JP |
| Henwick Road | WR2 5NT WR2 5NY WR2 5PB WR2 5PD WR2 5PE WR2 5PF WR2 5PG WR2 5NS |
| Heronwood Close | WR2 6HT WR2 6HU |
| Himbleton Road | WR2 6BA WR2 6BB WR2 6BQ WR2 6HS |
| Holywell Hill | WR2 5NZ |
| Honeywood Road | WR2 6HW |
| Horsford Road | WR2 6BZ |
| Hylton Road | WR2 5LA WR2 5JN WR2 5JS WR2 5JX WR2 5WW |
| King Arthurs Close | WR2 6BD |
| King Stephens Mount | WR2 5PL |
| Lambourne Crescent | WR2 6ER |
| Langley Close | WR2 6EX |
| Laxton Avenue | WR2 6EJ WR2 6EQ |
| Lechmere Crescent | WR2 6ED WR2 6EE |
| Lodge Close | WR2 6JL |
| Martley Road | WR2 6HG WR2 6HH |
| Maund Street | WR2 6JF |
| Melrose Close | WR2 5JE |
| Monarch Drive | WR2 6EP WR2 6ES WR2 6EU WR2 6EW |
| Nuffield Close | WR2 6JN |
| Oldbury Road | WR2 6AA WR2 6AL WR2 6AN WR2 6AR |
| Ostler Drive | WR2 6AF |
| Packhorse Close | WR2 6AG |
| Pakington Road | WR2 6EF |
| Pearmain Close | WR2 6DH |
| Rectory Gardens | WR2 5NH |
| Ribston Close | WR2 6EH |
| Riverview Close | WR2 6DA WR2 6DB |
| Russet Close | WR2 6EL |
| Stallard Road | WR2 6BH |
| Tearne Street | WR2 6BJ WR2 6BL |
| The Mead | WR2 6JB |
| The Spinney | WR2 6HL |
| Tollhouse Drive | WR2 6AD |
| Turnpike Close | WR2 6AB |
| Wallcroft Close | WR2 6BS |
| Westbourne Close | WR2 5NU |
| Westhaven Place | WR2 6EY |
| Wheeler Close | WR2 5PH |
| Winterburn Road | WR2 6DW |
Transport near St Clement
-
Worcester Foregate Street Station
-
Worcester Shrub Hill Station
-
Droitwich Spa Station
-
Malvern Link Station
-
Great Malvern Station
-
Pershore Station
-
Hartlebury Station
-
Colwall Station
- FAQ
- Price Paid By Year
- Property Type Price
Frequently asked questions about St Clement
What is the average price for a property for sale in St Clement?
The average price for a property for sale in St Clement is £290,938. This amount is 6% lower than the average price in Worcester. There are 231 property listings for sale in St Clement.
What streets have the most expensive properties for sale in St Clement?
The streets with the most expensive properties for sale in St Clement are Winterburn Road at an average of £493,800, Carriage Close at an average of £485,000 and Packhorse Close at an average of £425,000.
What streets have the most affordable properties for sale in St Clement?
The streets with the most affordable properties for sale in St Clement are Croydon Villas at an average of £165,000, Farley Street at an average of £185,000 and Comer Avenue at an average of £188,166.
Which train stations are available in or near St Clement?
Some of the train stations available in or near St Clement are Worcester Foregate Street, Worcester Shrub Hill and Droitwich Spa.
Property Price Paid in St Clement by Year
The average sold property price by year was:
| Year | Average Sold Price | Price Change |
Sold Properties
|
|---|---|---|---|
| 2025 | £291,771 | -0,1% |
50 Properties |
| 2024 | £291,977 | 1% |
66 Properties |
| 2023 | £289,268 | -2% |
66 Properties |
| 2022 | £296,257 | 11% |
98 Properties |
| 2021 | £263,567 | 7% |
93 Properties |
| 2020 | £245,121 | 8% |
59 Properties |
| 2019 | £225,479 | -5% |
83 Properties |
| 2018 | £236,610 | 7% |
66 Properties |
| 2017 | £220,621 | 8% |
71 Properties |
| 2016 | £203,537 | 0,1% |
86 Properties |
| 2015 | £203,426 | -2% |
93 Properties |
| 2014 | £208,000 | 10% |
89 Properties |
| 2013 | £187,814 | 4% |
68 Properties |
| 2012 | £179,860 | -3% |
59 Properties |
| 2011 | £186,081 | -2% |
72 Properties |
| 2010 | £189,945 | 8% |
63 Properties |
| 2009 | £174,244 | -18% |
43 Properties |
| 2008 | £204,874 | 4% |
77 Properties |
| 2007 | £196,953 | 5% |
104 Properties |
| 2006 | £186,929 | -0,3% |
142 Properties |
| 2005 | £187,504 | 14% |
81 Properties |
| 2004 | £161,296 | 6% |
92 Properties |
| 2003 | £151,278 | 17% |
89 Properties |
| 2002 | £125,921 | 24% |
122 Properties |
| 2001 | £96,124 | 6% |
111 Properties |
| 2000 | £90,740 | 8% |
95 Properties |
| 1999 | £83,069 | 8% |
105 Properties |
| 1998 | £76,360 | 3% |
104 Properties |
| 1997 | £74,351 | 14% |
105 Properties |
| 1996 | £63,829 | 1% |
100 Properties |
| 1995 | £62,986 | - |
97 Properties |
Property Price per Property Type in St Clement
Here you can find historic sold price data in order to help with your property search.
The average Property Paid Price for specific property types in the last three years are:
| Property Type | Average Sold Price | Sold Properties |
|---|---|---|
| Semi Detached House | £273,425.00 | 81 Semi Detached Houses |
| Detached House | £379,520.00 | 53 Detached Houses |
| Terraced House | £245,195.00 | 37 Terraced Houses |
| Flat | £146,954.00 | 11 Flats |

