
Houses for sale in Worcester, Worcestershire
House Prices in Worcester
Properties in Worcester have an average house price of £311k and had 6,152 Property Transactions within the last 3 years.¹
Worcester is an area in Worcestershire with 64,439 households², where the most expensive property was sold for £2.98M.
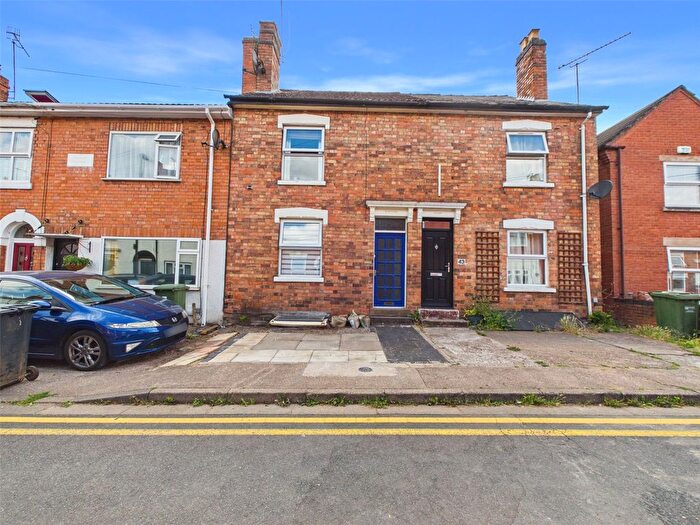
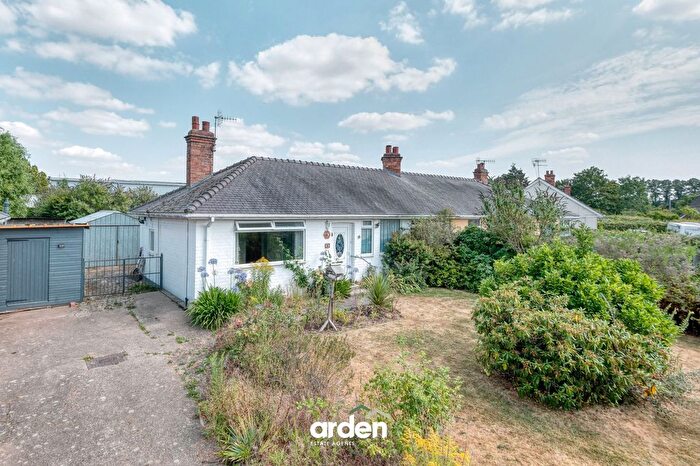
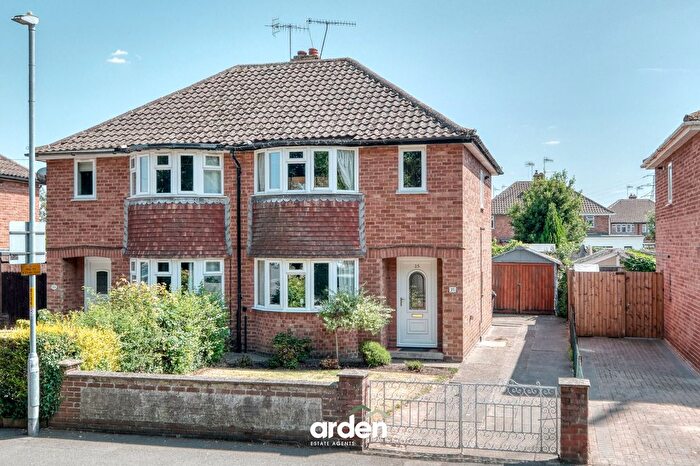
Properties for sale in Worcester
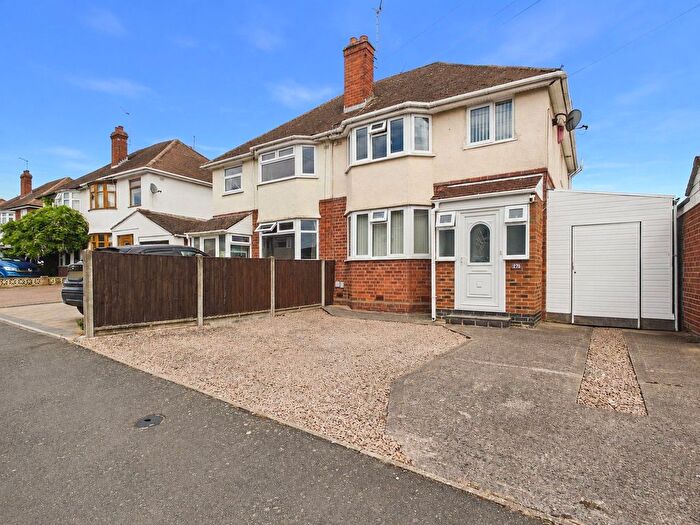
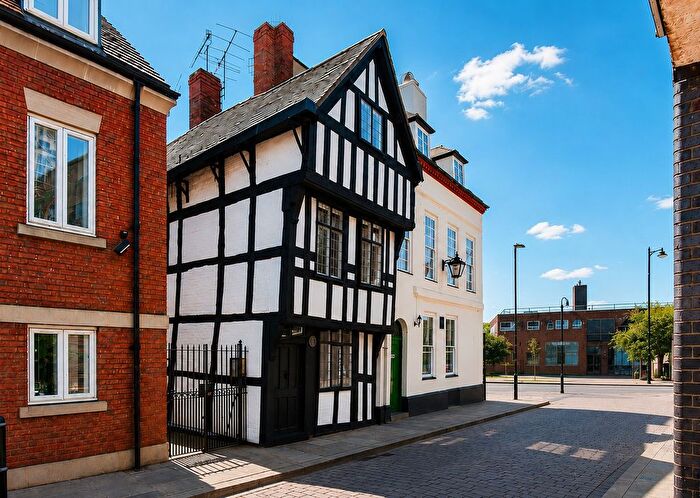
![]()
If you are looking to sell your house, let it out, or receive a property valuation, an expert can help you.
Click the button below to get started.
Neighbourhoods in Worcester
Navigate through our locations to find the location of your next house in Worcester, Worcestershire for sale or to rent.
- Rock
- Alfrick And Leigh
- Arboretum
- Baldwin
- Battenhall
- Bedwardine
- Bowbrook
- Broadheath
- Cathedral
- Claines
- Drakes Broughton
- Eckington
- Gorse Hill
- Hallow
- Inkberrow
- Kempsey
- Lindridge
- Longdon
- Lovett And North Claines
- Martley
- Morton
- Norton And Whittington
- Nunnery
- Ombersley
- Powick
- Rainbow Hill
- Ripple
- St Clement
- St John
- St Peters Parish
- St Stephen
- Teme Valley
- Upton And Hanley
- Upton Snodsbury
- Warndon
- Warndon Parish North
- Warndon Parish South
- Woodbury
- Bewdley & Rock
- Drakes Broughton, Norton & Whittington
- Upton & Ripple
- Powick & The Hanleys
- Alfrick, Leigh & Rushwick
- Hallow & Holt
- North Claines & Salwarpe
Property price trends in Worcester
According to the latest Land Registry data, the average home in Worcester sold for £298,888 in 2026. That figure comes from a substantial record of 81,963 sales logged over the past 31 years.
Prices have softened over the last three years. Compared with 2023, when the typical sale came in around £304,739, that's a fall of roughly 1.9%.
Looking back five years, average prices are up about 0.9% since 2021, a gain of around £2,780 in cash terms.
Zoom out to the past decade for the fuller picture. Back in 2016, homes here averaged £232,555, so the typical sold price has climbed about 28.5% since then, roughly 2.5% a year. Stretch the view to fifteen years and that annual pace holds at about 2.4%.
Frequently asked questions about Worcester
What is the average price for a property for sale in Worcester?
The average price for a property for sale in Worcester is £311,296. This amount is 4% lower than the average price in Worcestershire. There are more than 10,000 property listings for sale in Worcester.
What locations have the most expensive properties for sale in Worcester?
The locations with the most expensive properties for sale in Worcester are Bewdley & Rock at an average of £995,000, Ombersley at an average of £899,000 and Morton at an average of £643,333.
What locations have the most affordable properties for sale in Worcester?
The locations with the most affordable properties for sale in Worcester are Warndon at an average of £196,821, Gorse Hill at an average of £207,396 and Rainbow Hill at an average of £207,594.
Which train stations are available in or near Worcester?
Some of the train stations available in or near Worcester are Worcester Foregate Street, Worcester Shrub Hill and Droitwich Spa.
Property Price Paid in Worcester by Year
The average sold property price by year was:
| Year | Average Sold Price | Price Change |
Sold Properties
|
|---|---|---|---|
| 2026 | £298,888 | -6% |
132 Properties |
| 2025 | £317,831 | 2% |
2,033 Properties |
| 2024 | £311,670 | 2% |
2,091 Properties |
| 2023 | £304,739 | -1% |
1,896 Properties |
| 2022 | £308,158 | 4% |
2,387 Properties |
| 2021 | £296,108 | 8% |
2,976 Properties |
| 2020 | £273,805 | 3% |
2,085 Properties |
| 2019 | £266,247 | 4% |
2,589 Properties |
| 2018 | £255,330 | 3% |
2,685 Properties |
| 2017 | £246,549 | 6% |
2,785 Properties |
Property Price per Property Type in Worcester
Here you can find historic sold price data in order to help with your property search.
The average Property Paid Price for specific property types in the last three years are:
| Property Type | Average Sold Price | Sold Properties |
|---|---|---|
| Semi Detached House | £279,515.00 | 1,927 Semi Detached Houses |
| Terraced House | £244,374.00 | 1,563 Terraced Houses |
| Detached House | £463,802.00 | 1,883 Detached Houses |
| Flat | £155,545.00 | 779 Flats |
Transport in Worcester
Please see below transportation links in this area:
