
Houses for sale in Copmanthorpe, York
House Prices in Copmanthorpe
Properties in Copmanthorpe have an average house price of £259k and had 6 Property Transactions within the last 3 years¹.
Copmanthorpe is an area in York, York with 9 households², where the most expensive property was sold for £310k.
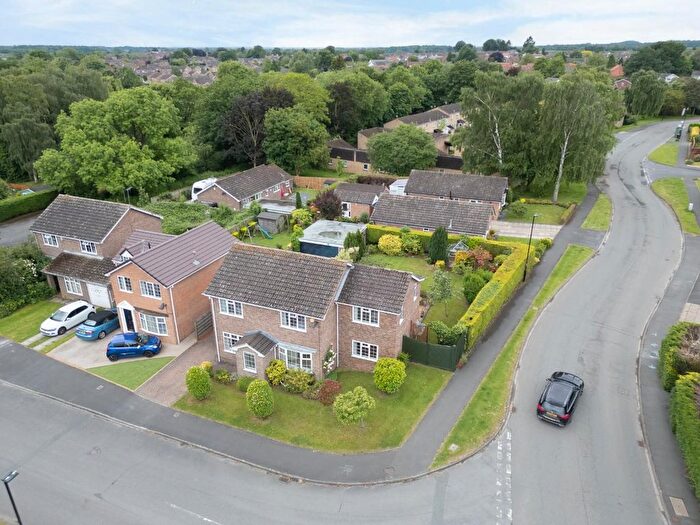
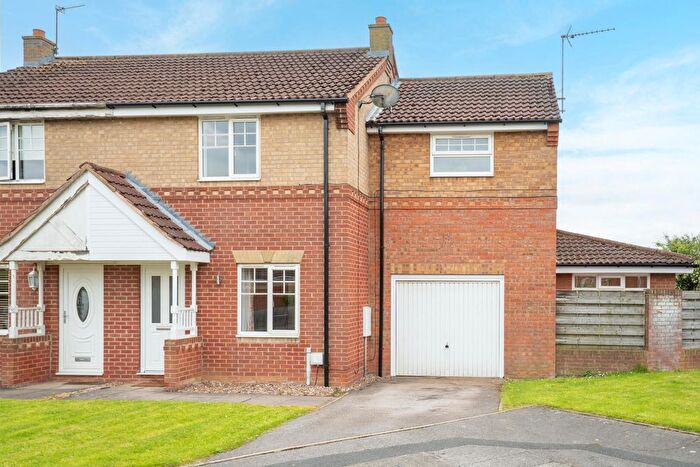
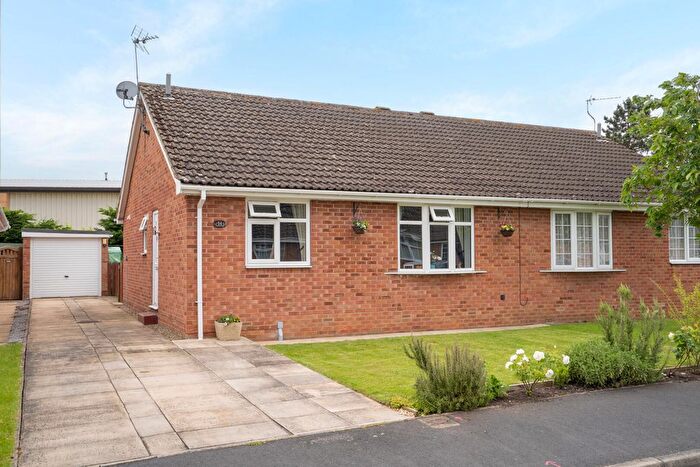
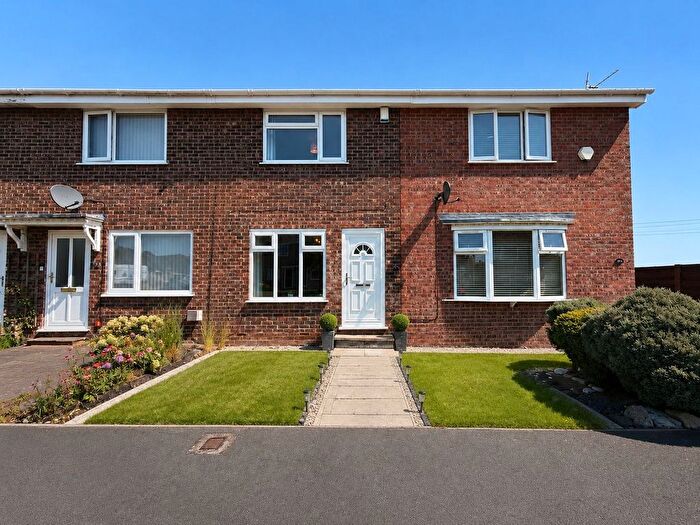
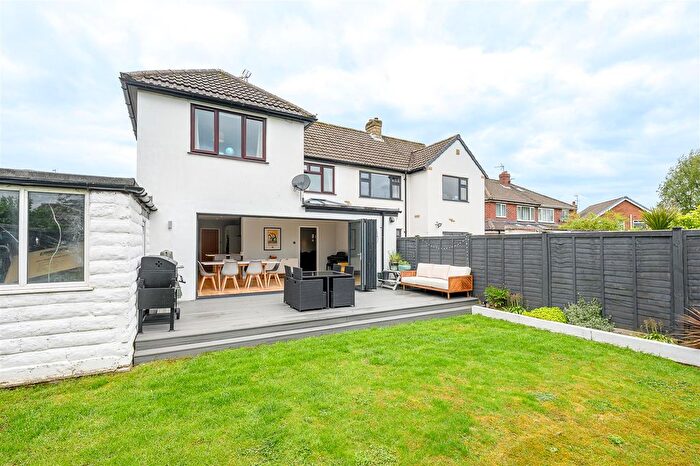
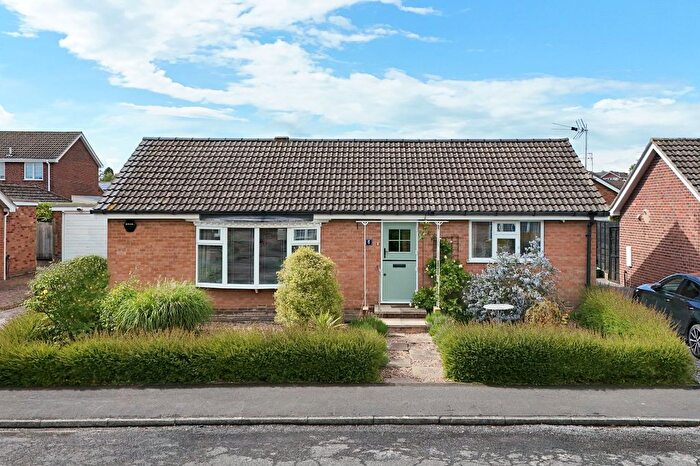
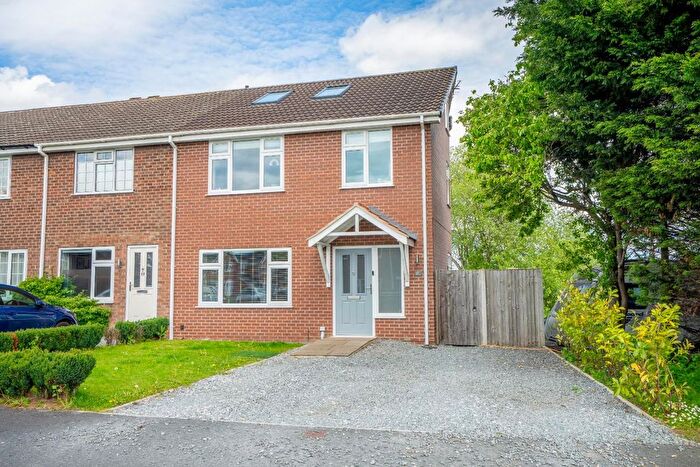
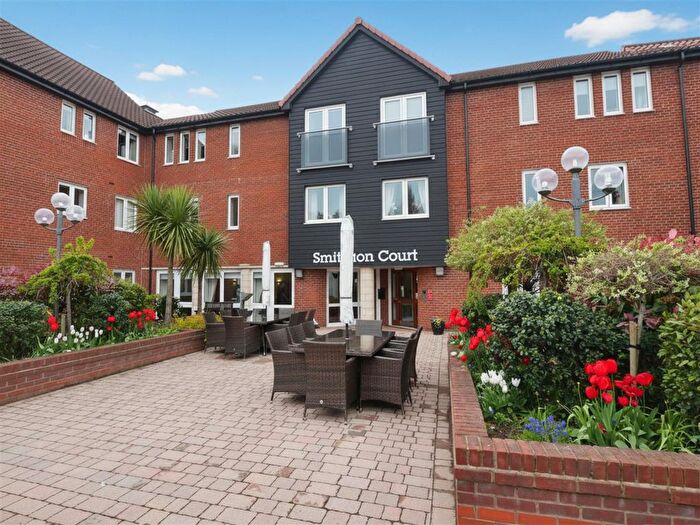
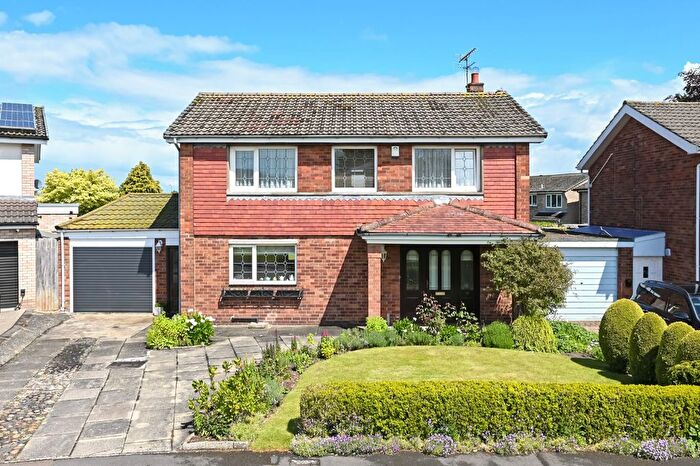
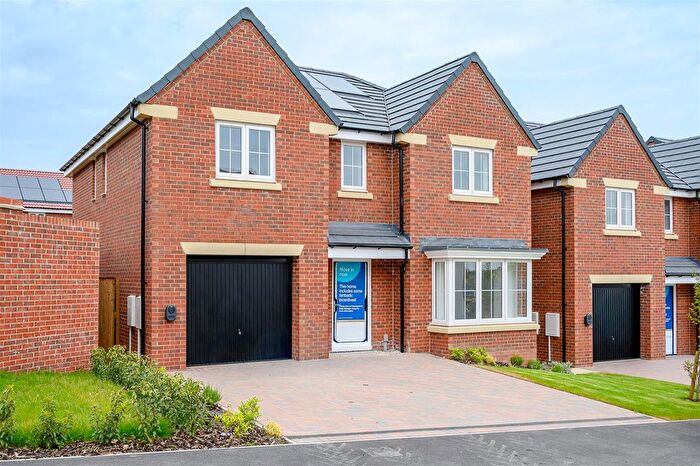
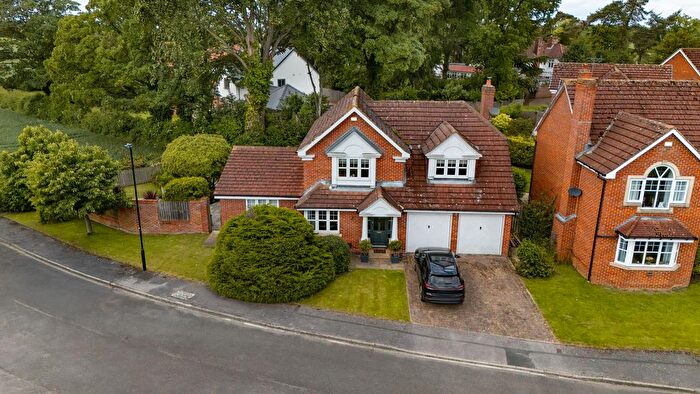
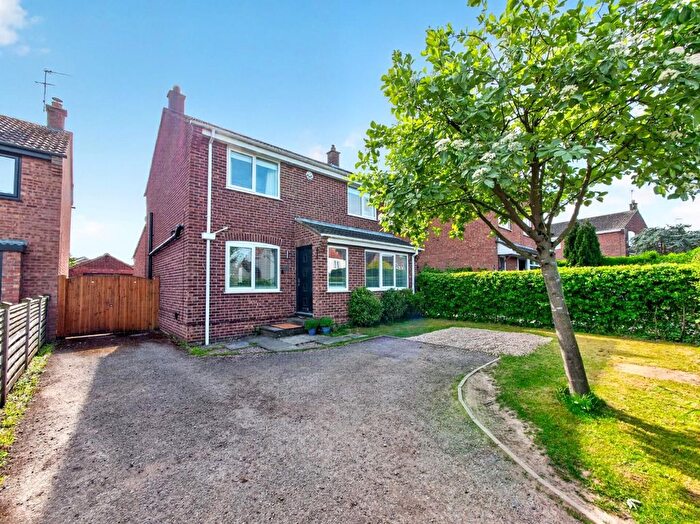
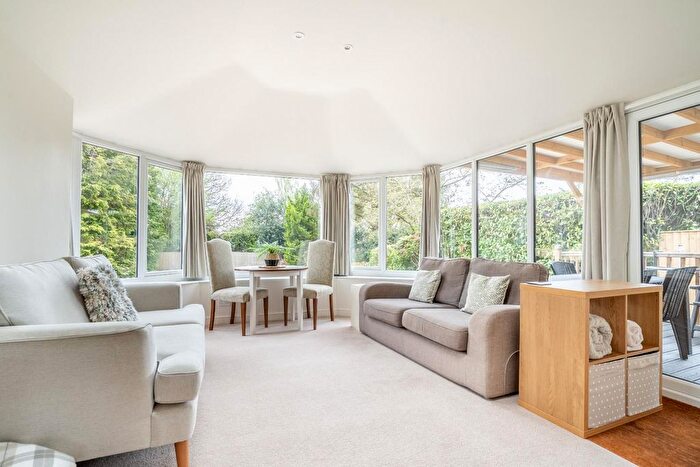
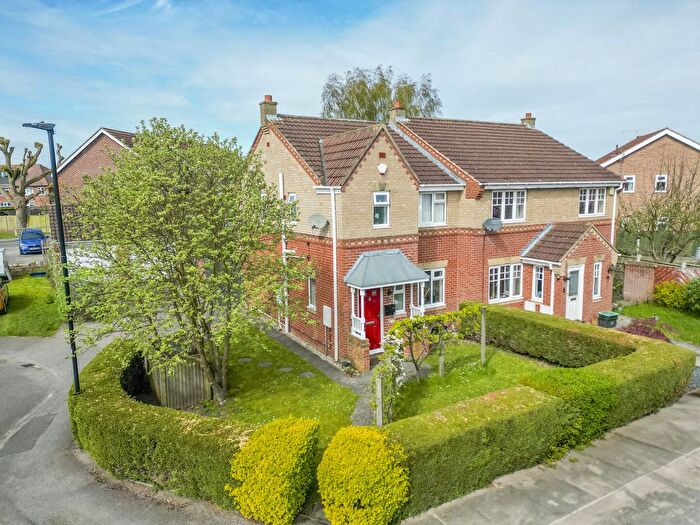
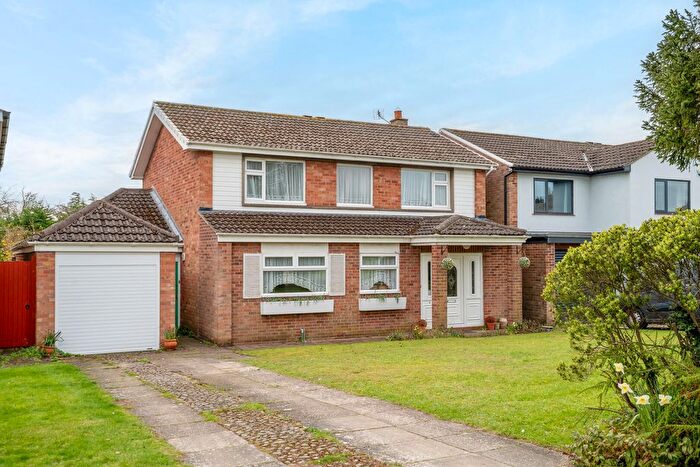
Properties for sale in Copmanthorpe
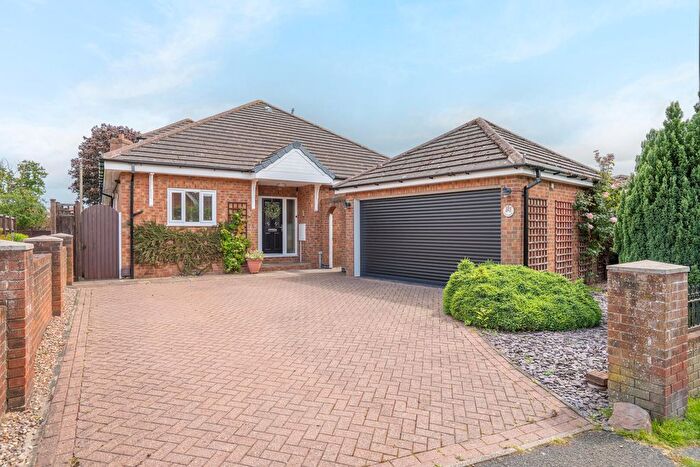
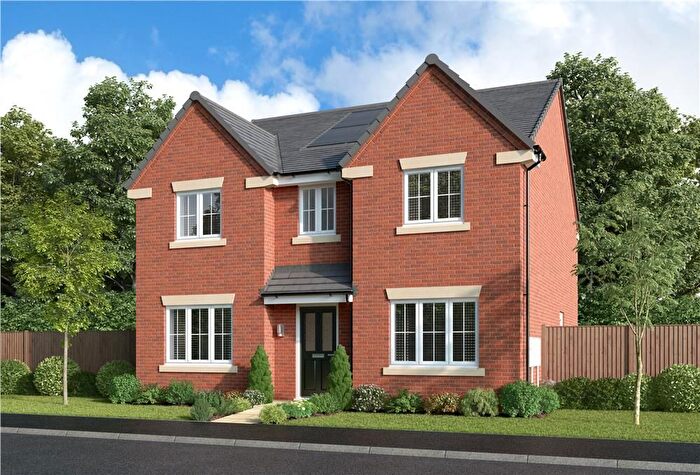
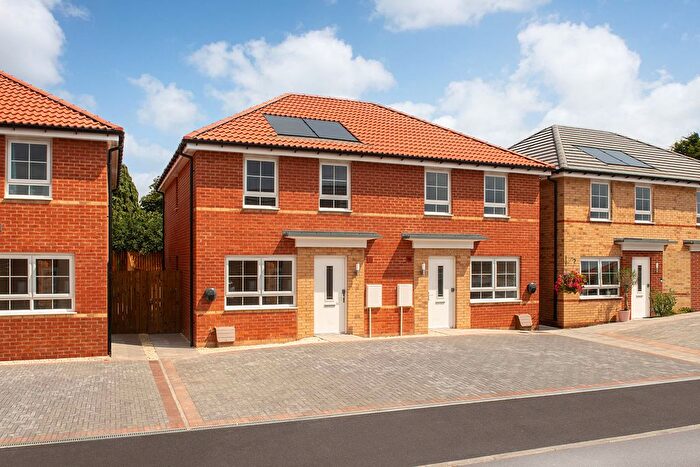
Previously listed properties in Copmanthorpe
![]()
If you are looking to sell your house, let it out, or receive a property valuation, an expert can help you.
Click the button below to get started.

Roads and Postcodes in Copmanthorpe
Navigate through our locations to find the location of your next house in Copmanthorpe, York for sale or to rent.
| Streets | Postcodes |
|---|---|
| Church Street | YO23 3SE |
| Moor Lane | YO23 3TL |
| Tadcaster Mews | YO23 3AB |
| Tadcaster Road | YO23 2UB |
| The Link | YO23 3UT |
| The Shopping Precinct | YO23 3GG |
| Top Lane | YO23 3AA |
| YO23 3RS |
Property price trends in Copmanthorpe
According to the latest Land Registry data, the average home in Copmanthorpe sold for £208,000 in 2026. That figure comes from 66 sales logged over the past 29 years.
Prices have fallen back over the last three years. Compared with 2023, when the typical sale came in around £259,333, that's a fall of roughly 19.8%.
Looking back five years, average prices are down about 61.1% since 2021, a drop of around £327,000 in cash terms.
Zoom out to the past decade for the fuller picture. Back in 2016, homes here averaged £293,222, so the typical sold price has fallen about 29.1% since then, around 3.4% a year lower.
Frequently asked questions about Copmanthorpe
What is the average price for a property for sale in Copmanthorpe?
The average price for a property for sale in Copmanthorpe is £259,333. This amount is 25% lower than the average price in York. There are 206 property listings for sale in Copmanthorpe.
Which train stations are available in or near Copmanthorpe?
Some of the train stations available in or near Copmanthorpe are York, Poppleton and Ulleskelf.
Property Price Paid in Copmanthorpe by Year
The average sold property price by year was:
| Year | Average Sold Price | Price Change |
Sold Properties
|
|---|---|---|---|
| 2026 | £208,000 | -37% |
1 Property |
| 2024 | £285,000 | 9% |
2 Properties |
| 2023 | £259,333 | -8% |
3 Properties |
| 2022 | £279,400 | -91% |
5 Properties |
| 2021 | £535,000 | -56% |
3 Properties |
| 2019 | £833,737 | 66% |
4 Properties |
| 2018 | £287,500 | 22% |
2 Properties |
| 2017 | £225,000 | -30% |
1 Property |
| 2016 | £293,222 | 20% |
9 Properties |
| 2015 | £234,003 | 82% |
35 Properties |
Property Price per Property Type in Copmanthorpe
Here you can find historic sold price data in order to help with your property search.
The average Property Paid Price for specific property types in the last three years are:
| Property Type | Average Sold Price | Sold Properties |
|---|---|---|
| Flat | £259,333.00 | 6 Flats |
