
Houses for sale in York, York
House Prices in York
Properties in York have an average house price of £346k and had 8,330 Property Transactions within the last 3 years.¹
York is an area in York with 85,629 households², where the most expensive property was sold for £5.1M.
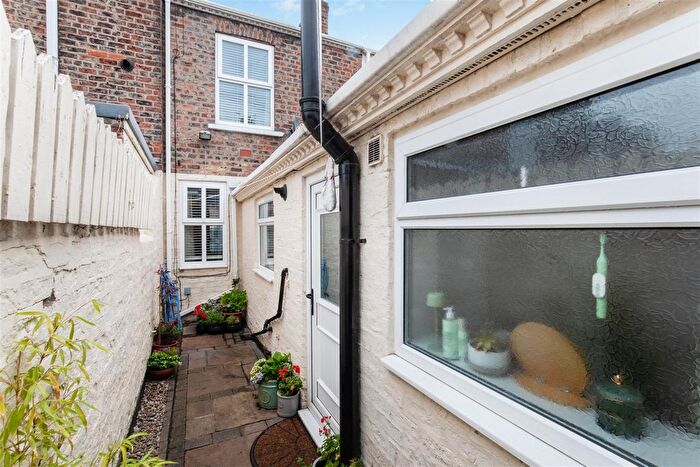
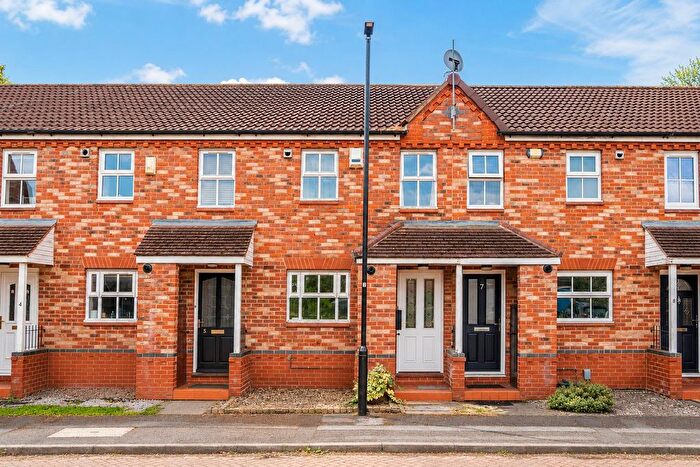
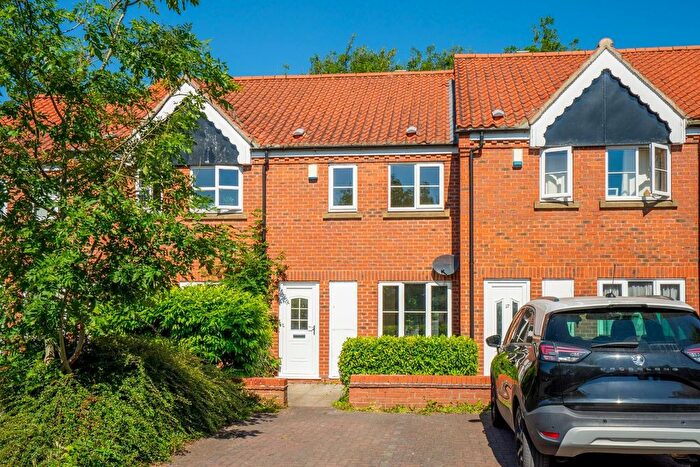
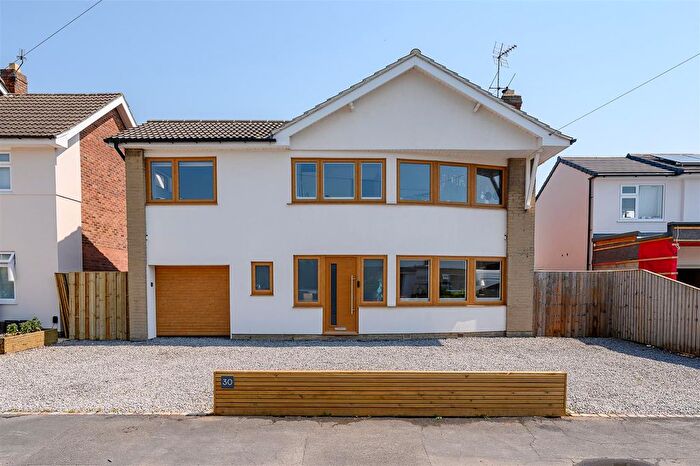
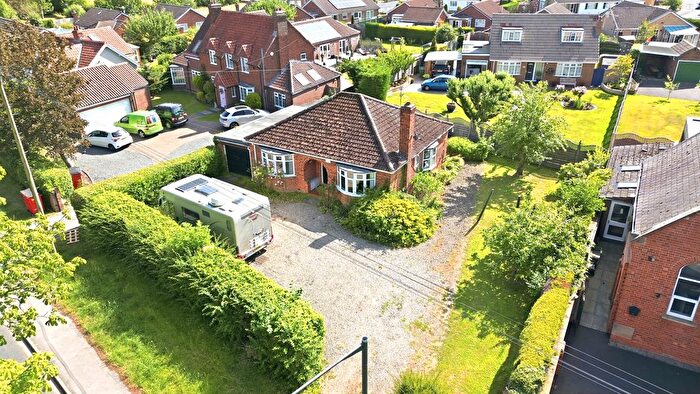
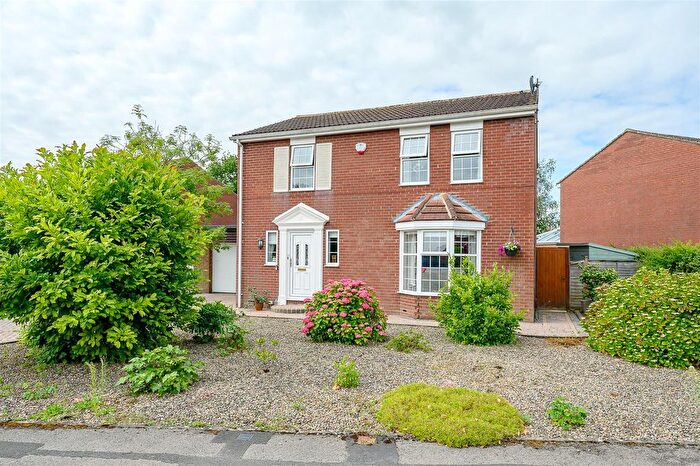
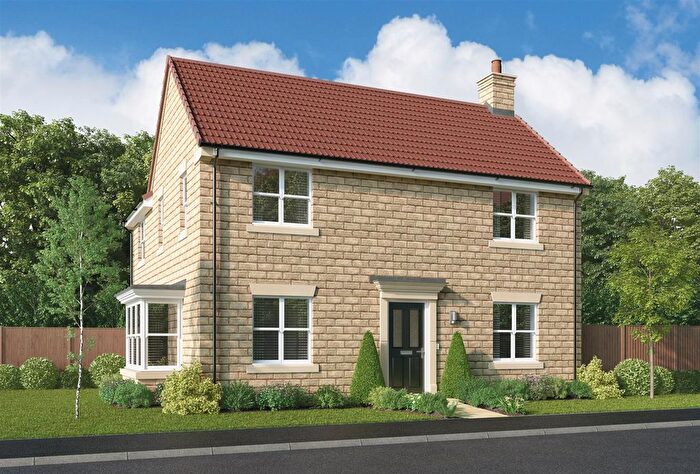
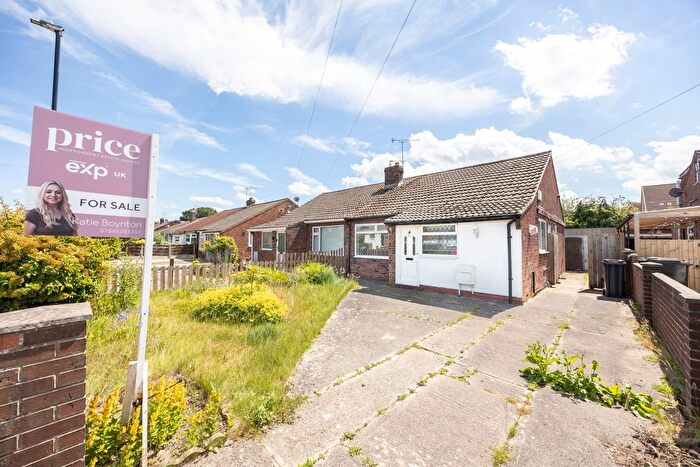
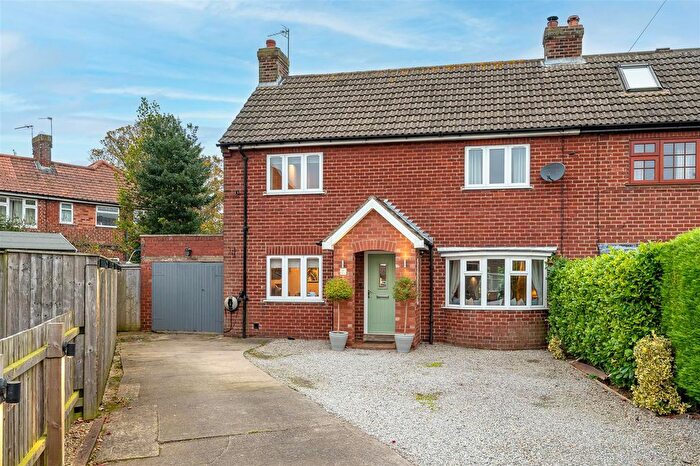
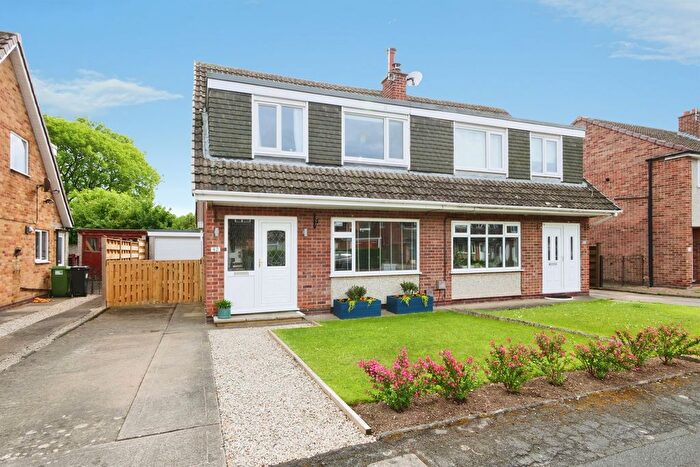
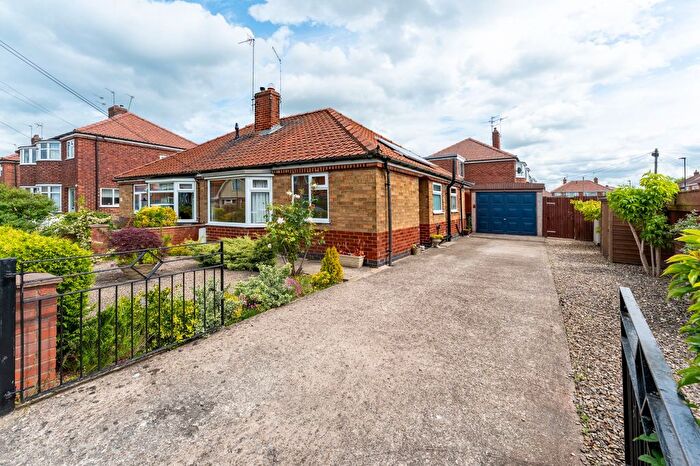
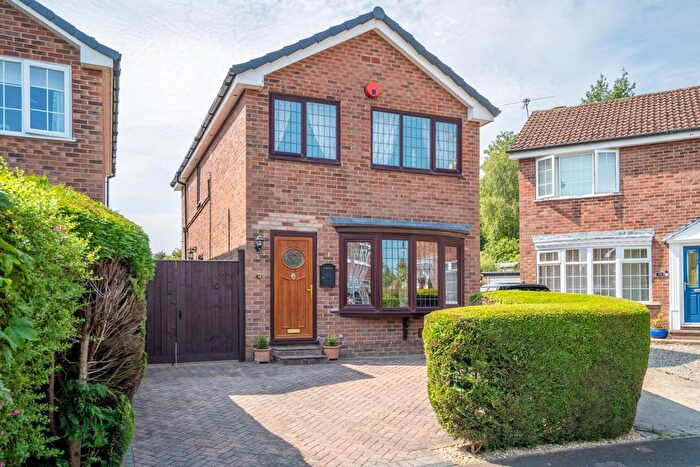
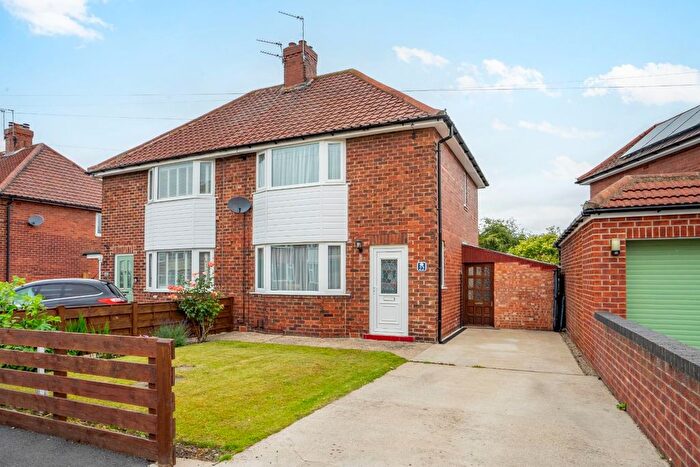
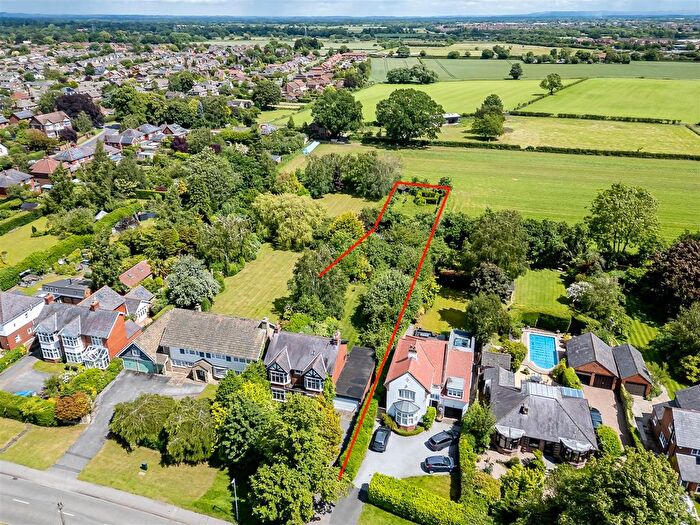
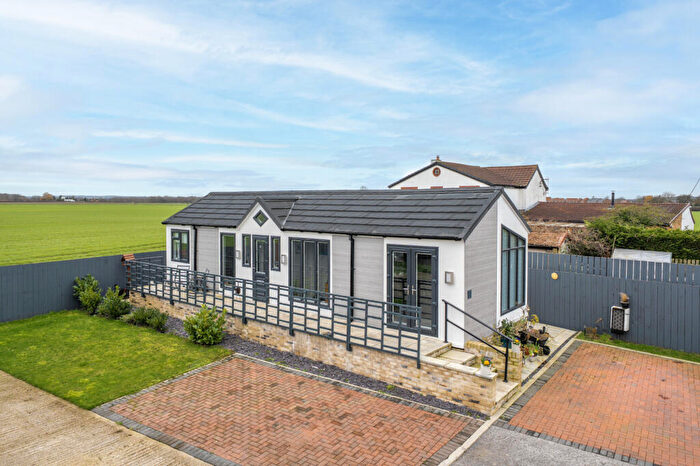
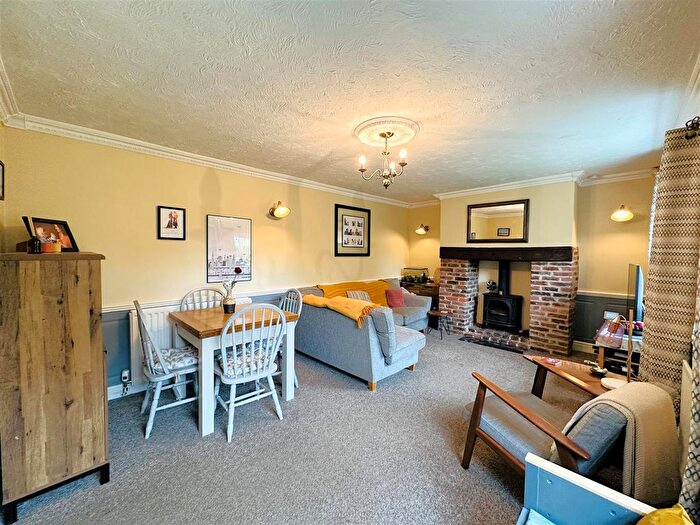
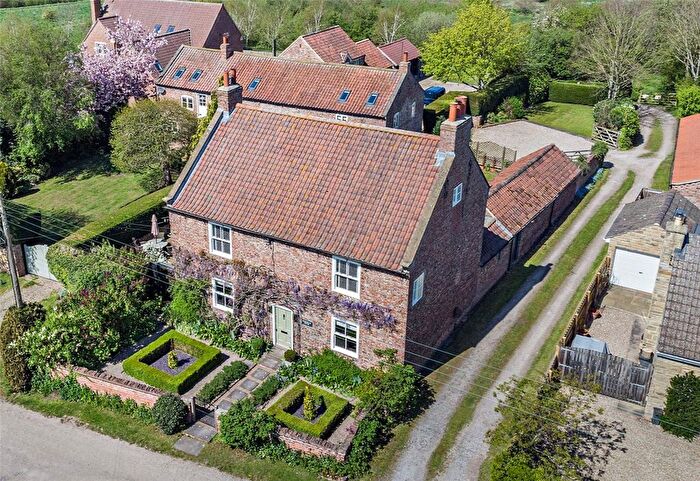
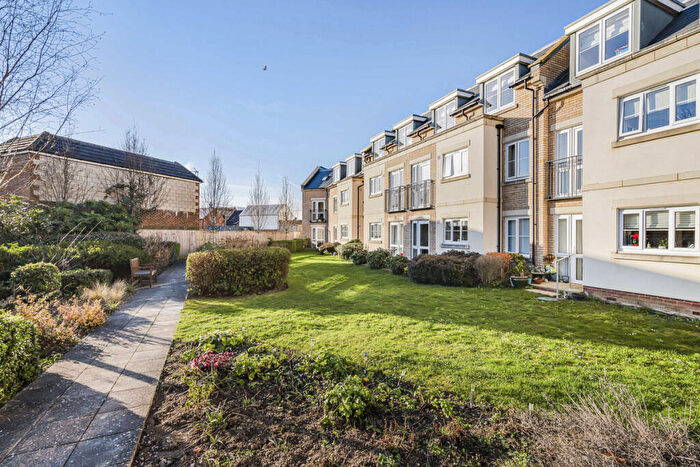
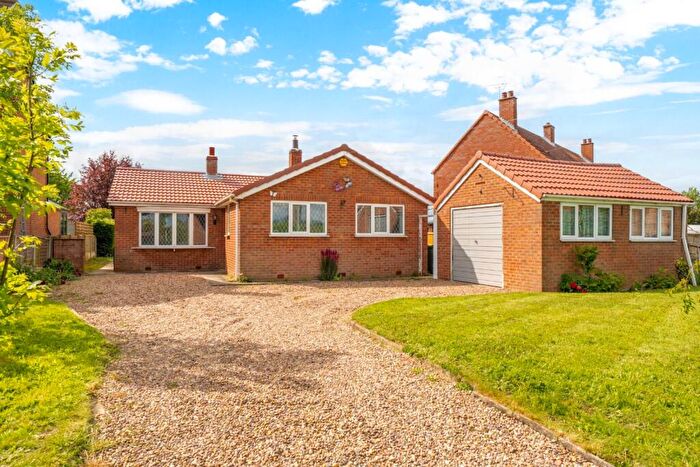
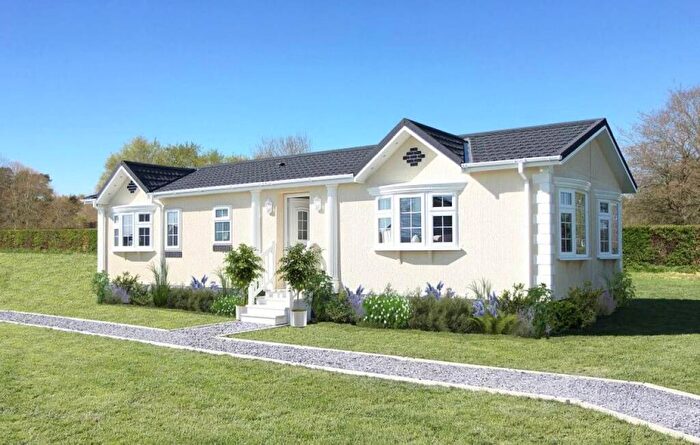
Properties for sale in York
![]()
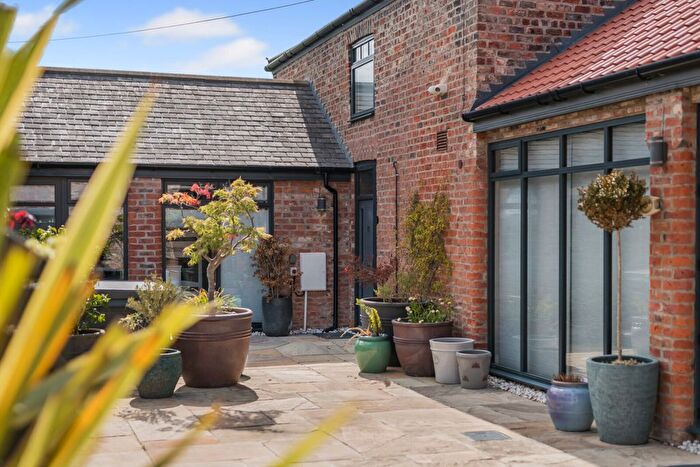
If you are looking to sell your house, let it out, or receive a property valuation, an expert can help you.
Click the button below to get started.
Neighbourhoods in York
Navigate through our locations to find the location of your next house in York, York for sale or to rent.
- Acomb
- Bishopthorpe
- Clifton
- Derwent
- Dringhouses And Woodthorpe
- Fishergate
- Fulford
- Guildhall
- Haxby And Wigginton
- Heslington
- Heworth
- Heworth Without
- Holgate
- Hull Road
- Huntington And New Earswick
- Micklegate
- Osbaldwick
- Rural West York
- Skelton, Rawcliffe And Clifton Without
- Strensall
- Westfield
- Wheldrake
- Osbaldwick & Derwent
- Fulford & Heslington
- Dringhouses & Woodthorpe
- Appleton Roebuck & Church Fenton
- Copmanthorpe
- Rawcliffe & Clifton Without
- Huntington & New Earswick
- Haxby & Wigginton
Property price trends in York
According to the latest Land Registry data, the average home in York sold for £393,471 in 2026. That figure comes from a substantial record of 112,979 sales logged over the past 31 years.
Prices have continued to climb over the last three years. Compared with 2023, when the typical sale came in around £350,706, that's a rise of roughly 12.2%.
Looking back five years, average prices are up about 23.1% since 2021, a gain of around £73,920 in cash terms.
Zoom out to the past decade for the fuller picture. Back in 2016, homes here averaged £255,012, so the typical sold price has climbed about 54.3% since then, roughly 4.4% a year. Stretch the view to fifteen years and that annual pace holds at about 4.6%.
Frequently asked questions about York
What is the average price for a property for sale in York?
The average price for a property for sale in York is £346,273. This amount is 0.04% higher than the average price in York. There are more than 10,000 property listings for sale in York.
What locations have the most expensive properties for sale in York?
The locations with the most expensive properties for sale in York are Dringhouses & Woodthorpe at an average of £468,150, Haxby & Wigginton at an average of £466,268 and Rural West York at an average of £460,159.
What locations have the most affordable properties for sale in York?
The locations with the most affordable properties for sale in York are Copmanthorpe at an average of £259,333, Rawcliffe & Clifton Without at an average of £261,158 and Westfield at an average of £261,790.
Which train stations are available in or near York?
Some of the train stations available in or near York are York, Poppleton and Hammerton.
Property Price Paid in York by Year
The average sold property price by year was:
| Year | Average Sold Price | Price Change |
Sold Properties
|
|---|---|---|---|
| 2026 | £393,471 | 14% |
171 Properties |
| 2025 | £338,049 | -3% |
2,641 Properties |
| 2024 | £346,921 | -1% |
2,856 Properties |
| 2023 | £350,706 | 4% |
2,662 Properties |
| 2022 | £335,833 | 5% |
3,219 Properties |
| 2021 | £319,551 | 9% |
4,232 Properties |
| 2020 | £291,880 | 5% |
2,857 Properties |
| 2019 | £276,971 | 2% |
3,448 Properties |
| 2018 | £270,244 | 3% |
3,595 Properties |
| 2017 | £261,267 | 2% |
3,804 Properties |
Property Price per Property Type in York
Here you can find historic sold price data in order to help with your property search.
The average Property Paid Price for specific property types in the last three years are:
| Property Type | Average Sold Price | Sold Properties |
|---|---|---|
| Semi Detached House | £330,891.00 | 2,730 Semi Detached Houses |
| Terraced House | £331,940.00 | 2,668 Terraced Houses |
| Detached House | £485,464.00 | 1,680 Detached Houses |
| Flat | £223,585.00 | 1,252 Flats |
Transport in York
Please see below transportation links in this area:
