
Houses for sale & to rent in Heworth, York
House Prices in Heworth
Properties in Heworth have an average house price of £307k and had 467 Property Transactions within the last 3 years¹.
Heworth is an area in York, York with 5,728 households², where the most expensive property was sold for £830k.
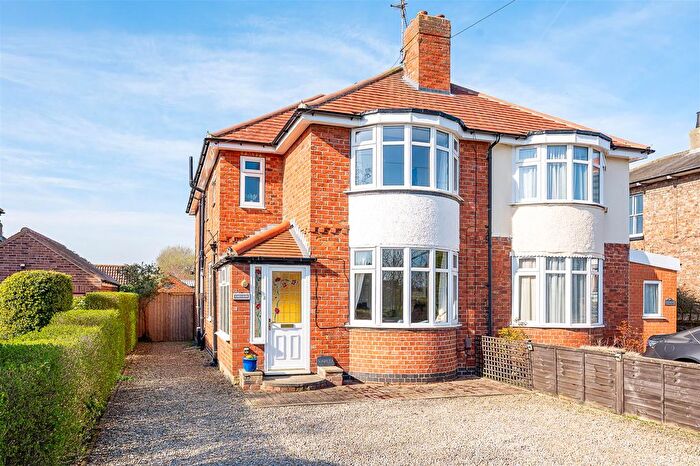
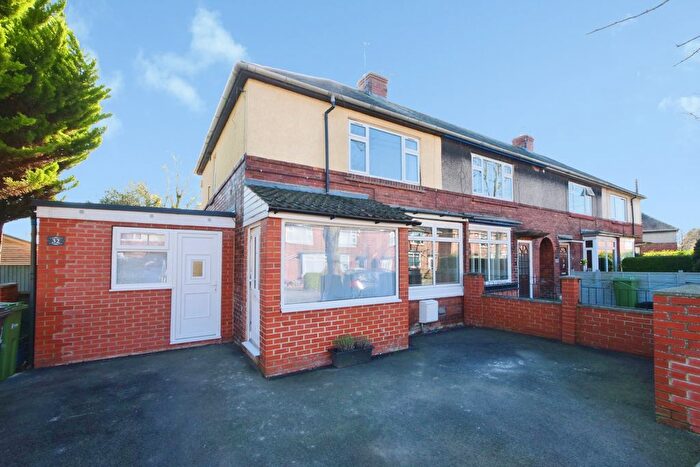
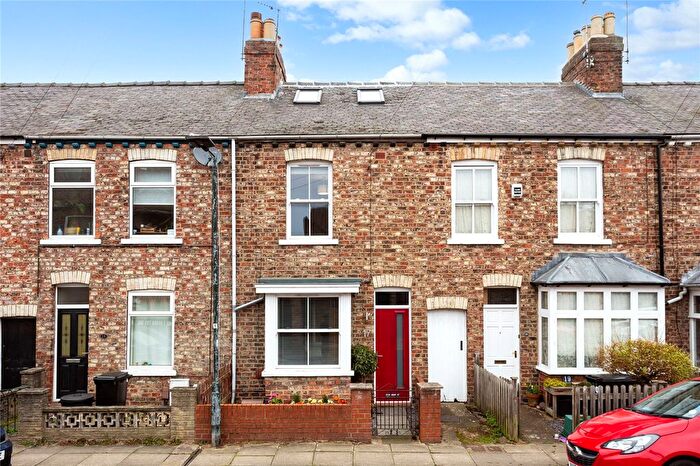
Properties for sale in Heworth
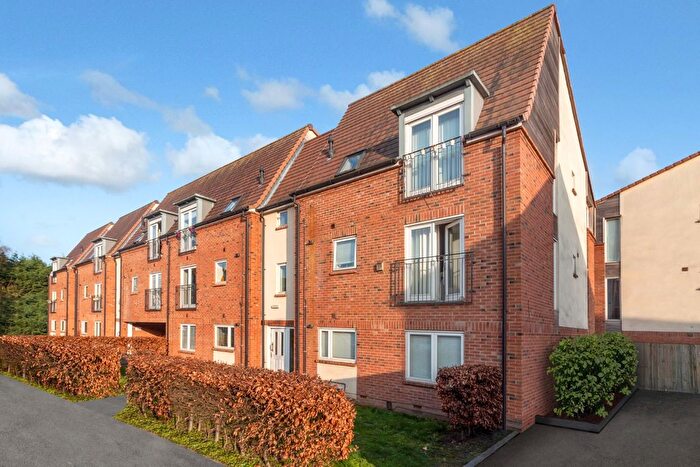
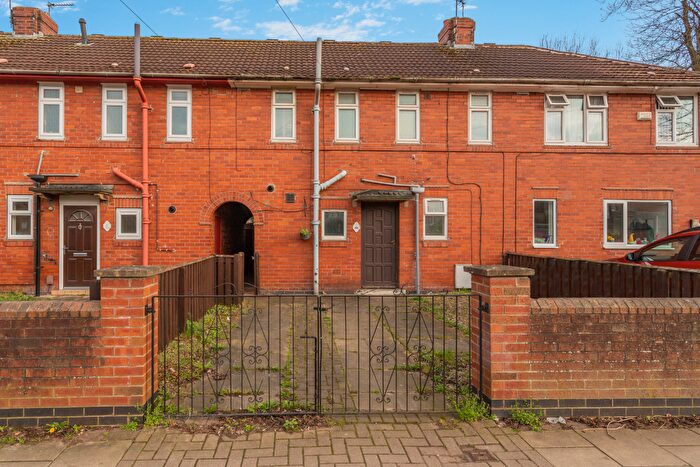
![]()
If you are looking to sell your house, let it out, or receive a property valuation, an expert can help you.
Click the button below to get started.
Roads and Postcodes in Heworth
Navigate through our locations to find the location of your next house in Heworth, York for sale or to rent.
Transport near Heworth

- FAQ
- Price Paid By Year
- Property Type Price
Frequently asked questions about Heworth
What is the average price for a property for sale in Heworth?
The average price for a property for sale in Heworth is £306,926. This amount is 11% lower than the average price in York. There are 1,419 property listings for sale in Heworth.
What streets have the most expensive properties for sale in Heworth?
The streets with the most expensive properties for sale in Heworth are Stockton Lane at an average of £644,400, Parade Court at an average of £565,500 and Hempland Lane at an average of £561,083.
What streets have the most affordable properties for sale in Heworth?
The streets with the most affordable properties for sale in Heworth are Croft Gardens at an average of £81,000, Richmond Street at an average of £104,680 and Windsor Court at an average of £160,000.
Which train stations are available in or near Heworth?
Some of the train stations available in or near Heworth are York, Poppleton and Hammerton.
Property Price Paid in Heworth by Year
The average sold property price by year was:
| Year | Average Sold Price | Price Change |
Sold Properties
|
|---|---|---|---|
| 2026 | £470,666 | 36% |
3 Properties |
| 2025 | £302,768 | -1% |
131 Properties |
| 2024 | £307,163 | - |
165 Properties |
| 2023 | £307,011 | 3% |
168 Properties |
| 2022 | £297,708 | 3% |
204 Properties |
| 2021 | £287,478 | 16% |
243 Properties |
| 2020 | £240,747 | -0,5% |
188 Properties |
| 2019 | £241,850 | -5% |
188 Properties |
| 2018 | £255,112 | 9% |
198 Properties |
| 2017 | £231,946 | 2% |
175 Properties |
| 2016 | £227,135 | 5% |
232 Properties |
| 2015 | £216,377 | 12% |
267 Properties |
| 2014 | £190,901 | 1% |
236 Properties |
| 2013 | £188,655 | 3% |
176 Properties |
| 2012 | £183,051 | 12% |
169 Properties |
| 2011 | £161,037 | -1% |
187 Properties |
| 2010 | £163,262 | 5% |
149 Properties |
| 2009 | £154,589 | -9% |
272 Properties |
| 2008 | £168,746 | -7% |
177 Properties |
| 2007 | £180,765 | 5% |
289 Properties |
| 2006 | £171,687 | 9% |
283 Properties |
| 2005 | £156,698 | 1% |
214 Properties |
| 2004 | £154,830 | 12% |
280 Properties |
| 2003 | £135,944 | 18% |
288 Properties |
| 2002 | £111,152 | 15% |
270 Properties |
| 2001 | £94,817 | 20% |
234 Properties |
| 2000 | £75,912 | 16% |
220 Properties |
| 1999 | £63,858 | 7% |
239 Properties |
| 1998 | £59,689 | 4% |
153 Properties |
| 1997 | £57,536 | -0,4% |
167 Properties |
| 1996 | £57,762 | 2% |
155 Properties |
| 1995 | £56,736 | - |
132 Properties |
Property Price per Property Type in Heworth
Here you can find historic sold price data in order to help with your property search.
The average Property Paid Price for specific property types in the last three years are:
| Property Type | Average Sold Price | Sold Properties |
|---|---|---|
| Semi Detached House | £348,720.00 | 190 Semi Detached Houses |
| Detached House | £443,077.00 | 27 Detached Houses |
| Terraced House | £299,365.00 | 165 Terraced Houses |
| Flat | £184,933.00 | 85 Flats |