
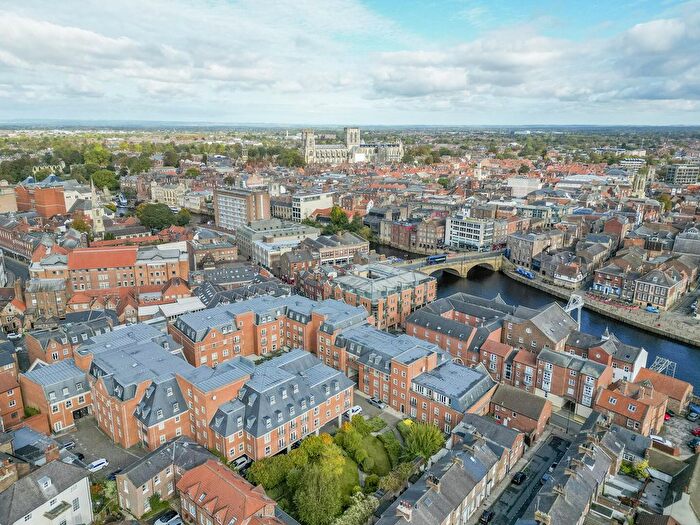
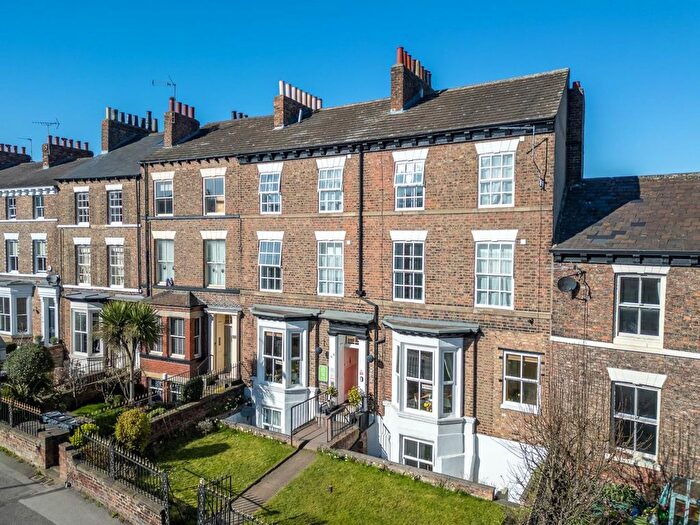
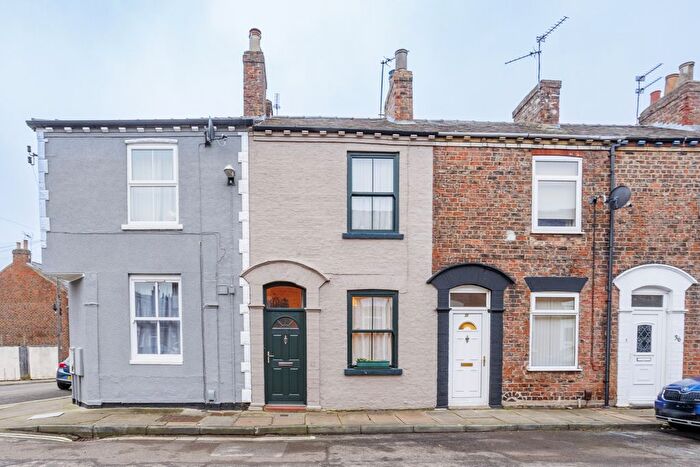
Houses for sale & to rent in Micklegate, York
House Prices in Micklegate
Properties in Micklegate have an average house price of £382k and had 738 Property Transactions within the last 3 years¹.
Micklegate is an area in York, York with 6,132 households², where the most expensive property was sold for £2.25M.
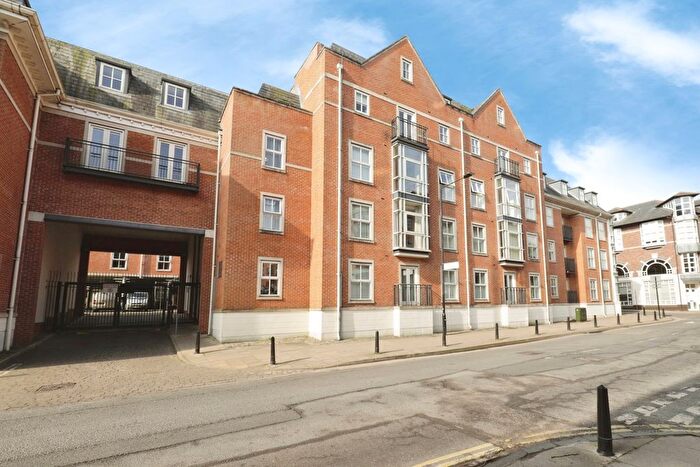
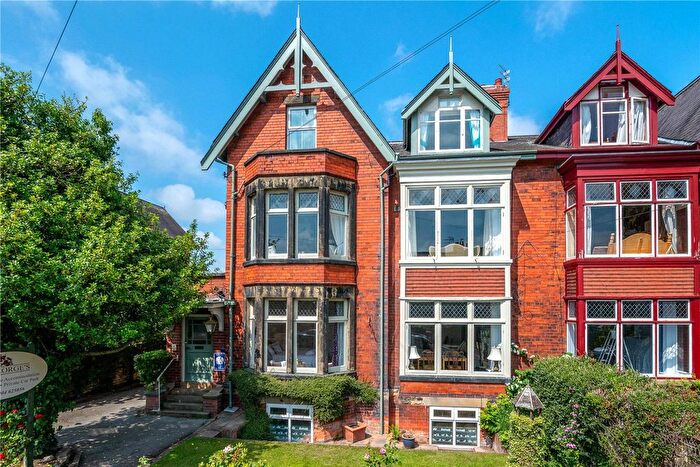
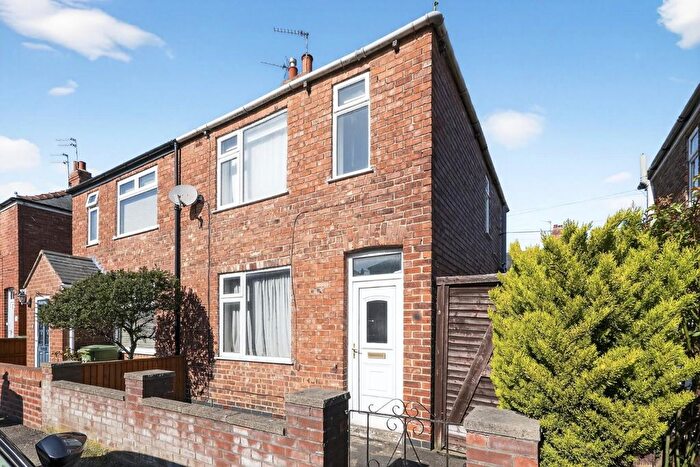
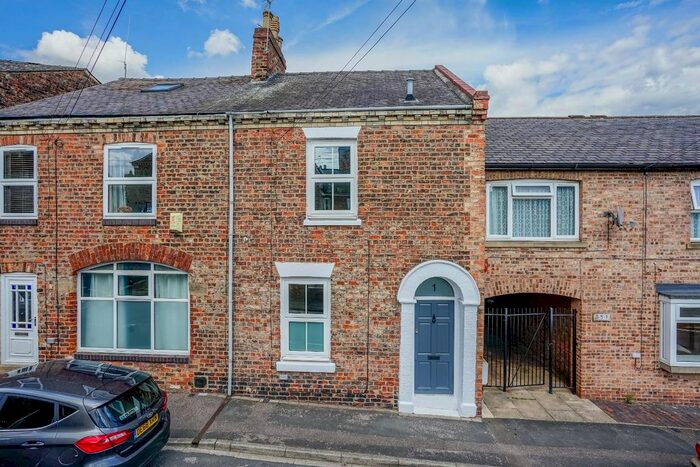
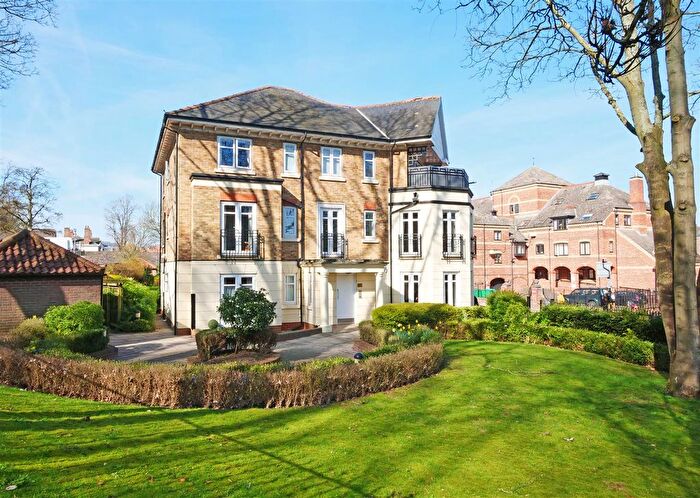
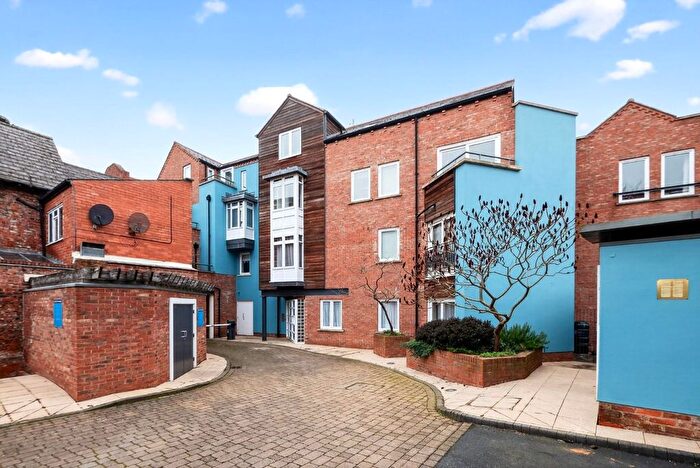
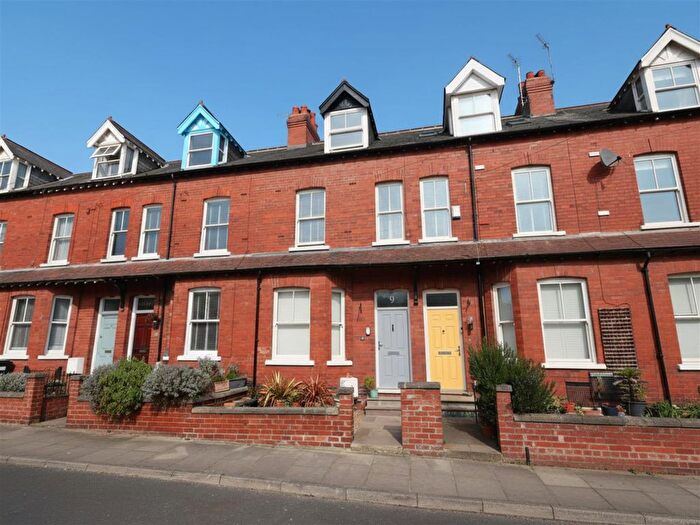
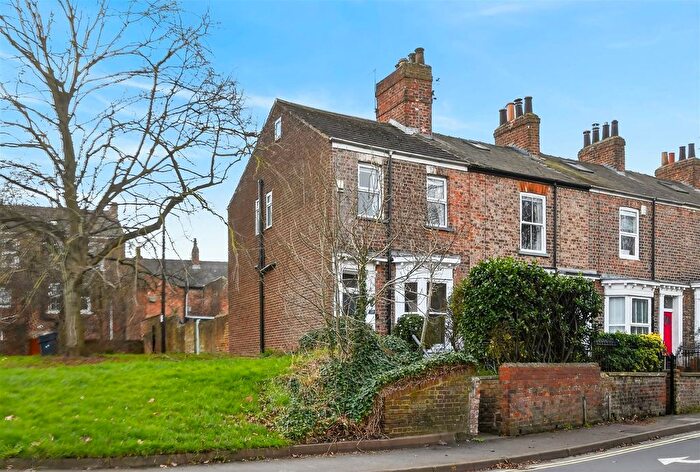
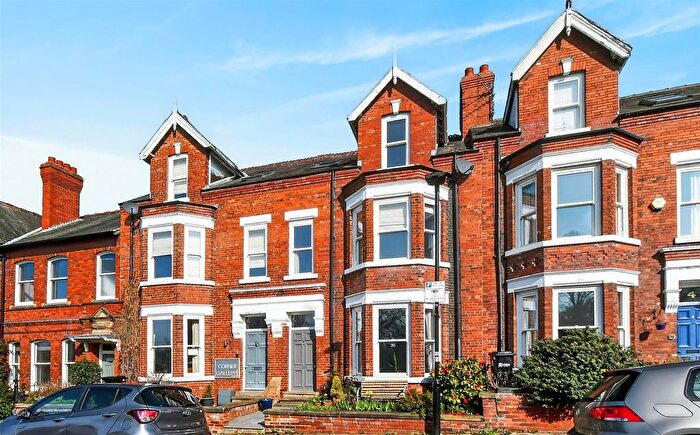
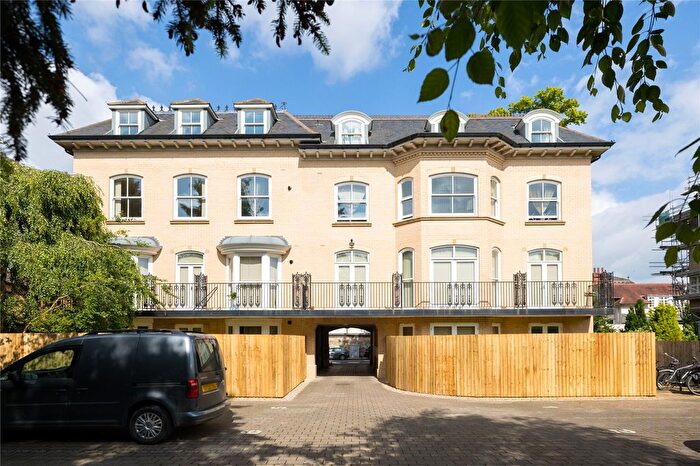
Properties for sale in Micklegate
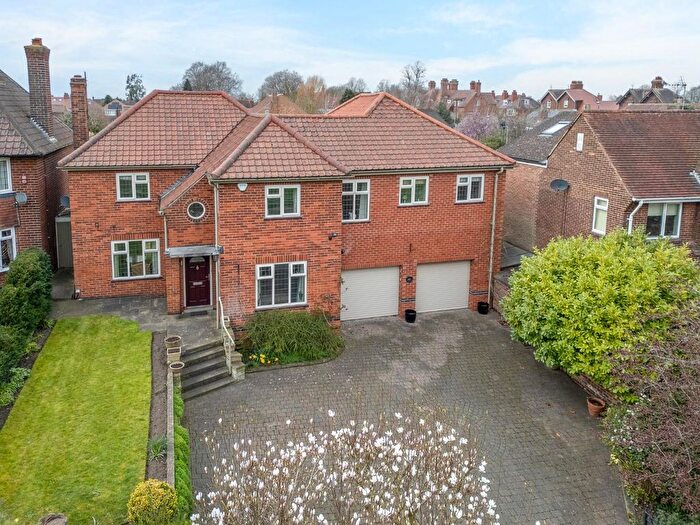
![]()
If you are looking to sell your house, let it out, or receive a property valuation, an expert can help you.
Click the button below to get started.
Roads and Postcodes in Micklegate
Navigate through our locations to find the location of your next house in Micklegate, York for sale or to rent.
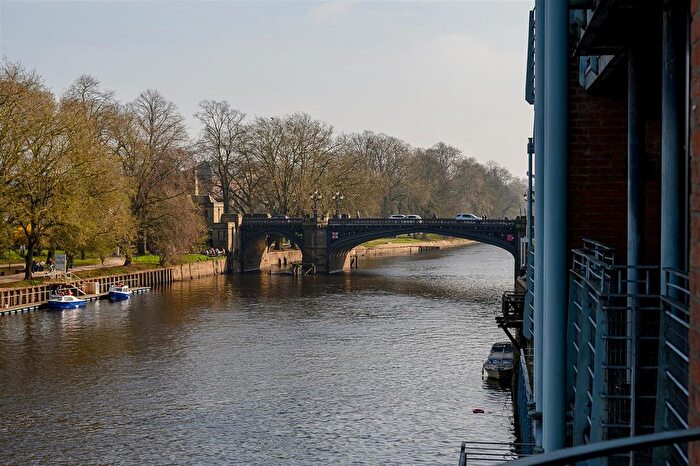
Transport near Micklegate

- FAQ
- Price Paid By Year
- Property Type Price
Frequently asked questions about Micklegate
What is the average price for a property for sale in Micklegate?
The average price for a property for sale in Micklegate is £381,993. This amount is 11% higher than the average price in York. There are 2,132 property listings for sale in Micklegate.
What streets have the most expensive properties for sale in Micklegate?
The streets with the most expensive properties for sale in Micklegate are Mount Vale at an average of £1,194,680, Trentholme Drive at an average of £842,142 and The Mount at an average of £834,000.
What streets have the most affordable properties for sale in Micklegate?
The streets with the most affordable properties for sale in Micklegate are Cambridge Mews at an average of £113,250, Tanner Row at an average of £147,875 and St Georges Place at an average of £148,000.
Which train stations are available in or near Micklegate?
Some of the train stations available in or near Micklegate are York, Poppleton and Hammerton.
Property Price Paid in Micklegate by Year
The average sold property price by year was:
| Year | Average Sold Price | Price Change |
Sold Properties
|
|---|---|---|---|
| 2026 | £333,000 | -9% |
5 Properties |
| 2025 | £362,814 | -8% |
215 Properties |
| 2024 | £392,292 | 1% |
270 Properties |
| 2023 | £388,395 | 1% |
248 Properties |
| 2022 | £384,775 | 4% |
312 Properties |
| 2021 | £369,553 | 9% |
422 Properties |
| 2020 | £336,300 | 5% |
253 Properties |
| 2019 | £320,873 | -4% |
317 Properties |
| 2018 | £332,530 | -2% |
356 Properties |
| 2017 | £338,899 | 12% |
408 Properties |
| 2016 | £297,464 | 11% |
414 Properties |
| 2015 | £264,303 | 5% |
319 Properties |
| 2014 | £251,176 | 7% |
333 Properties |
| 2013 | £233,319 | 5% |
323 Properties |
| 2012 | £222,210 | 6% |
290 Properties |
| 2011 | £208,525 | -10% |
277 Properties |
| 2010 | £229,439 | 11% |
253 Properties |
| 2009 | £203,244 | -2% |
255 Properties |
| 2008 | £208,128 | -11% |
197 Properties |
| 2007 | £231,134 | 13% |
411 Properties |
| 2006 | £200,794 | 6% |
465 Properties |
| 2005 | £189,545 | -3% |
450 Properties |
| 2004 | £195,533 | 19% |
364 Properties |
| 2003 | £158,914 | 5% |
468 Properties |
| 2002 | £150,446 | 25% |
577 Properties |
| 2001 | £112,441 | 17% |
428 Properties |
| 2000 | £93,546 | 11% |
430 Properties |
| 1999 | £82,910 | 14% |
484 Properties |
| 1998 | £71,482 | 6% |
402 Properties |
| 1997 | £67,443 | 10% |
420 Properties |
| 1996 | £60,776 | 2% |
319 Properties |
| 1995 | £59,851 | - |
239 Properties |
Property Price per Property Type in Micklegate
Here you can find historic sold price data in order to help with your property search.
The average Property Paid Price for specific property types in the last three years are:
| Property Type | Average Sold Price | Sold Properties |
|---|---|---|
| Semi Detached House | £447,577.00 | 64 Semi Detached Houses |
| Detached House | £685,050.00 | 20 Detached Houses |
| Terraced House | £403,079.00 | 461 Terraced Houses |
| Flat | £278,474.00 | 193 Flats |