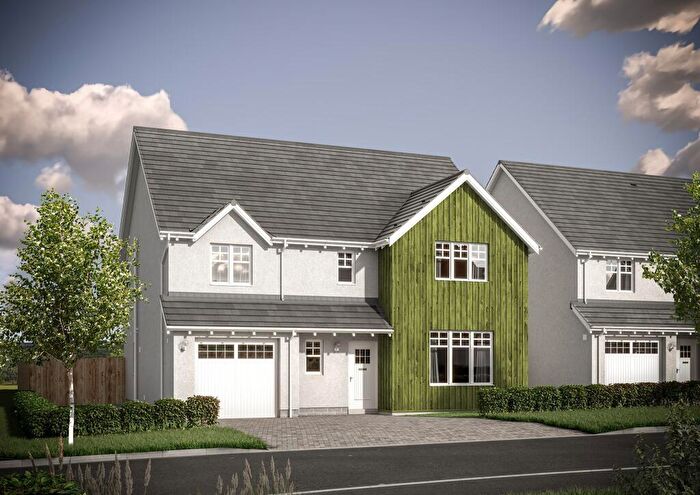
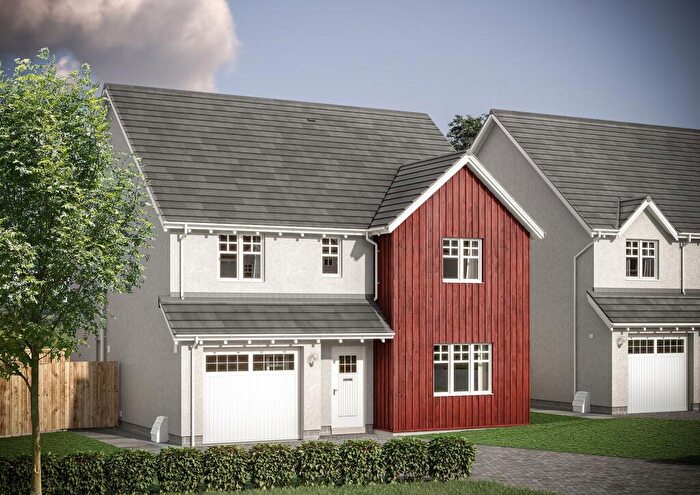
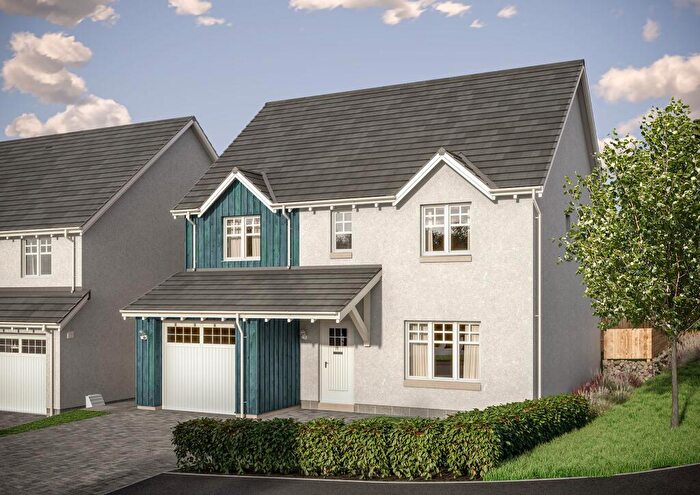
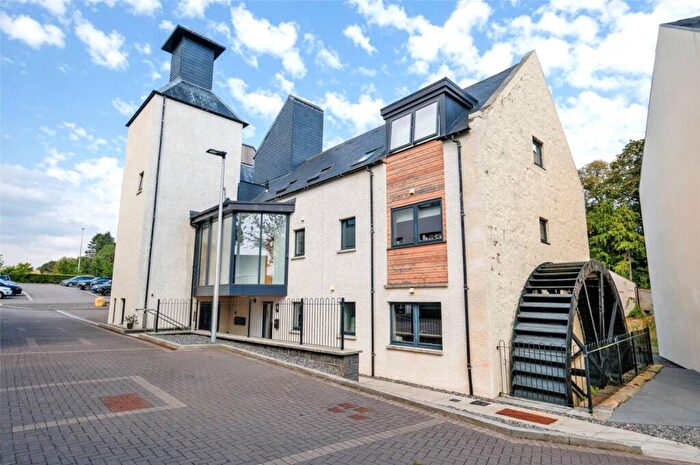
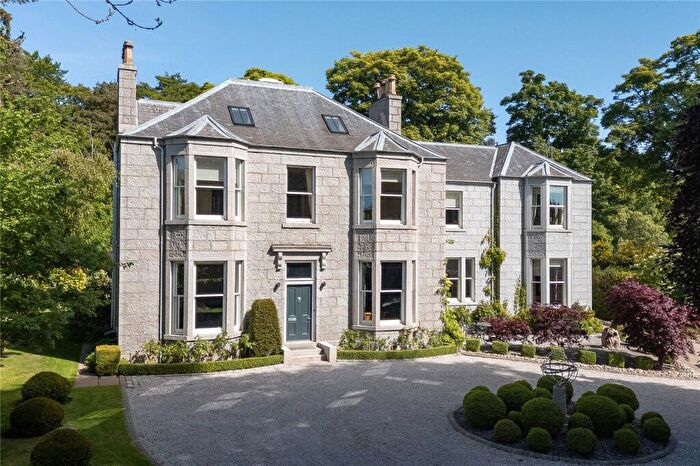
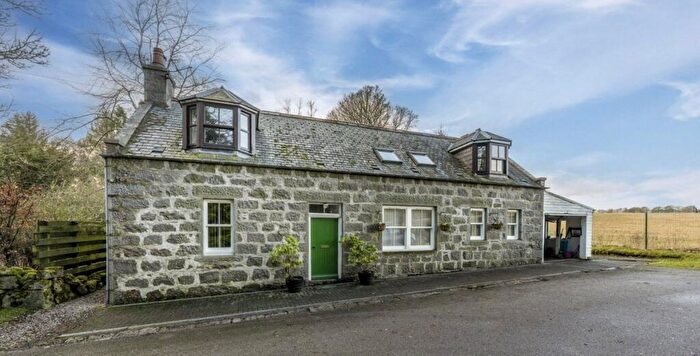
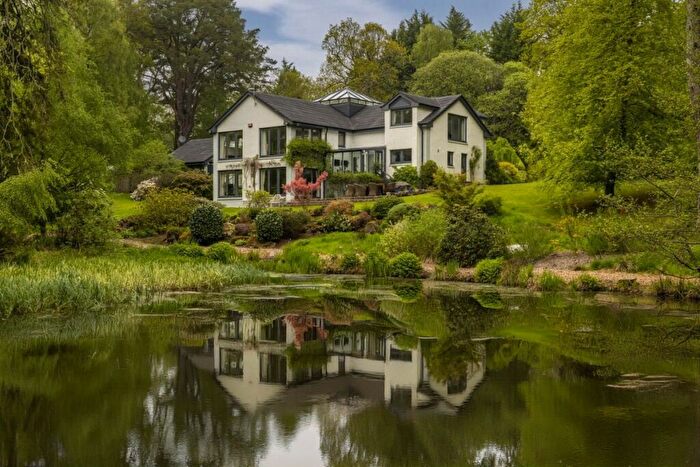
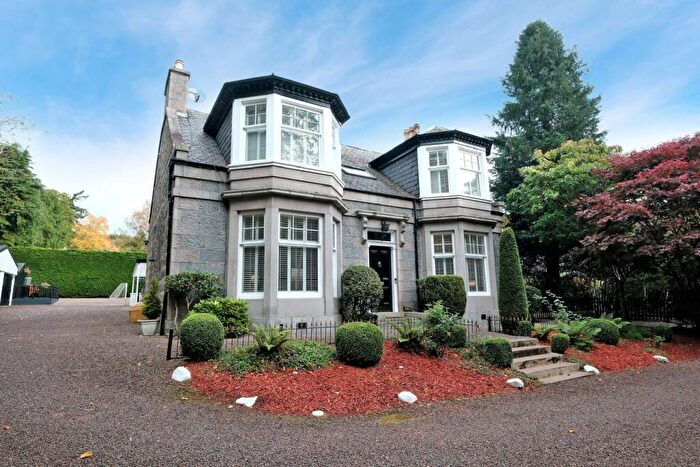
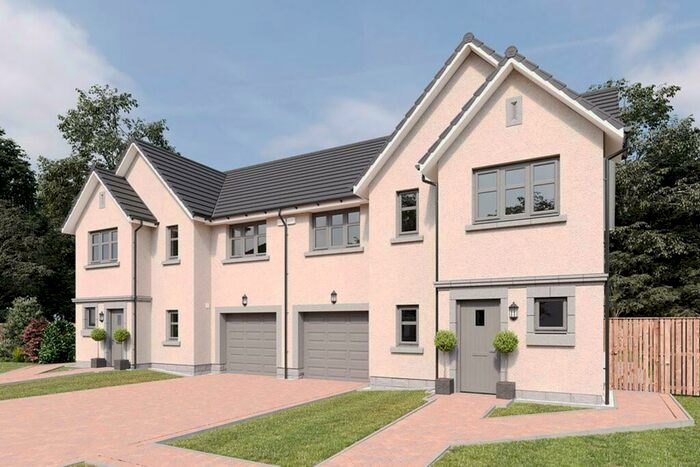
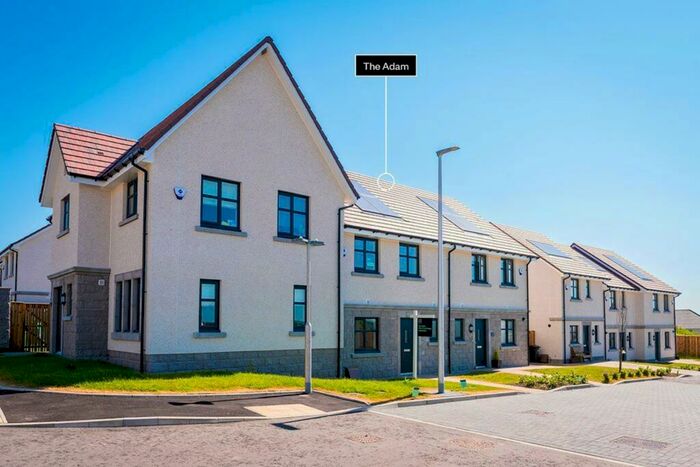
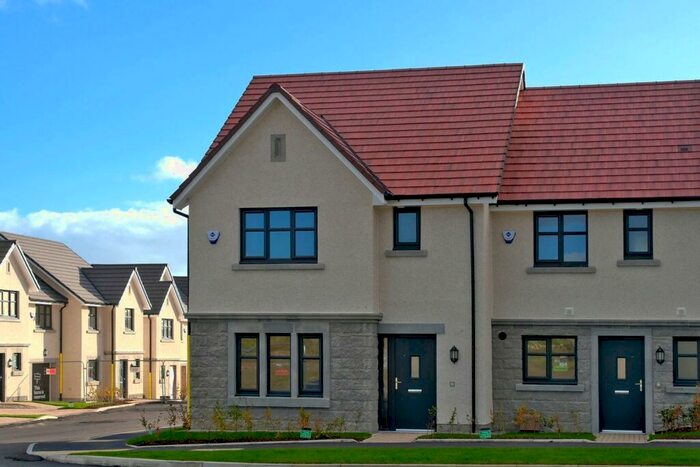
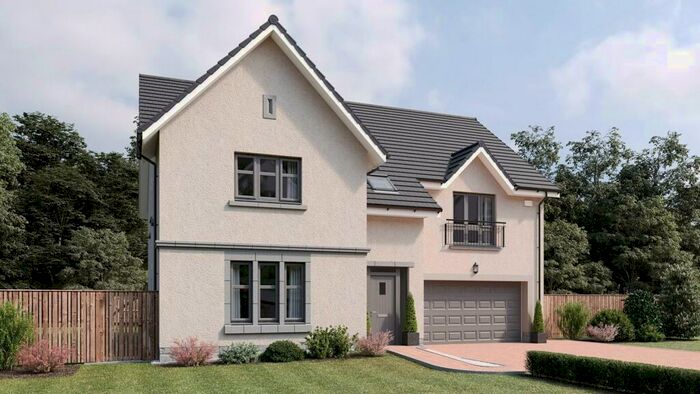
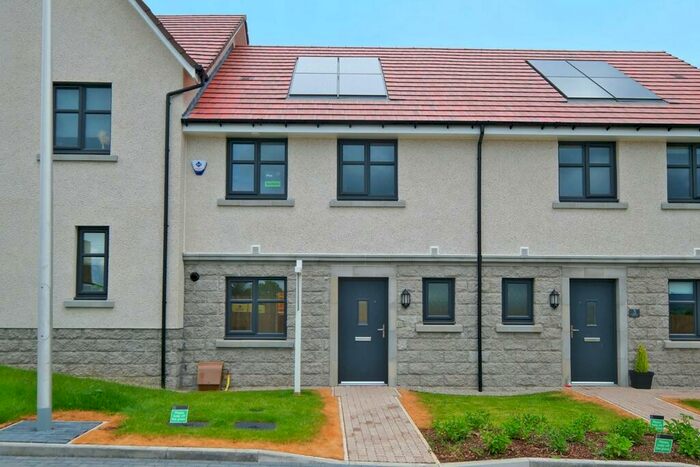
Houses for sale & to rent in Lower Deeside, Milltimber
House Prices in Lower Deeside
Properties in Lower Deeside have an average house price of £376,312.00 and had 57 Property Transactions within the last 3 years¹.
Lower Deeside is an area in Milltimber, Aberdeen City with 947 households², where the most expensive property was sold for £1,100,000.00.
Properties for sale in Lower Deeside
Previously listed properties in Lower Deeside
Roads and Postcodes in Lower Deeside
Navigate through our locations to find the location of your next house in Lower Deeside, Milltimber for sale or to rent.
| Streets | Postcodes |
|---|---|
| Agricola Crescent | AB13 0AY |
| Agricola Place | AB13 0BB |
| Agricola Street | AB13 0BF |
| Agricola Way | AB13 0BE |
| Beaconhill Road | AB13 0JP AB13 0JR |
| Bellenden Walk | AB13 0EY |
| Binghill Crescent | AB13 0HP AB13 0HU |
| Binghill Drive | AB13 0JE |
| Binghill Grove | AB13 0HF |
| Binghill Hedges | AB13 0JJ |
| Binghill Park | AB13 0EE |
| Binghill Road | AB13 0HN AB13 0HR AB13 0JA AB13 0JH |
| Binghill Road North | AB13 0JD |
| Binghill Road West | AB13 0JB |
| Braehead Terrace | AB13 0EB AB13 0ED |
| Colthill Circle | AB13 0EH |
| Colthill Crescent | AB13 0EG |
| Colthill Drive | AB13 0EW |
| Colthill Road | AB13 0EF |
| Contlaw Brae | AB13 0DT AB13 0DU |
| Contlaw Place | AB13 0DS |
| Contlaw Road | AB13 0DR AB13 0EJ AB13 0EL AB13 0ES |
| Culter House Road | AB13 0EN AB13 0EP AB13 0EZ |
| Milltimber Brae | AB13 0DY |
| Milltimber Gardens | AB13 0AS |
| Milltimber Gardens Crescent | AB13 0AW |
| Milltimber Gardens East | AB13 0AX |
| Milltimber Gardens South | AB13 0AT |
| Milltimber Gardens Walk | AB13 0BH |
| Milltimber Gardens West | AB13 0AU |
| Monearn Gardens | AB13 0DX AB13 0EA |
| Murtle Den Crescent | AB13 0GY |
| Murtle Den Drive | AB13 0HH |
| Murtle Den Gardens | AB13 0HY |
| Murtle Den Place | AB13 0HG |
| Murtle Den Road | AB13 0HS |
| Murtle Den Walk | AB13 0GZ |
| Murtle Den Wynd | AB13 0HZ |
| North Deeside Road | AB13 0AB AB13 0AD AB13 0AJ AB13 0DH AB13 0DJ AB13 0DL AB13 0DQ AB13 0HA AB13 0HD AB13 0HJ AB13 0HL AB13 0HW AB13 0JS |
| Oldfold Avenue | AB13 0JX |
| Oldfold Crescent | AB13 0JY |
| Oldfold Drive | AB13 0JZ |
| Oldfold Park | AB13 0JW |
| Oldfold Place | AB13 0JU |
| Oldfold Walk | AB13 0JG |
| Robertston Place | AB13 0EU |
| Station Road | AB13 0DP |
| Station Road East | AB13 0HB |
| Sunert Road | AB13 0JQ |
| The Meadows | AB13 0JT |
| Woodlea Walk | AB13 0BP |
| Woodlea Way | AB13 0BN |
| Woodlea Wynd | AB13 0BL |
| AB13 0AA AB13 0AE AB13 0AL AB13 0AN AB13 0AP AB13 0DN AB13 0EQ AB13 0ER AB13 0ET AB13 0EX AB13 0HQ AB13 0HT AB13 0HX AB13 0JL AB13 0NQ |
Transport near Lower Deeside
- FAQ
- Price Paid By Year
Frequently asked questions about Lower Deeside
What is the average price for a property for sale in Lower Deeside?
The average price for a property for sale in Lower Deeside is £376,312. There are 70 property listings for sale in Lower Deeside.
What streets have the most expensive properties for sale in Lower Deeside?
The streets with the most expensive properties for sale in Lower Deeside are Beaconhill Road at an average of £952,500, Contlaw Road at an average of £546,750 and North Deeside Road at an average of £445,562.
What streets have the most affordable properties for sale in Lower Deeside?
The streets with the most affordable properties for sale in Lower Deeside are Binghill Grove at an average of £205,057, Monearn Gardens at an average of £252,625 and Binghill Road West at an average of £263,000.
Which train stations are available in or near Lower Deeside?
Some of the train stations available in or near Lower Deeside are Portlethen, Aberdeen and Dyce.
Property Price Paid in Lower Deeside by Year
The average sold property price by year was:
| Year | Average Sold Price | Price Change |
Sold Properties
|
|---|---|---|---|
| 2025 | £375,565 | 19% |
22 Properties |
| 2024 | £303,689 | -50% |
18 Properties |
| 2023 | £454,176 | 10% |
17 Properties |
| 2022 | £408,194 | 0,5% |
80 Properties |
| 2021 | £406,294 | -41% |
79 Properties |
| 2020 | £571,111 | 27% |
33 Properties |
| 2019 | £416,203 | -22% |
87 Properties |
| 2018 | £508,779 | 11% |
74 Properties |
| 2017 | £450,519 | -12% |
78 Properties |
| 2016 | £502,665 | 21% |
45 Properties |
| 2015 | £396,066 | -15% |
30 Properties |
| 2014 | £453,597 | 6% |
44 Properties |
| 2013 | £425,125 | 14% |
50 Properties |
| 2012 | £367,024 | -7% |
38 Properties |
| 2011 | £391,608 | 17% |
41 Properties |
| 2010 | £323,300 | -15% |
32 Properties |
| 2009 | £371,057 | -19% |
45 Properties |
| 2008 | £441,832 | 11% |
31 Properties |
| 2007 | £394,577 | 36% |
29 Properties |
| 2006 | £254,166 | -1% |
41 Properties |
| 2005 | £255,460 | 14% |
44 Properties |
| 2004 | £219,224 | 9% |
36 Properties |
| 2003 | £200,187 | 17% |
46 Properties |
| 2002 | £166,137 | 17% |
51 Properties |
| 2001 | £137,300 | - |
5 Properties |

