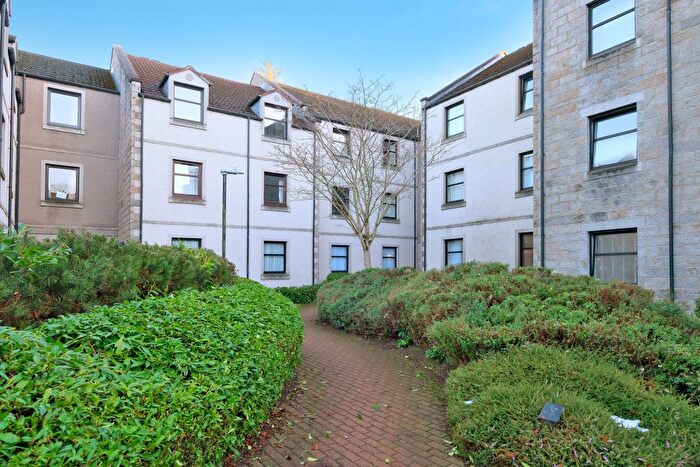
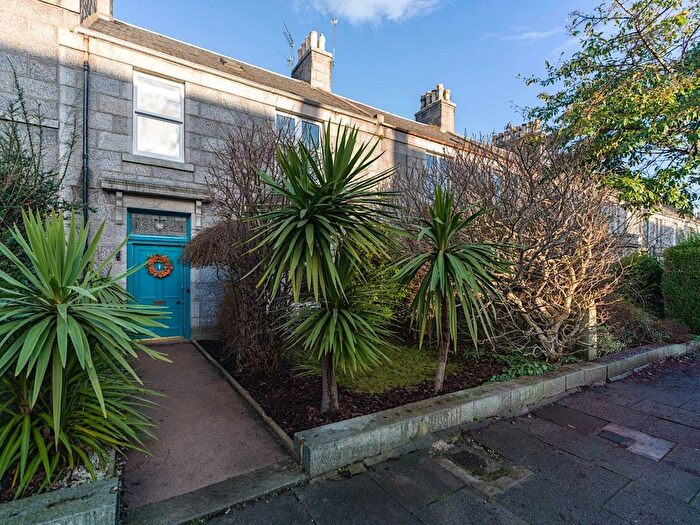
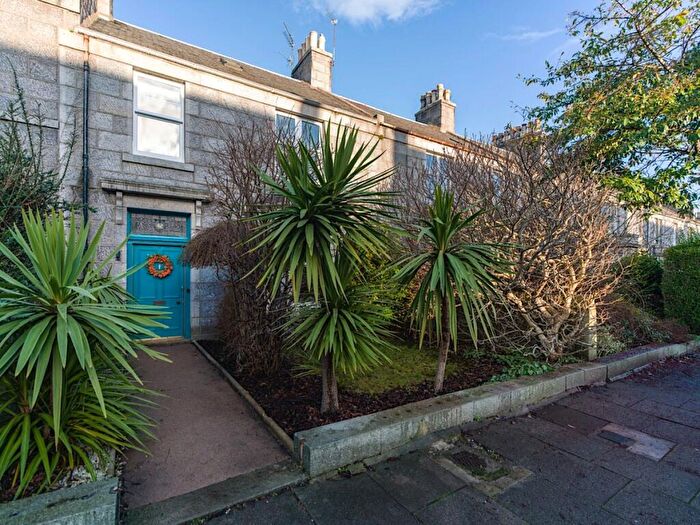
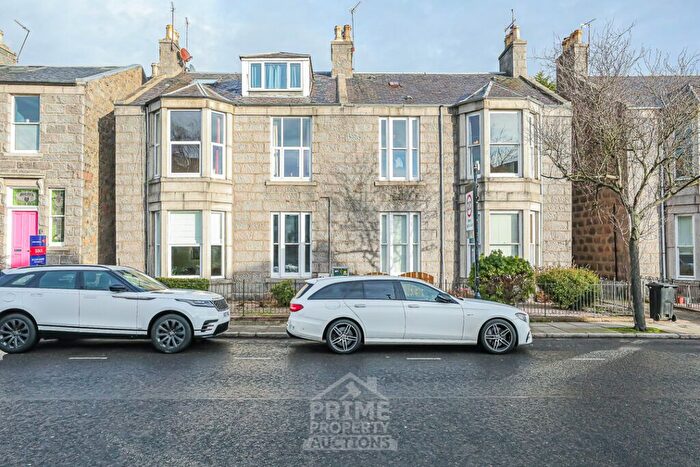
Houses for sale & to rent in Airyhall/Broomhill/Garthdee, Aberdeen
House Prices in Airyhall/Broomhill/Garthdee
Properties in Airyhall/Broomhill/Garthdee have an average house price of £164,308.00 and had 62 Property Transactions within the last 3 years¹.
Airyhall/Broomhill/Garthdee is an area in Aberdeen, Aberdeen City with 7,779 households², where the most expensive property was sold for £420,000.00.
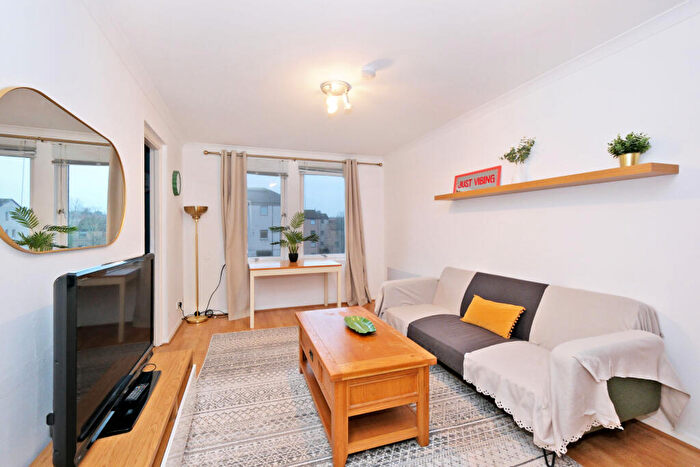
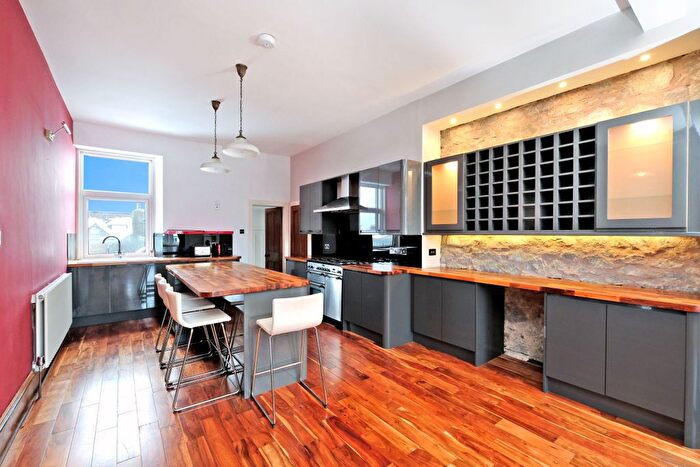
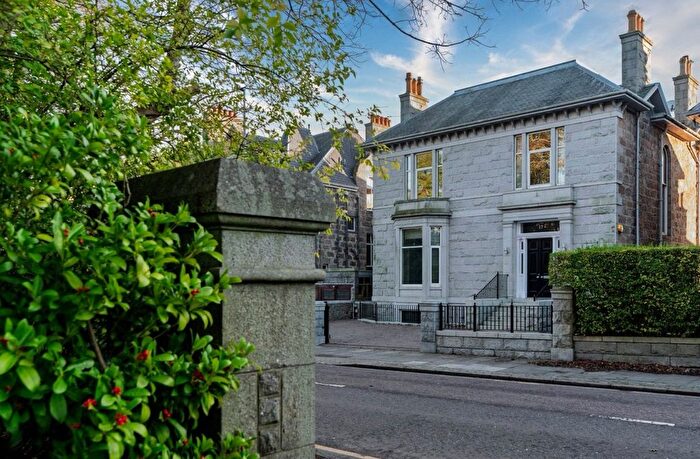
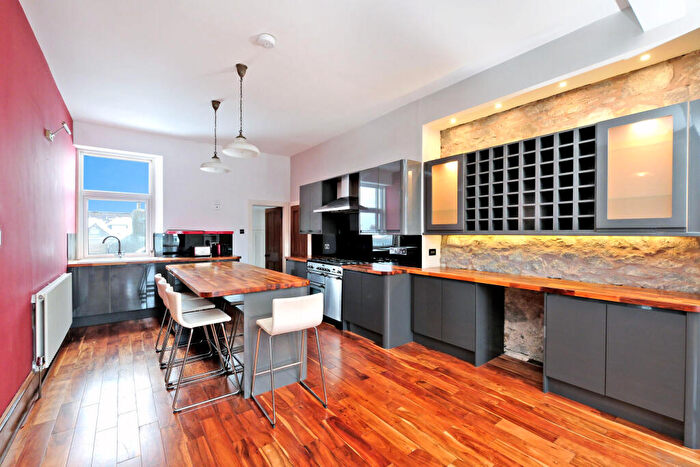
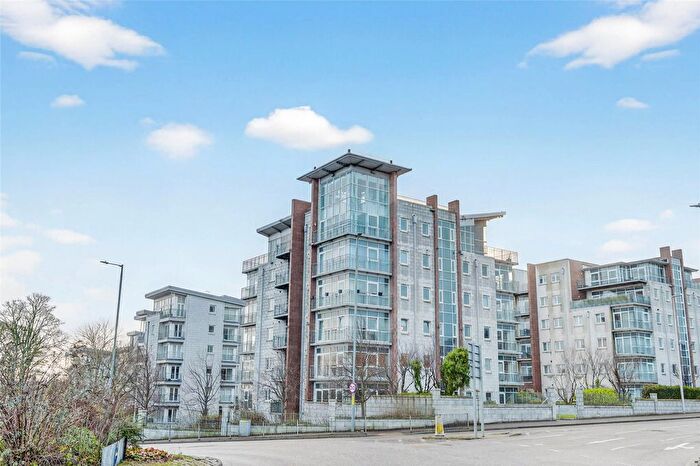
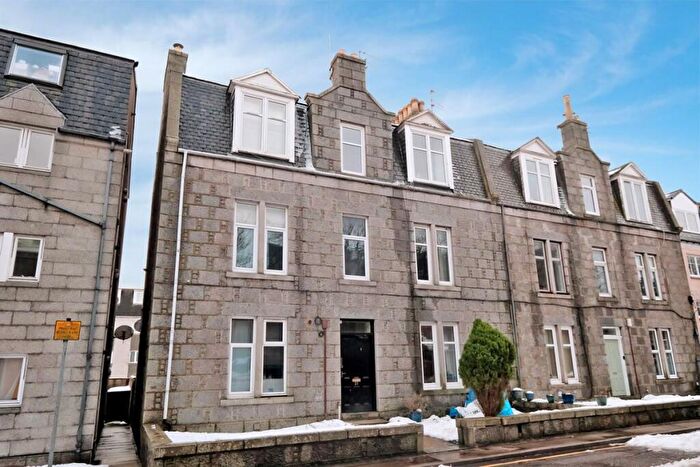
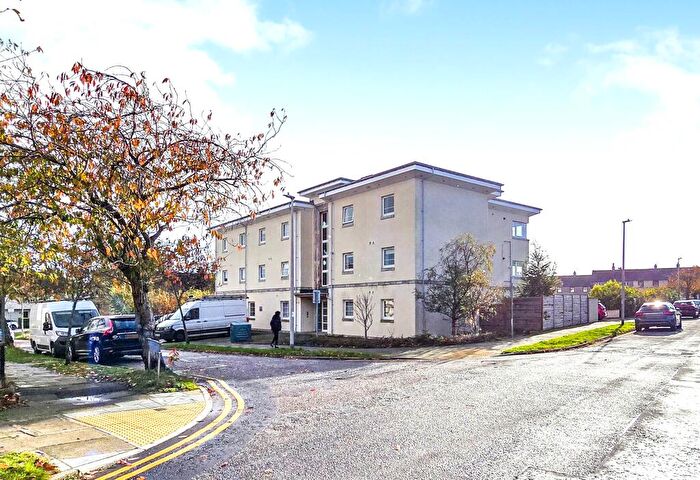
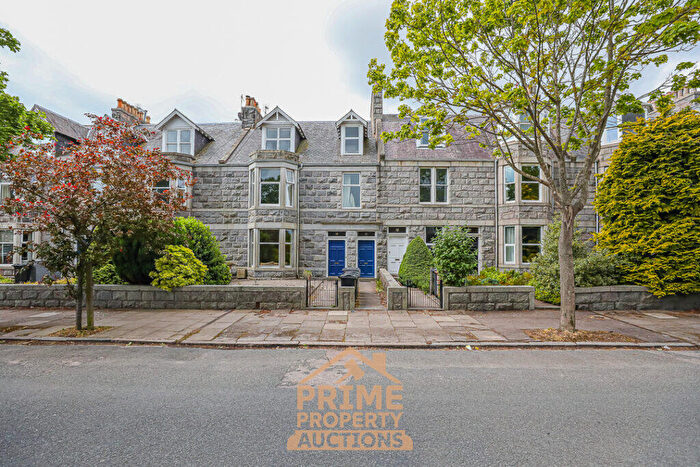
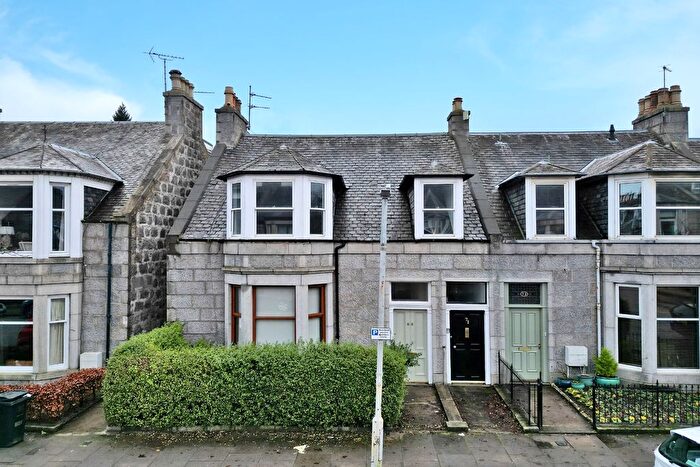
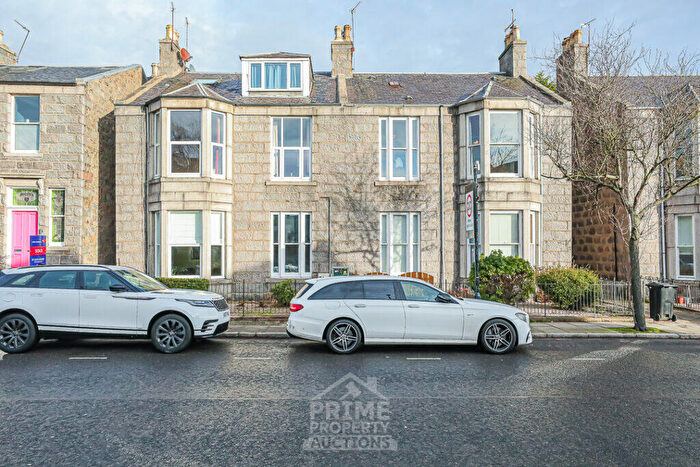
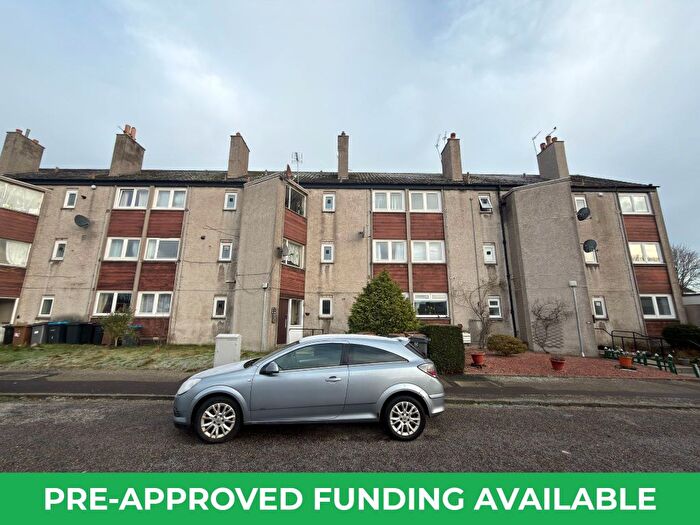
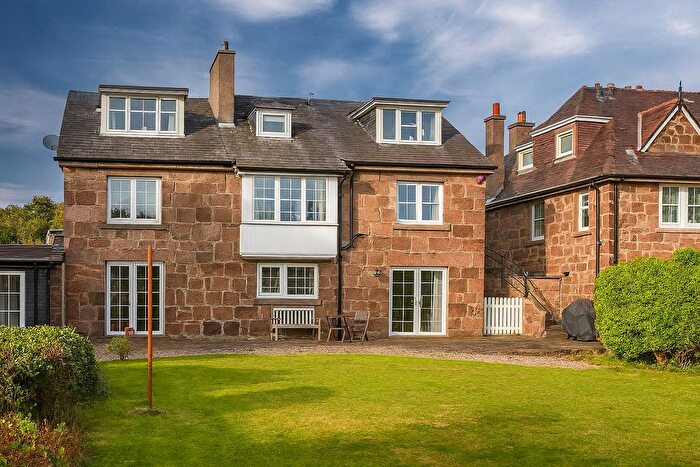
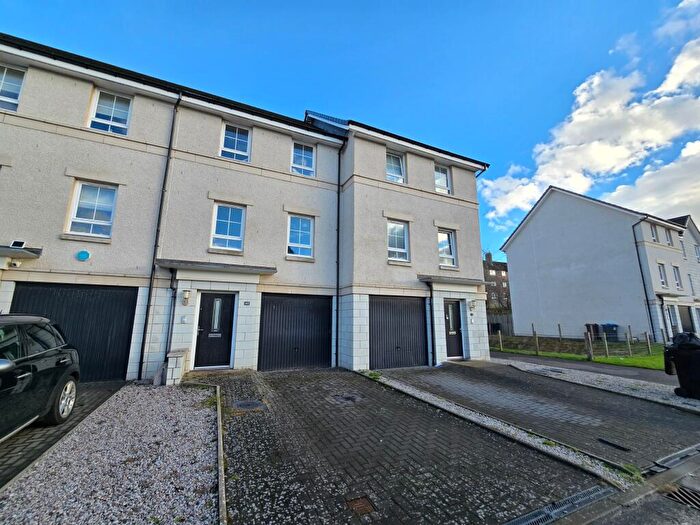
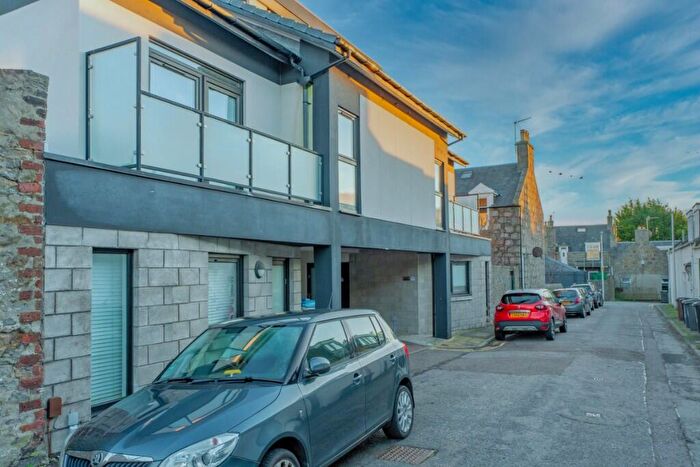
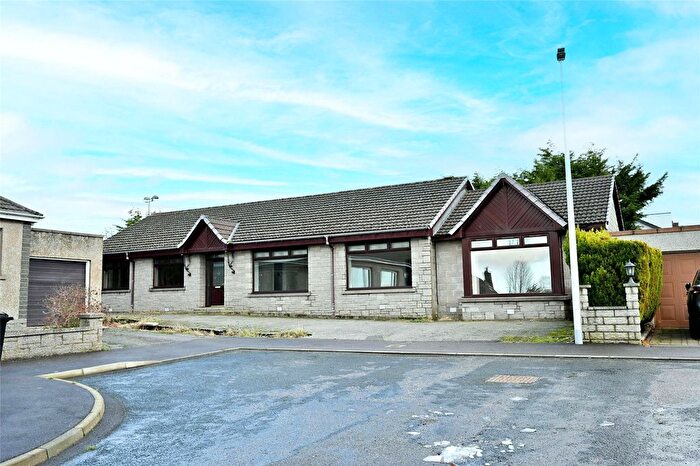
Properties for sale in Airyhall/Broomhill/Garthdee
Roads and Postcodes in Airyhall/Broomhill/Garthdee
Navigate through our locations to find the location of your next house in Airyhall/Broomhill/Garthdee, Aberdeen for sale or to rent.
Transport near Airyhall/Broomhill/Garthdee
- FAQ
- Price Paid By Year
Frequently asked questions about Airyhall/Broomhill/Garthdee
What is the average price for a property for sale in Airyhall/Broomhill/Garthdee?
The average price for a property for sale in Airyhall/Broomhill/Garthdee is £164,308. This amount is 4% higher than the average price in Aberdeen. There are 660 property listings for sale in Airyhall/Broomhill/Garthdee.
Which train stations are available in or near Airyhall/Broomhill/Garthdee?
Some of the train stations available in or near Airyhall/Broomhill/Garthdee are Aberdeen, Portlethen and Dyce.
Property Price Paid in Airyhall/Broomhill/Garthdee by Year
The average sold property price by year was:
| Year | Average Sold Price | Price Change |
Sold Properties
|
|---|---|---|---|
| 2023 | £164,308 | -14% |
62 Properties |
| 2022 | £186,819 | -9% |
338 Properties |
| 2021 | £203,234 | 10% |
341 Properties |
| 2020 | £183,283 | -3% |
235 Properties |
| 2019 | £188,768 | -9% |
269 Properties |
| 2018 | £205,995 | -2% |
292 Properties |
| 2017 | £210,940 | -6% |
285 Properties |
| 2016 | £224,477 | -17% |
273 Properties |
| 2015 | £263,501 | 0,2% |
379 Properties |
| 2014 | £263,025 | 10% |
406 Properties |
| 2013 | £237,520 | 11% |
455 Properties |
| 2012 | £212,548 | 2% |
355 Properties |
| 2011 | £207,649 | 1% |
329 Properties |
| 2010 | £206,527 | 9% |
320 Properties |
| 2009 | £187,347 | -1% |
344 Properties |
| 2008 | £188,302 | -9% |
380 Properties |
| 2007 | £205,776 | 25% |
471 Properties |
| 2006 | £154,143 | 21% |
508 Properties |
| 2005 | £121,786 | -2% |
608 Properties |
| 2004 | £124,145 | 25% |
536 Properties |
| 2003 | £93,559 | 17% |
495 Properties |
| 2002 | £77,587 | -46% |
568 Properties |
| 2001 | £112,943 | - |
46 Properties |

