
Houses for sale & to rent in West Garioch, Insch
House Prices in West Garioch
Properties in West Garioch have an average house price of £237k and had 77 Property Transactions within the last 3 years¹.
West Garioch is an area in Insch, Aberdeenshire with 1,864 households², where the most expensive property was sold for £625k.
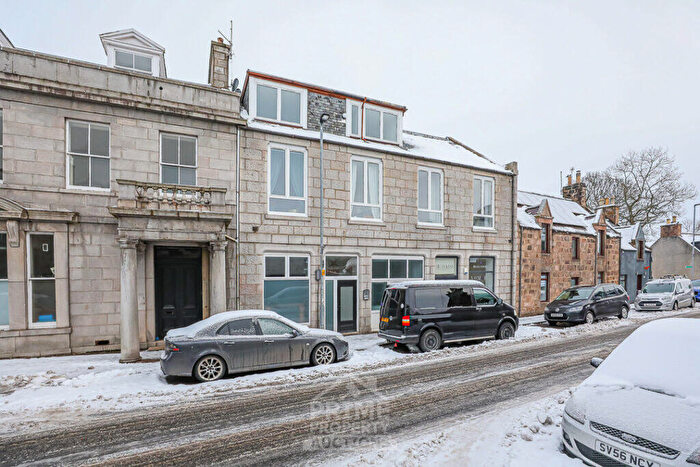
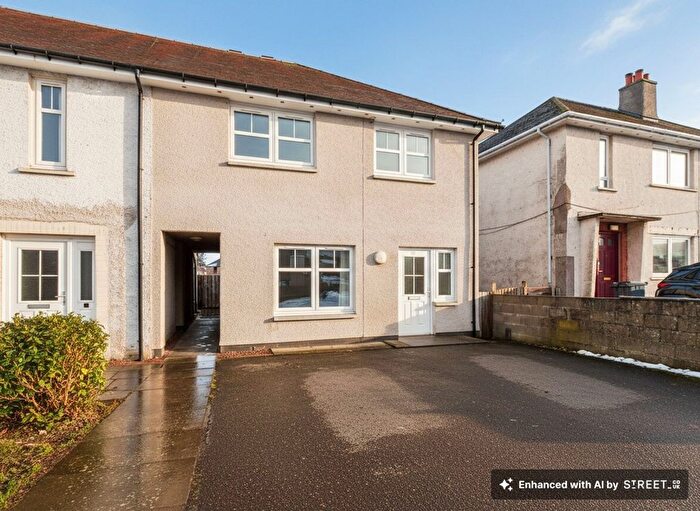
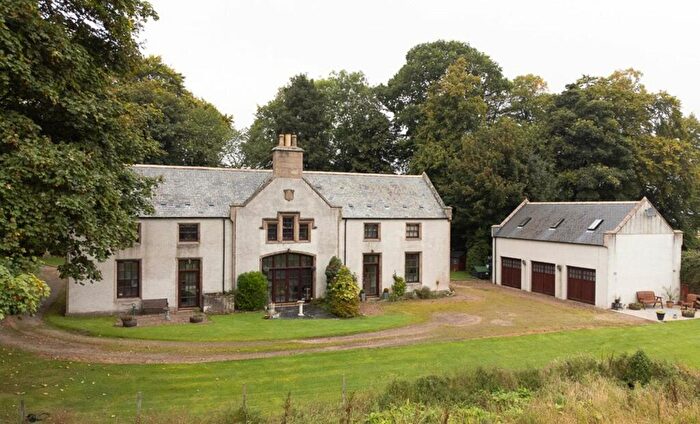
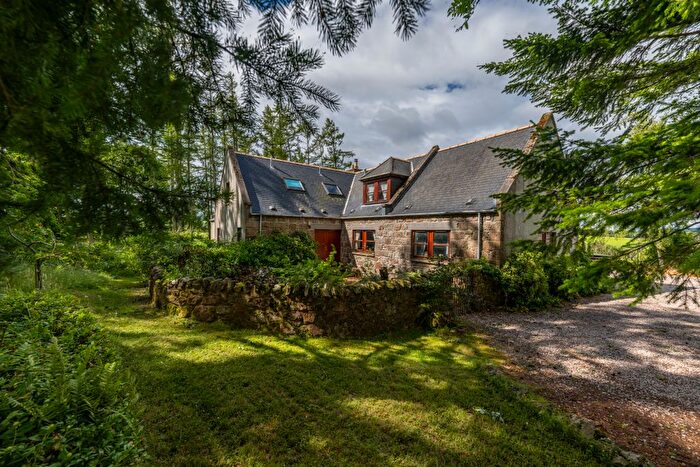
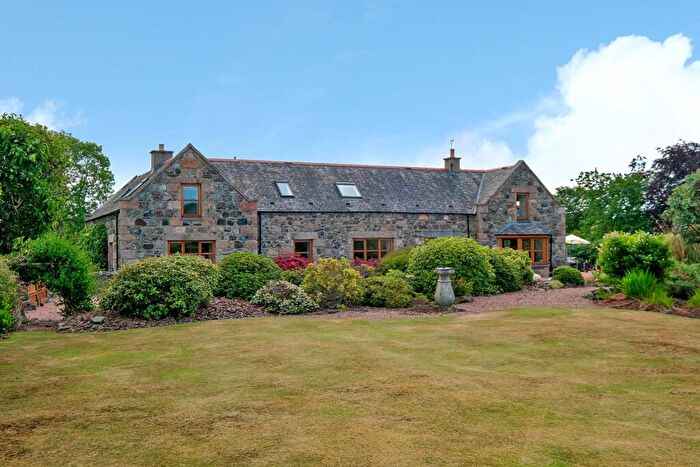
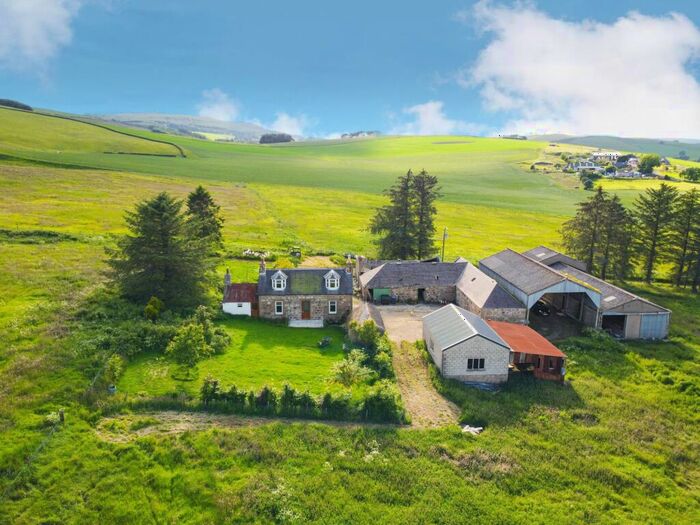
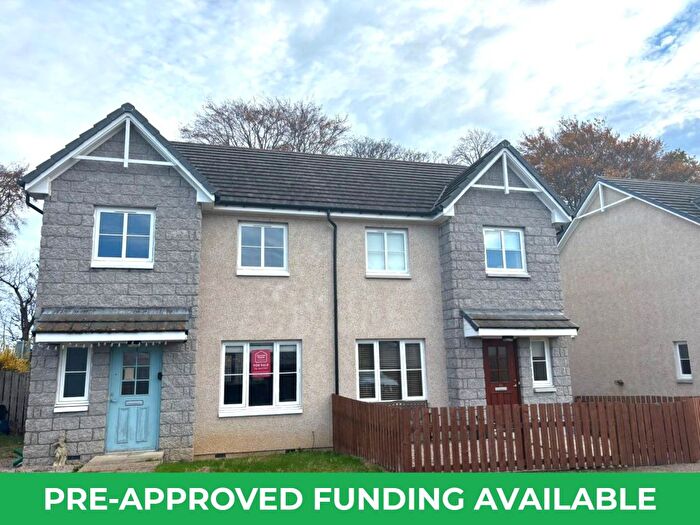
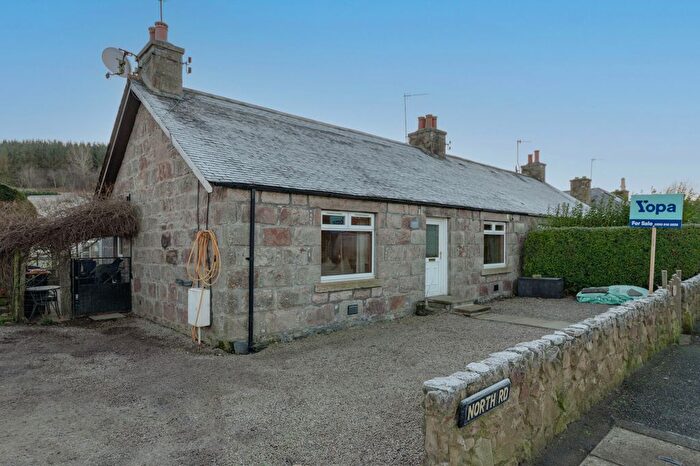
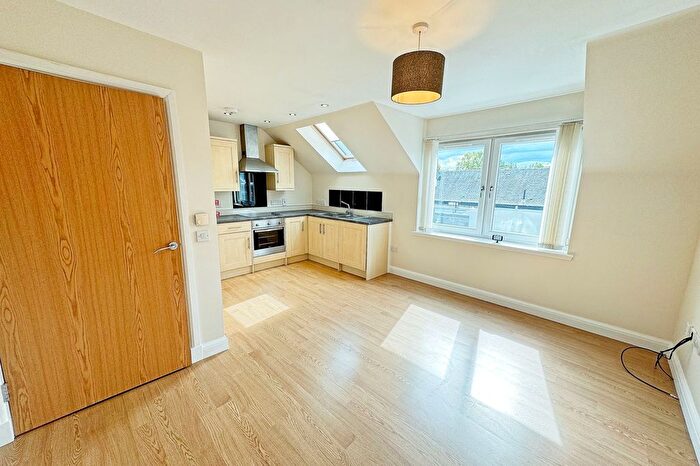
Properties for sale in West Garioch
![]()
If you are looking to sell your house, let it out, or receive a property valuation, an expert can help you.
Click the button below to get started.


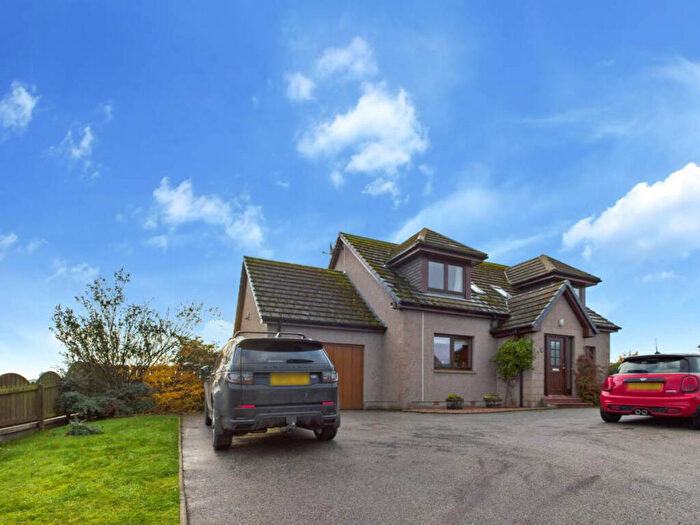
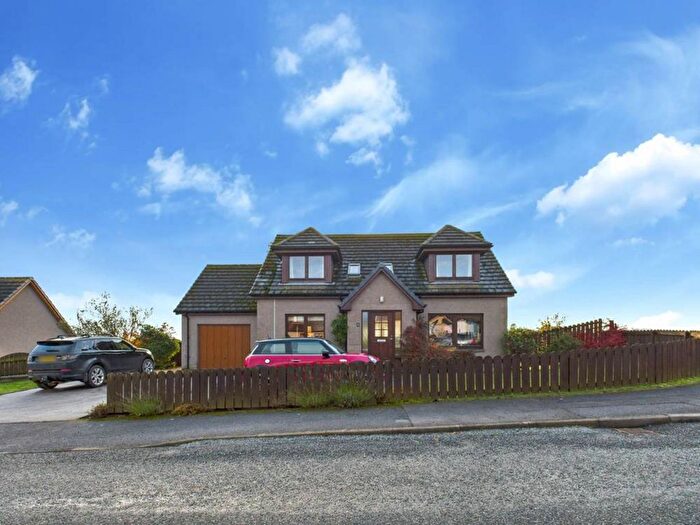
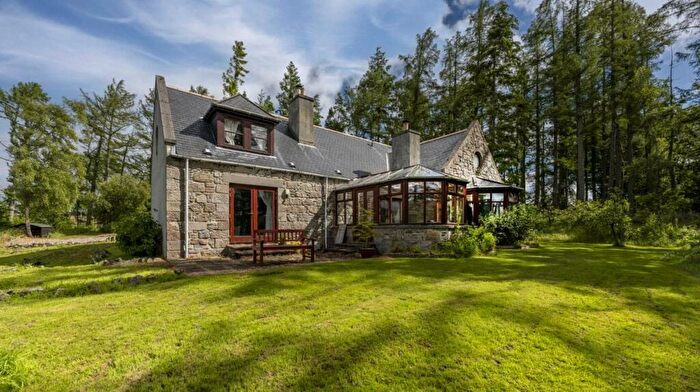
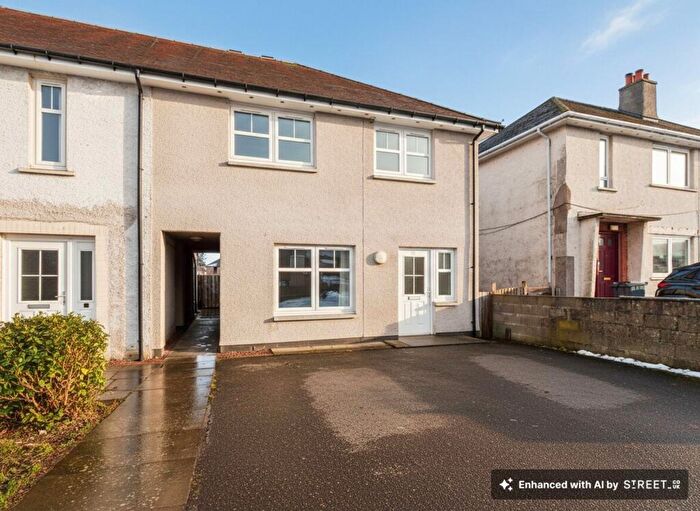
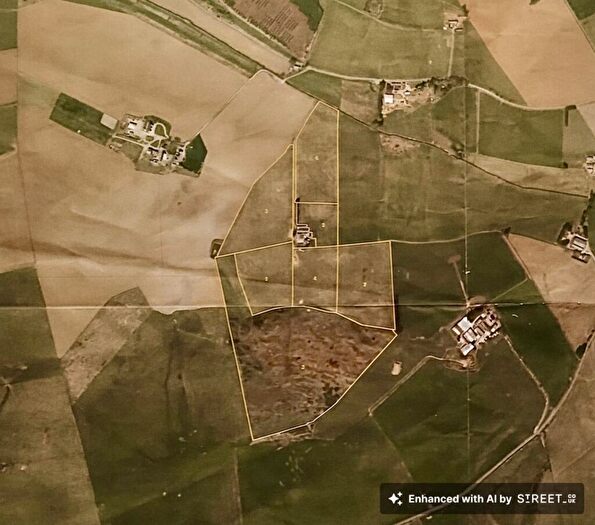
Previously listed properties in West Garioch
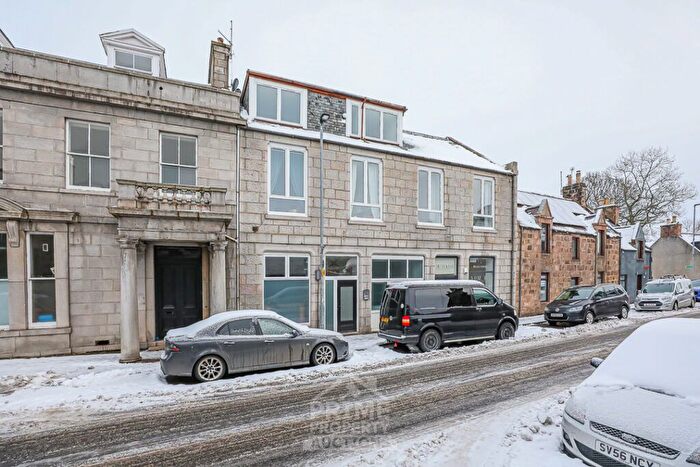
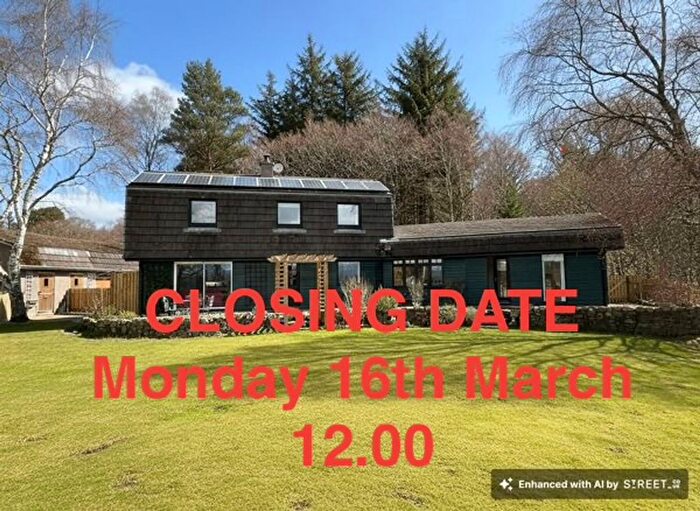
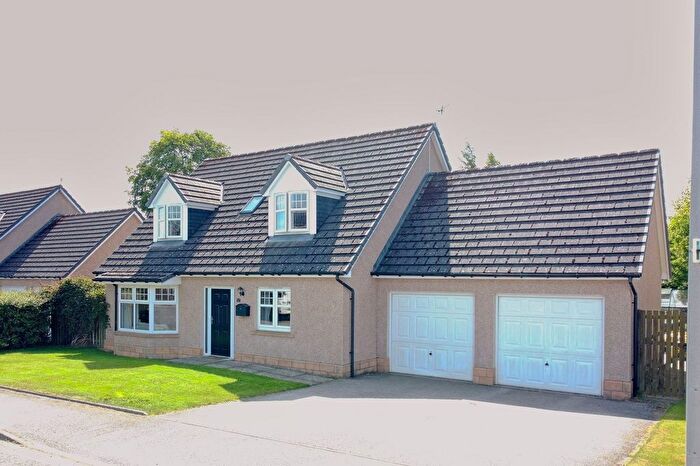
![]()
If you are looking to sell your house, let it out, or receive a property valuation, an expert can help you.
Click the button below to get started.
Roads and Postcodes in West Garioch
Navigate through our locations to find the location of your next house in West Garioch, Insch for sale or to rent.
Transport near West Garioch

- FAQ
- Price Paid By Year
Frequently asked questions about West Garioch
What is the average price for a property for sale in West Garioch?
The average price for a property for sale in West Garioch is £237,125. This amount is 2% lower than the average price in Insch. There are 219 property listings for sale in West Garioch.
What streets have the most expensive properties for sale in West Garioch?
The streets with the most expensive properties for sale in West Garioch are North Road at an average of £400,000, Berryhill Park at an average of £380,000 and Leslie Park at an average of £369,250.
What streets have the most affordable properties for sale in West Garioch?
The streets with the most affordable properties for sale in West Garioch are Martin Road at an average of £75,000, Commerce Street at an average of £114,500 and Rothney Gardens at an average of £122,166.
Which train stations are available in or near West Garioch?
Some of the train stations available in or near West Garioch are Insch, Inverurie and Huntly.
Property Price Paid in West Garioch by Year
The average sold property price by year was:
| Year | Average Sold Price | Price Change |
Sold Properties
|
|---|---|---|---|
| 2025 | £242,498 | 9% |
29 Properties |
| 2024 | £221,369 | -10% |
20 Properties |
| 2023 | £242,814 | -3% |
28 Properties |
| 2022 | £250,447 | 6% |
68 Properties |
| 2021 | £235,185 | 8% |
86 Properties |
| 2020 | £216,274 | -4% |
69 Properties |
| 2019 | £225,305 | 2% |
78 Properties |
| 2018 | £220,972 | -2% |
91 Properties |
| 2017 | £224,948 | 4% |
79 Properties |
| 2016 | £216,493 | -11% |
88 Properties |
| 2015 | £240,598 | 6% |
126 Properties |
| 2014 | £225,339 | 7% |
145 Properties |
| 2013 | £210,413 | 1% |
165 Properties |
| 2012 | £207,782 | -1% |
126 Properties |
| 2011 | £209,274 | -8% |
80 Properties |
| 2010 | £225,351 | 11% |
106 Properties |
| 2009 | £199,529 | -8% |
95 Properties |
| 2008 | £215,005 | 9% |
95 Properties |
| 2007 | £196,015 | -9% |
97 Properties |
| 2006 | £214,286 | 29% |
89 Properties |
| 2005 | £152,654 | 26% |
103 Properties |
| 2004 | £113,523 | 23% |
94 Properties |
| 2003 | £87,095 | -9% |
96 Properties |
| 2002 | £94,916 | 31% |
93 Properties |
| 2001 | £65,216 | - |
10 Properties |