
Houses for sale in Aberdeenshire, Scotland
House Prices in Aberdeenshire
Properties in Aberdeenshire have
an average house price of
£200k
and had 5,428 Property Transactions
within the last 3 years.¹
Aberdeenshire is a location in
Scotland with
104,567 households², where the most expensive property was sold for £1.15M.
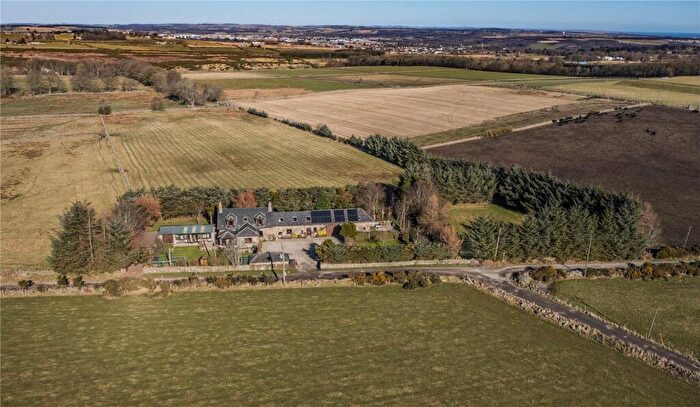
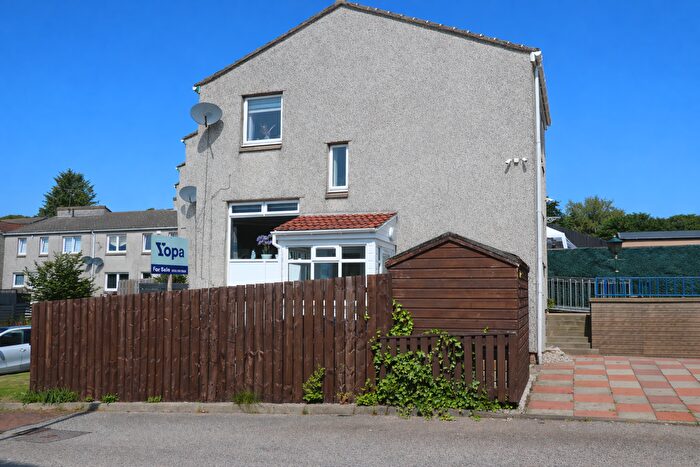
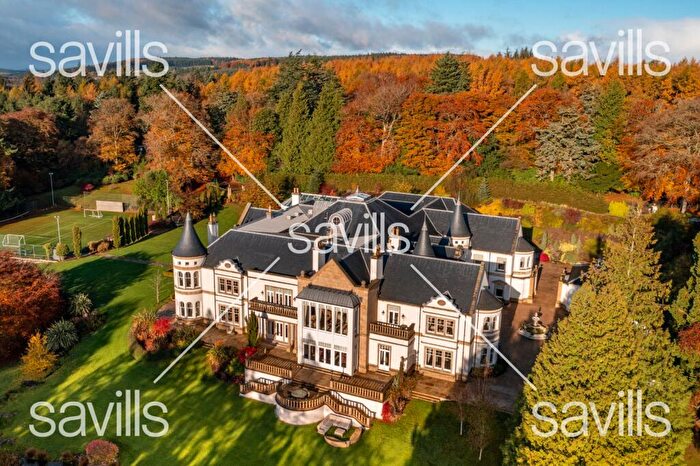
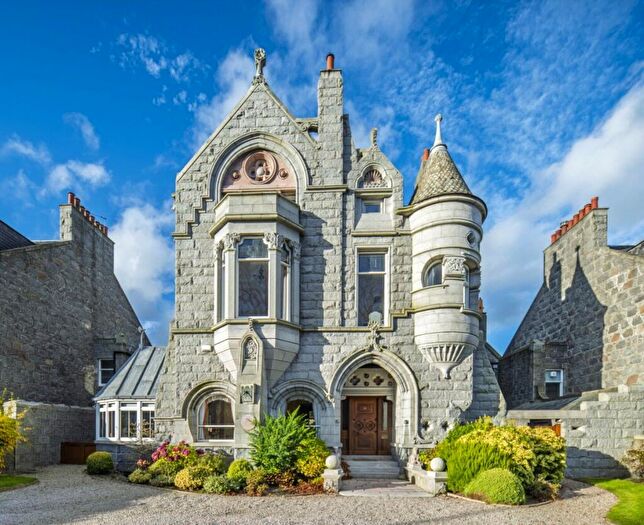
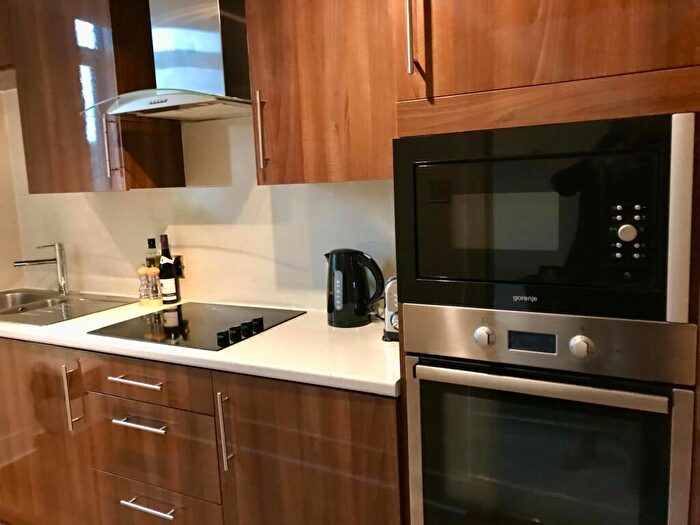
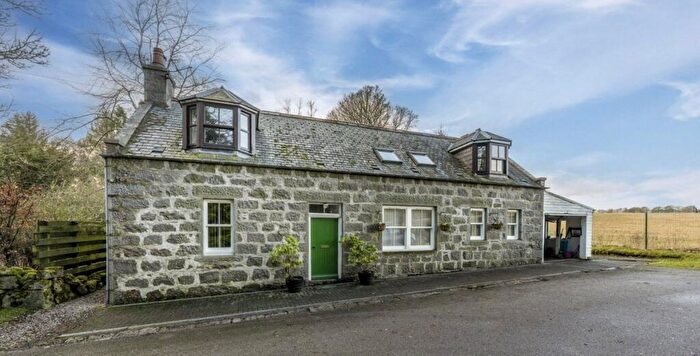
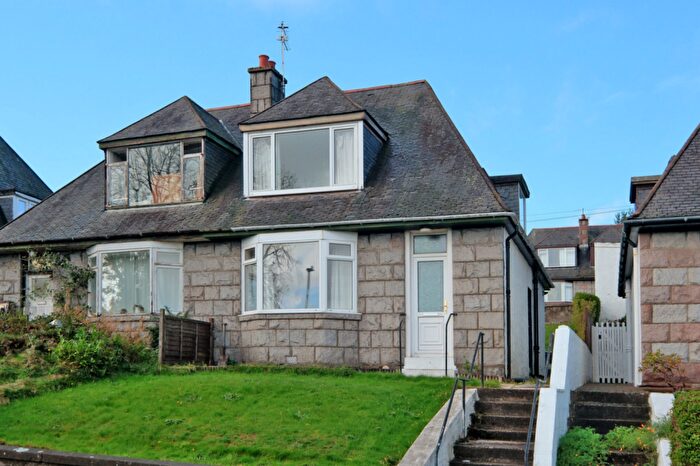
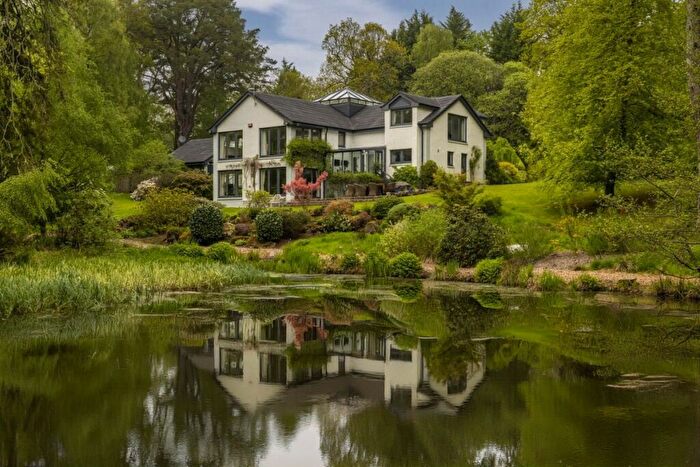
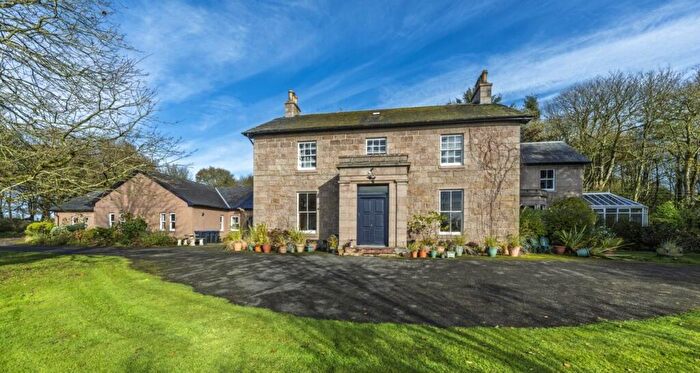
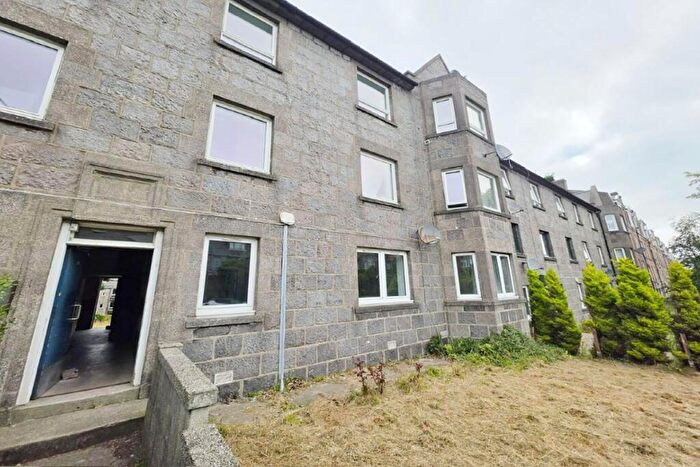
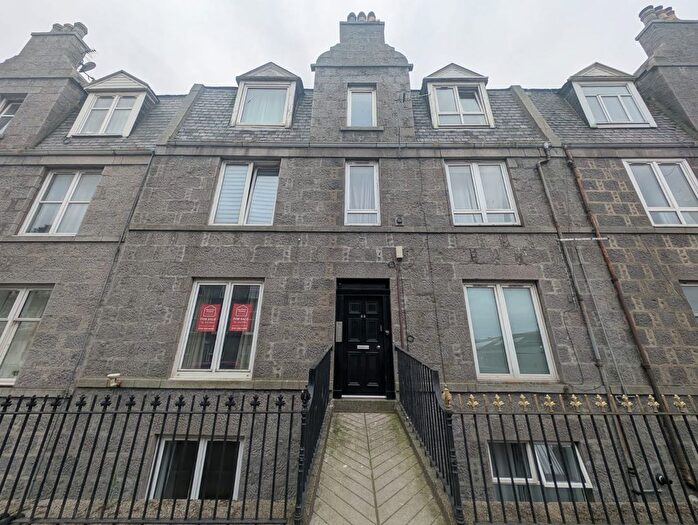
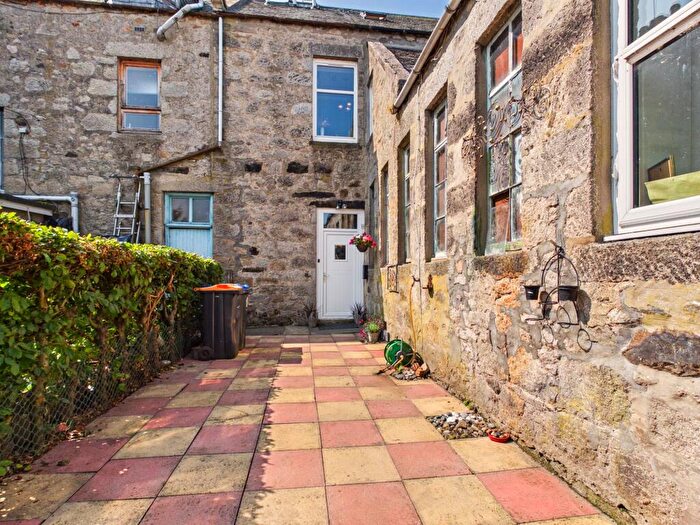
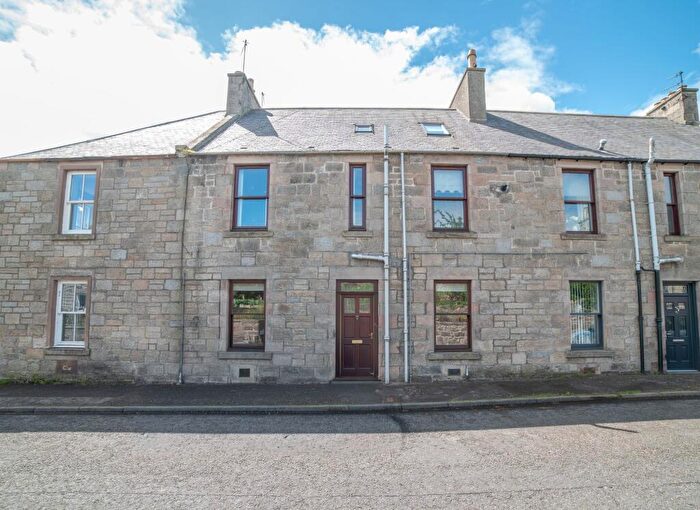
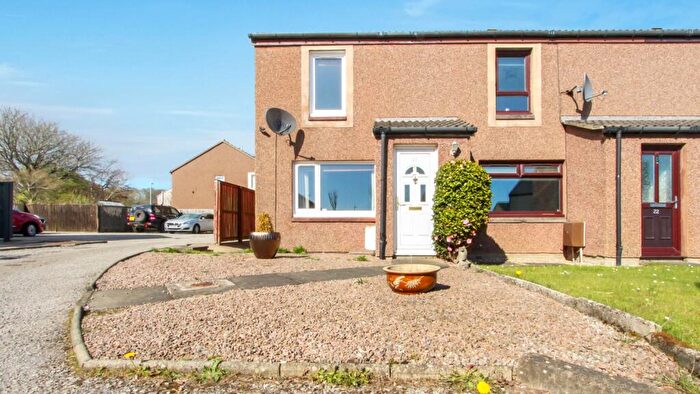
Properties for sale in Aberdeenshire
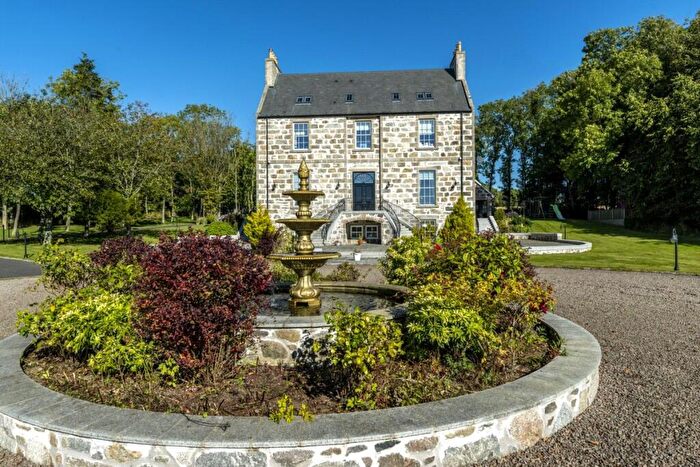

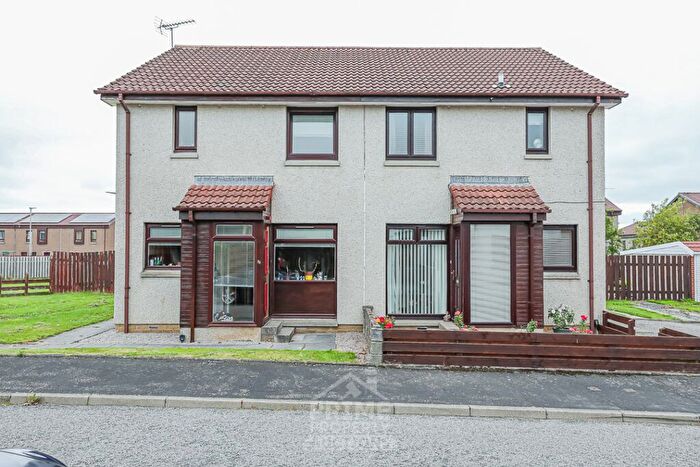
![]()
If you are looking to sell your house, let it out, or receive a property valuation, an expert can help you.
Click the button below to get started.

Towns in Aberdeenshire
Navigate through our locations to find the location of your next house in Aberdeenshire, Scotland for sale or to rent.
Property price trends in Aberdeenshire
According to the latest Registers of Scotland data, the average home in Aberdeenshire sold for £190,007 in 2026. That figure comes from a substantial record of 108,893 sales logged over the past 26 years.
Prices have fallen back over the last three years. Compared with 2023, when the typical sale came in around £204,742, that's a fall of roughly 7.2%.
Looking back five years, average prices are down about 14.2% since 2021, a drop of around £31,513 in cash terms.
Zoom out to the past decade for the fuller picture. Back in 2016, homes here averaged £212,375, so the typical sold price has fallen about 10.5% since then, around 1.1% a year lower. Stretch the view to fifteen years and that annual pace edges up closer to -0.6%.
Frequently asked questions about Aberdeenshire
What is the average price for a property for sale in Aberdeenshire?
The average price for a property for sale in Aberdeenshire is £200,416. This amount is 0.57% lower than the average price in Scotland. There are more than 10,000 property listings for sale in Aberdeenshire.
What locations have the most expensive properties for sale in Aberdeenshire?
The locations with the most expensive properties for sale in Aberdeenshire are Strathdon at an average of £370,502, Ballater at an average of £331,818 and Aboyne at an average of £311,769.
What locations have the most affordable properties for sale in Aberdeenshire?
The locations with the most affordable properties for sale in Aberdeenshire are Macduff at an average of £131,323, Brechin at an average of £133,433 and Fraserburgh at an average of £138,390.
Which train stations are available in or near Aberdeenshire?
Some of the train stations available in or near Aberdeenshire are Inverurie, Dyce and Insch.
Property Price Paid in Aberdeenshire by Year
The average sold property price by year was:
| Year | Average Sold Price | Price Change |
Sold Properties
|
|---|---|---|---|
| 2026 | £190,007 | -2% |
309 Properties |
| 2025 | £194,047 | -5% |
1,761 Properties |
| 2024 | £204,681 | - |
1,568 Properties |
| 2023 | £204,742 | -10% |
1,790 Properties |
| 2022 | £226,212 | 2% |
4,487 Properties |
| 2021 | £221,520 | 4% |
5,540 Properties |
| 2020 | £212,019 | 1% |
3,597 Properties |
| 2019 | £210,387 | -2% |
4,100 Properties |
| 2018 | £214,041 | 1% |
4,048 Properties |
| 2017 | £211,519 | -0,4% |
4,248 Properties |
Transport in Aberdeenshire
Please see below transportation links in this area:
