
Houses for sale & to rent in Central Buchan, Peterhead
House Prices in Central Buchan
Properties in Central Buchan have an average house price of £176k and had 174 Property Transactions within the last 3 years¹.
Central Buchan is an area in Peterhead, Aberdeenshire with 3,527 households², where the most expensive property was sold for £405k.
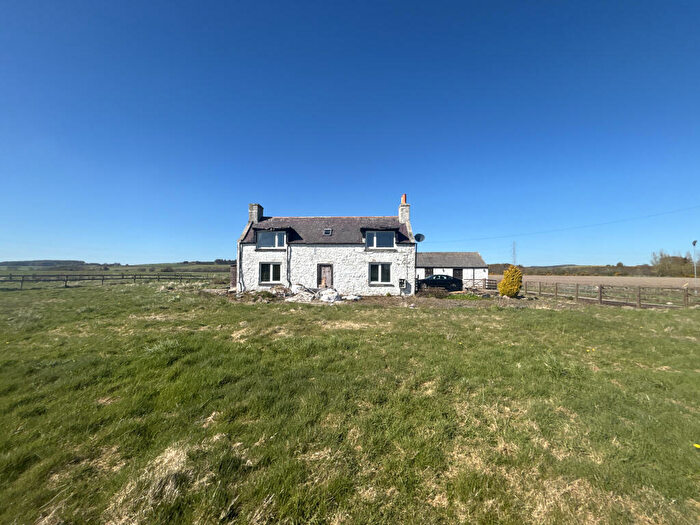
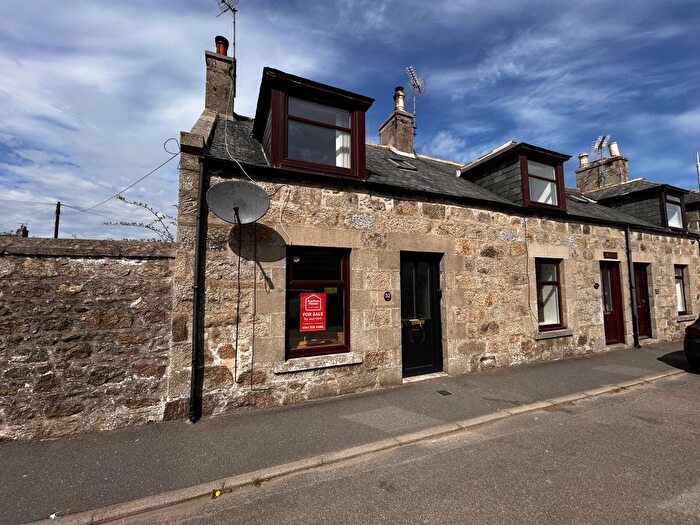
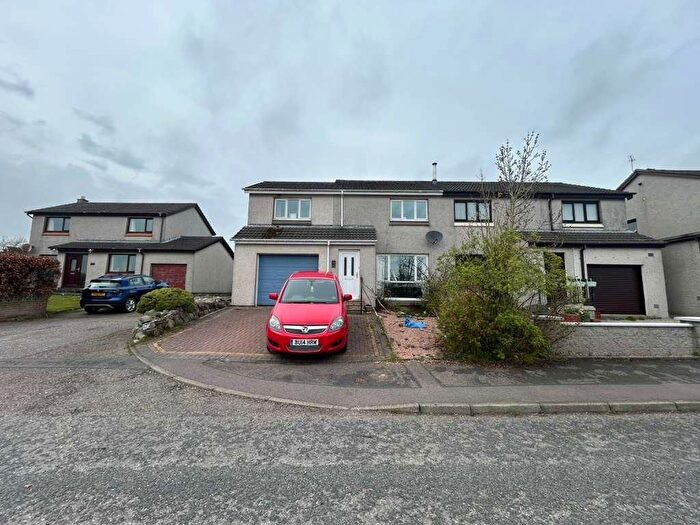
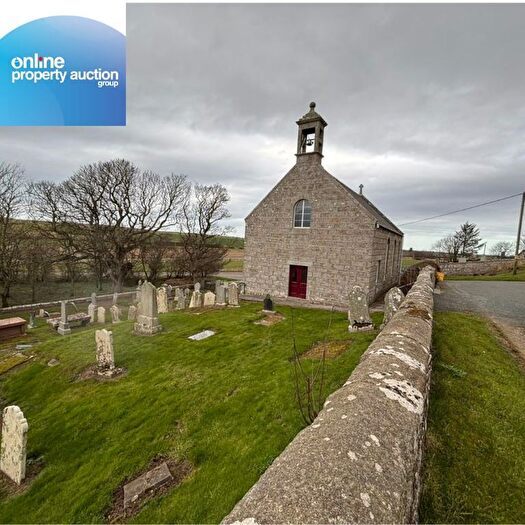
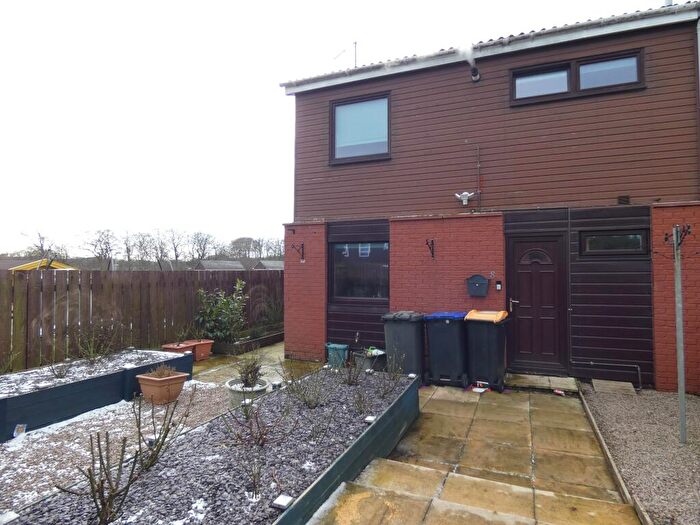
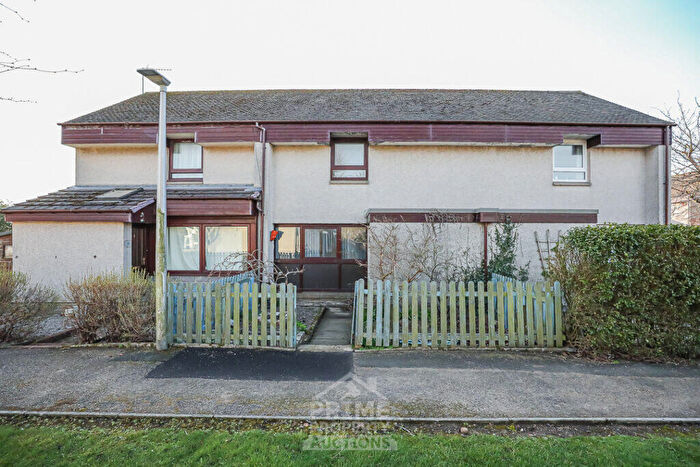
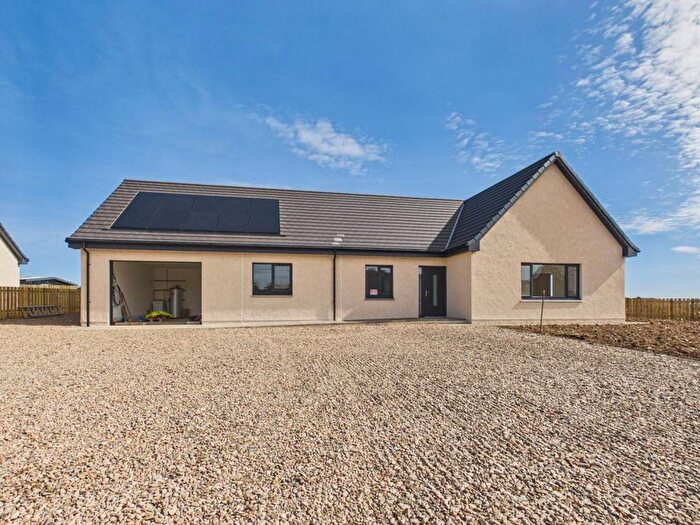
Properties for sale in Central Buchan
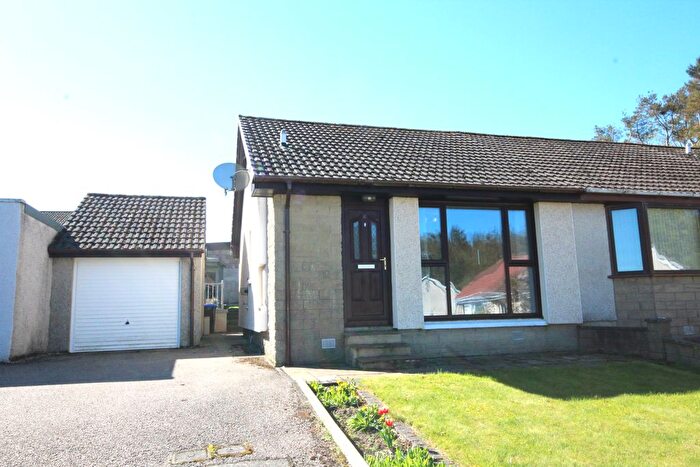
![]()
If you are looking to sell your house, let it out, or receive a property valuation, an expert can help you.
Click the button below to get started.

Roads and Postcodes in Central Buchan
Navigate through our locations to find the location of your next house in Central Buchan, Peterhead for sale or to rent.
Transport near Central Buchan

- FAQ
- Price Paid By Year
Frequently asked questions about Central Buchan
What is the average price for a property for sale in Central Buchan?
The average price for a property for sale in Central Buchan is £175,638. This amount is 20% higher than the average price in Peterhead. There are 523 property listings for sale in Central Buchan.
What streets have the most expensive properties for sale in Central Buchan?
The streets with the most expensive properties for sale in Central Buchan are Keplahill at an average of £330,000, Cedars Way at an average of £293,398 and Parkside Crescent at an average of £285,414.
What streets have the most affordable properties for sale in Central Buchan?
The streets with the most affordable properties for sale in Central Buchan are Mill Street at an average of £62,500, North Place at an average of £66,000 and Tullochgorum Gardens at an average of £74,125.
Which train stations are available in or near Central Buchan?
Some of the train stations available in or near Central Buchan are Inverurie, Dyce and Insch.
Property Price Paid in Central Buchan by Year
The average sold property price by year was:
| Year | Average Sold Price | Price Change |
Sold Properties
|
|---|---|---|---|
| 2025 | £170,914 | -7% |
53 Properties |
| 2024 | £182,100 | 4% |
53 Properties |
| 2023 | £174,284 | -23% |
68 Properties |
| 2022 | £213,626 | 2% |
168 Properties |
| 2021 | £209,818 | 5% |
218 Properties |
| 2020 | £198,553 | 13% |
142 Properties |
| 2019 | £171,971 | -4% |
136 Properties |
| 2018 | £179,570 | -5% |
132 Properties |
| 2017 | £188,512 | -3% |
168 Properties |
| 2016 | £193,251 | -3% |
187 Properties |
| 2015 | £199,114 | 6% |
210 Properties |
| 2014 | £187,991 | 13% |
221 Properties |
| 2013 | £164,456 | -13% |
155 Properties |
| 2012 | £185,574 | 13% |
145 Properties |
| 2011 | £161,207 | 5% |
131 Properties |
| 2010 | £152,852 | -8% |
121 Properties |
| 2009 | £164,716 | 2% |
140 Properties |
| 2008 | £161,634 | 2% |
153 Properties |
| 2007 | £158,027 | 28% |
169 Properties |
| 2006 | £113,948 | - |
157 Properties |
| 2005 | £113,940 | 24% |
157 Properties |
| 2004 | £86,501 | 20% |
155 Properties |
| 2003 | £69,419 | 12% |
182 Properties |
| 2002 | £60,895 | 8% |
235 Properties |
| 2001 | £56,287 | - |
8 Properties |