
Houses for sale & to rent in Arbroath East and Lunan, Arbroath
House Prices in Arbroath East and Lunan
Properties in Arbroath East and Lunan have an average house price of £138,434.00 and had 257 Property Transactions within the last 3 years¹.
Arbroath East and Lunan is an area in Arbroath, Angus with 6,288 households², where the most expensive property was sold for £548,000.00.
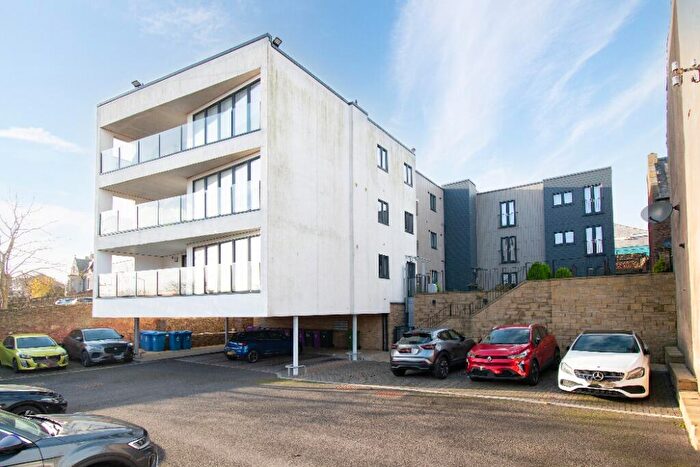
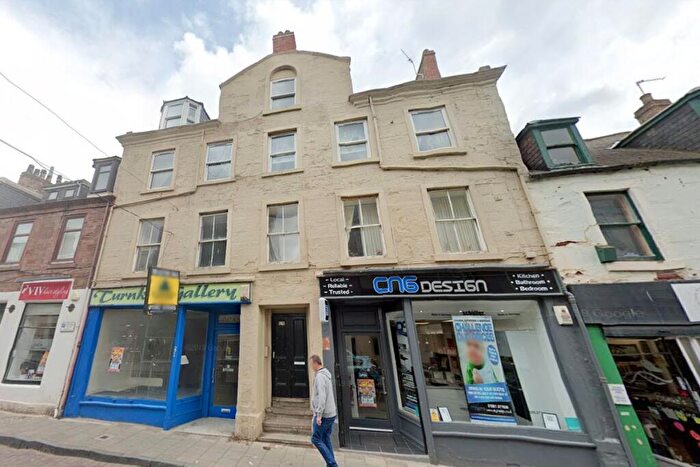
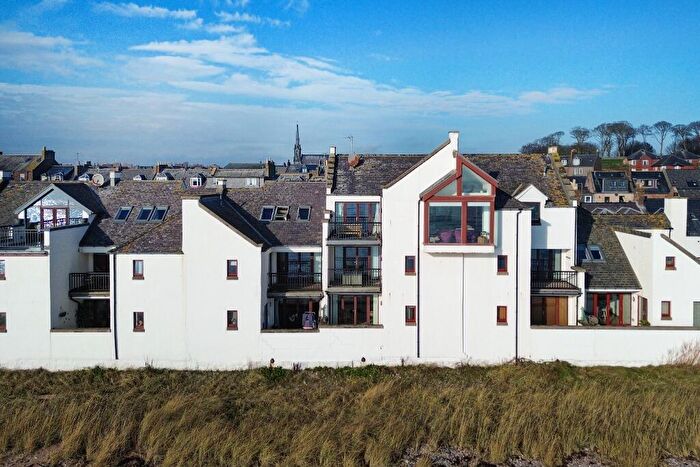
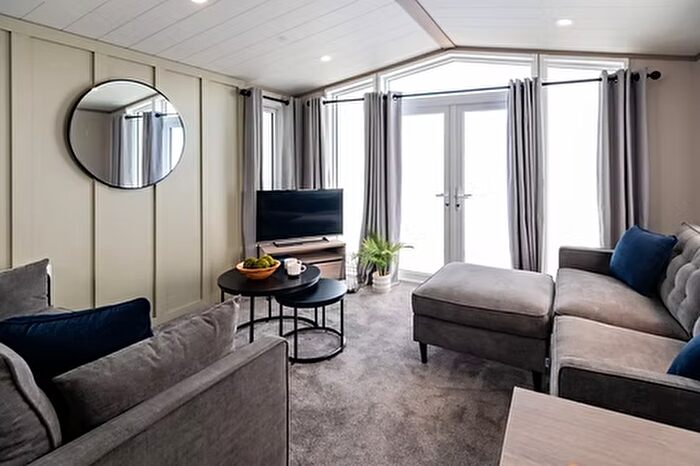
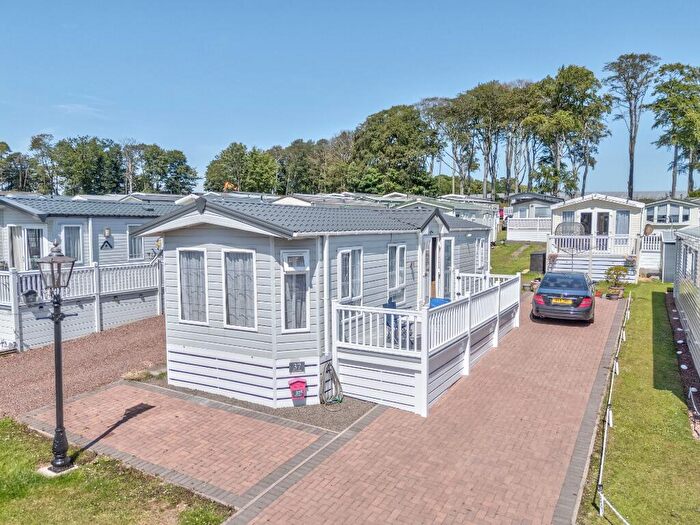
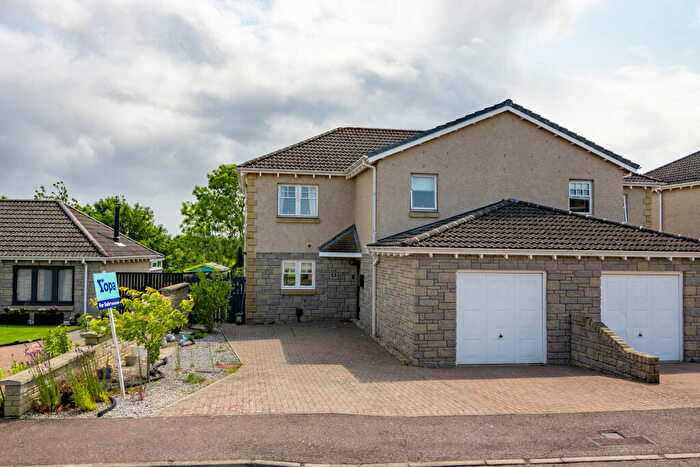
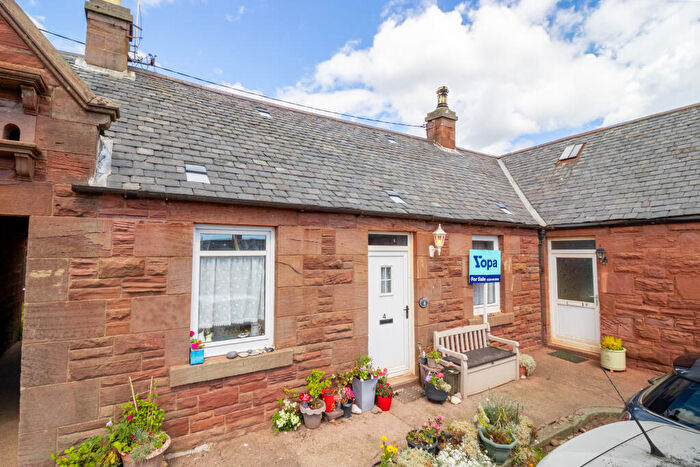
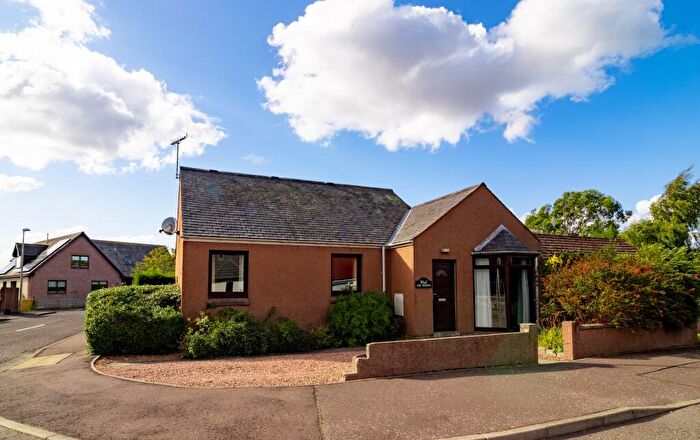
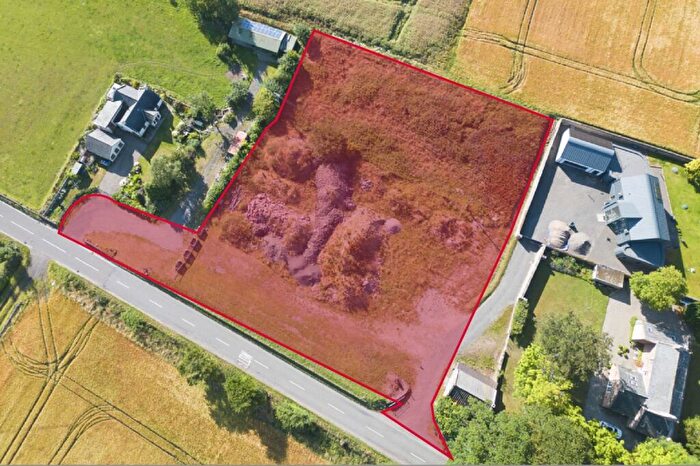
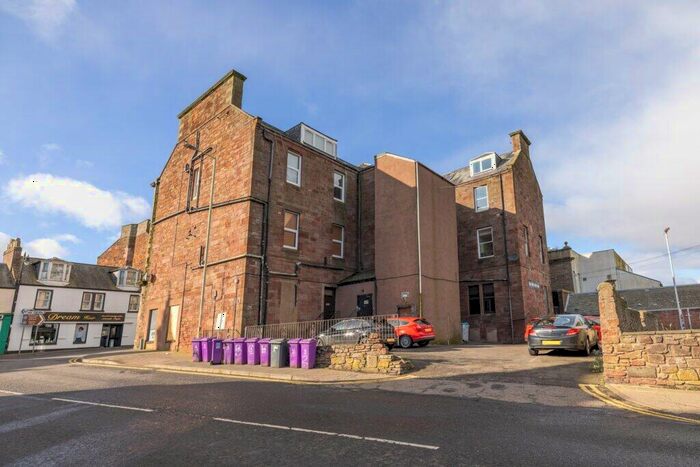
Properties for sale in Arbroath East and Lunan

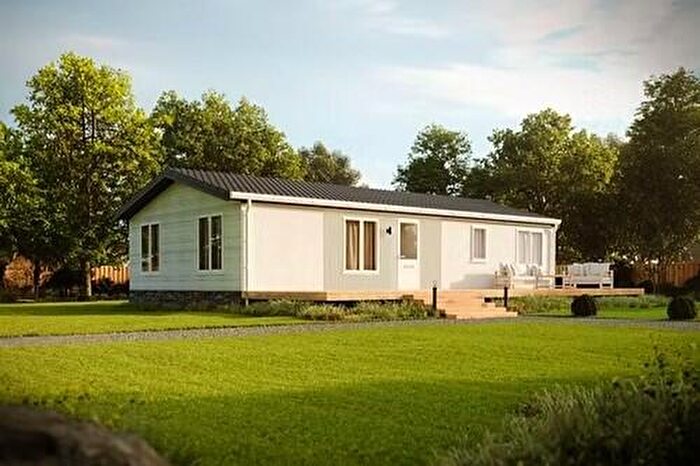
![]()
If you are looking to sell your house, let it out, or receive a property valuation, an expert can help you.
Click the button below to get started.


Roads and Postcodes in Arbroath East and Lunan
Navigate through our locations to find the location of your next house in Arbroath East and Lunan, Arbroath for sale or to rent.
Transport near Arbroath East and Lunan

- FAQ
- Price Paid By Year
Frequently asked questions about Arbroath East and Lunan
What is the average price for a property for sale in Arbroath East and Lunan?
The average price for a property for sale in Arbroath East and Lunan is £138,434. This amount is 17% lower than the average price in Arbroath. There are 726 property listings for sale in Arbroath East and Lunan.
Which train stations are available in or near Arbroath East and Lunan?
Some of the train stations available in or near Arbroath East and Lunan are Arbroath, Carnoustie and Golf Street.
Property Price Paid in Arbroath East and Lunan by Year
The average sold property price by year was:
| Year | Average Sold Price | Price Change |
Sold Properties
|
|---|---|---|---|
| 2023 | £131,261 | -6% |
39 Properties |
| 2022 | £139,717 | 3% |
218 Properties |
| 2021 | £135,100 | 8% |
271 Properties |
| 2020 | £124,469 | -1% |
188 Properties |
| 2019 | £126,303 | -0,5% |
226 Properties |
| 2018 | £126,891 | 2% |
187 Properties |
| 2017 | £124,200 | -1% |
205 Properties |
| 2016 | £125,696 | 7% |
202 Properties |
| 2015 | £116,778 | -5% |
188 Properties |
| 2014 | £122,140 | -10% |
214 Properties |
| 2013 | £134,905 | 16% |
189 Properties |
| 2012 | £112,862 | 13% |
141 Properties |
| 2011 | £97,855 | -15% |
143 Properties |
| 2010 | £112,062 | 15% |
173 Properties |
| 2009 | £95,446 | -0,3% |
143 Properties |
| 2008 | £95,700 | -34% |
203 Properties |
| 2007 | £128,165 | 21% |
276 Properties |
| 2006 | £101,852 | 26% |
281 Properties |
| 2005 | £75,106 | 1% |
345 Properties |
| 2004 | £74,330 | 23% |
269 Properties |
| 2003 | £57,088 | 23% |
286 Properties |
| 2002 | £43,709 | -2% |
296 Properties |
| 2001 | £44,544 | - |
19 Properties |