
Houses for sale & to rent in Angus, Scotland
House Prices in Angus
Properties in Angus have
an average house price of
£171k
and had 2,931 Property Transactions
within the last 3 years.¹
Angus is a location in
Scotland with
51,492 households², where the most expensive property was sold for £825k.
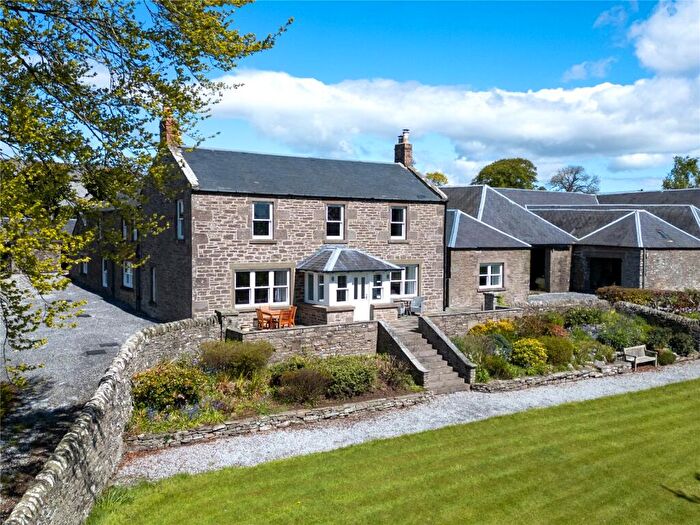
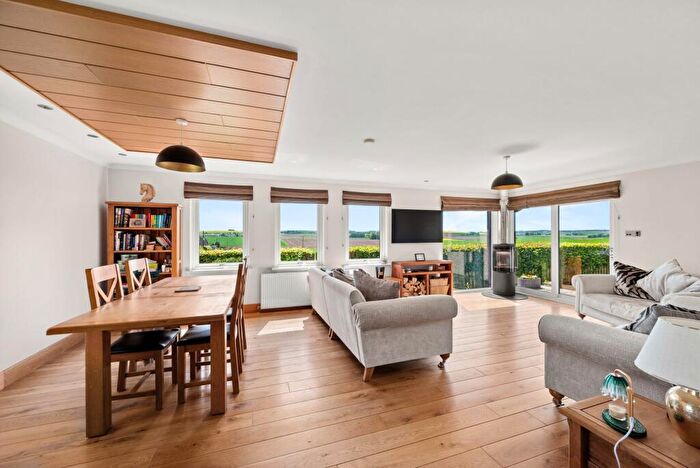
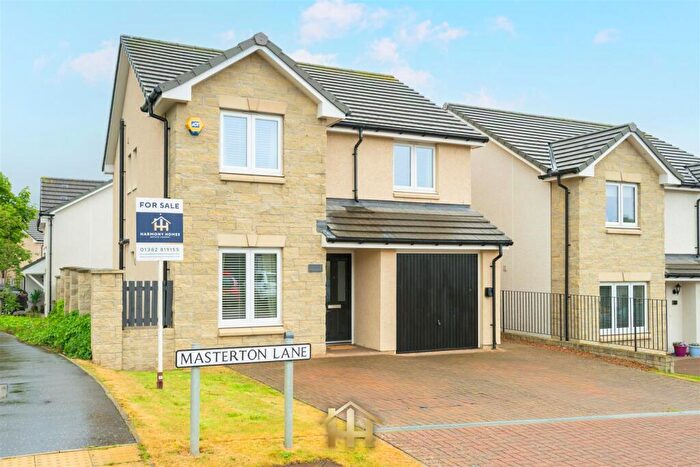
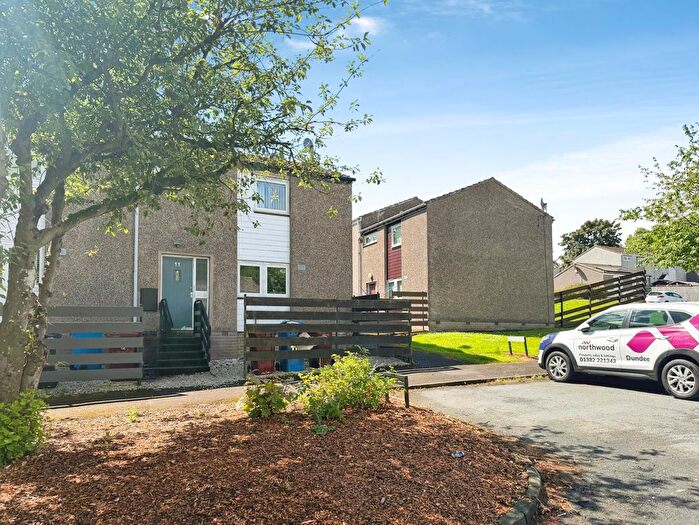
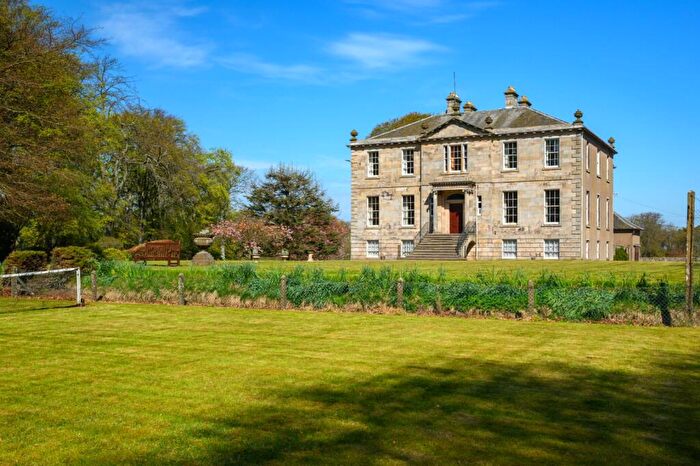
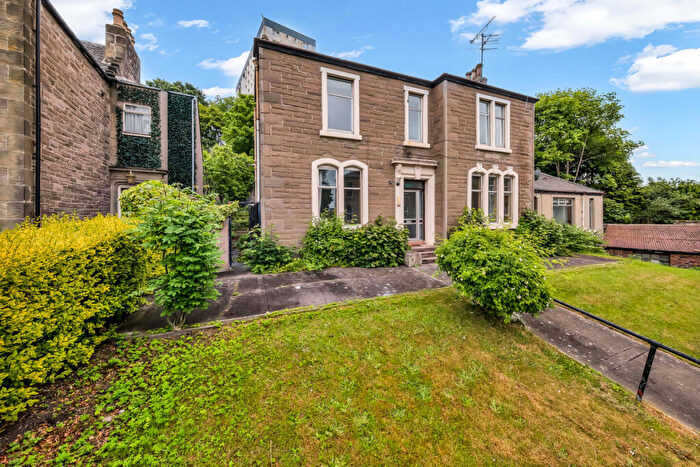
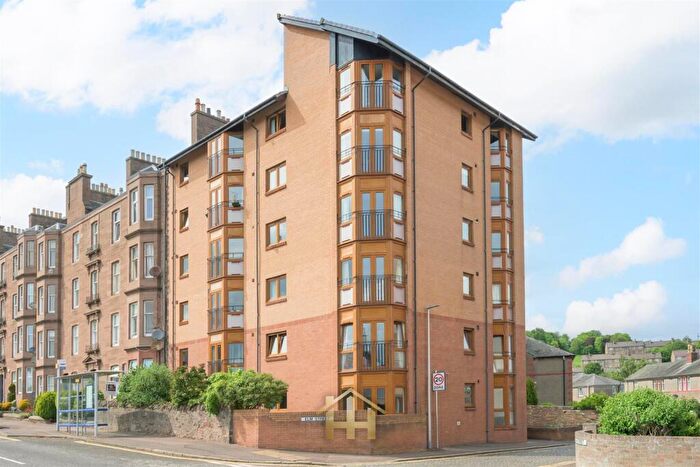
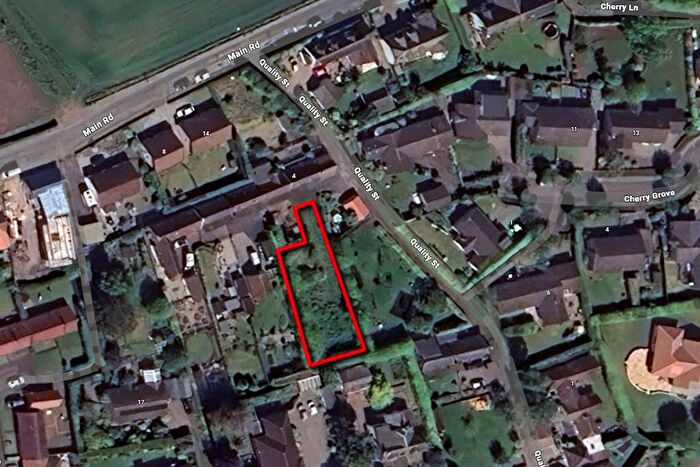
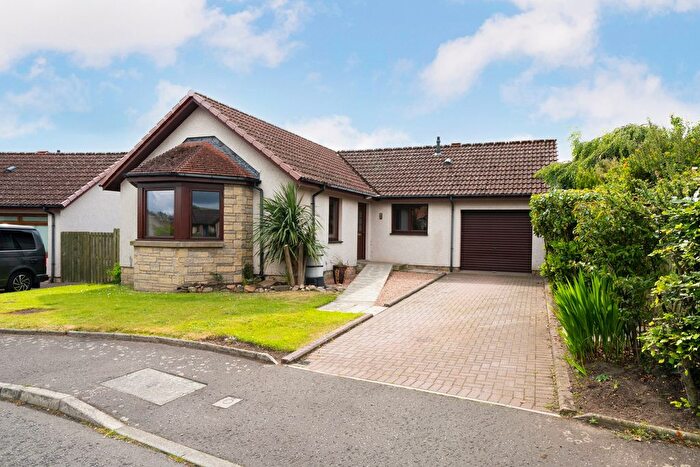
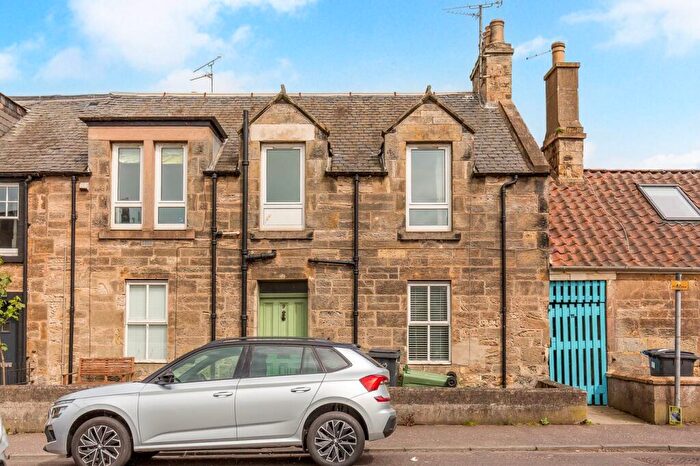
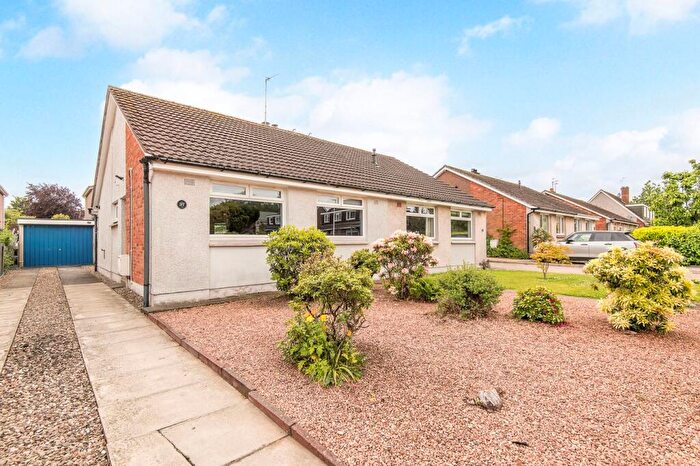
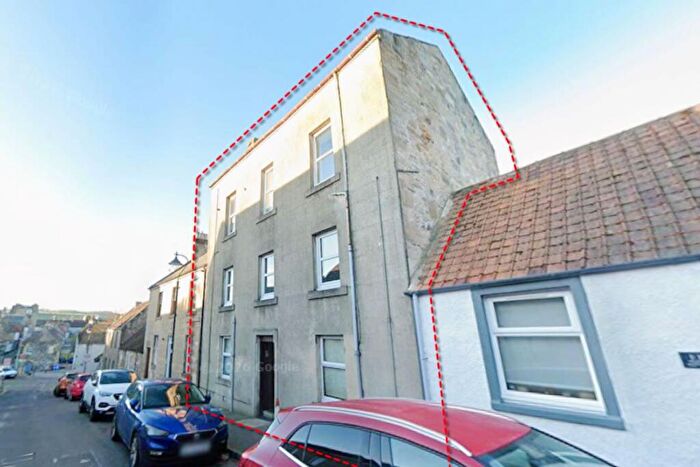
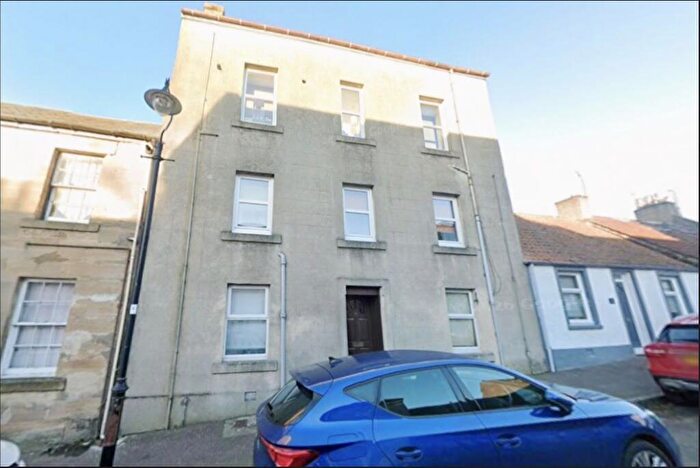
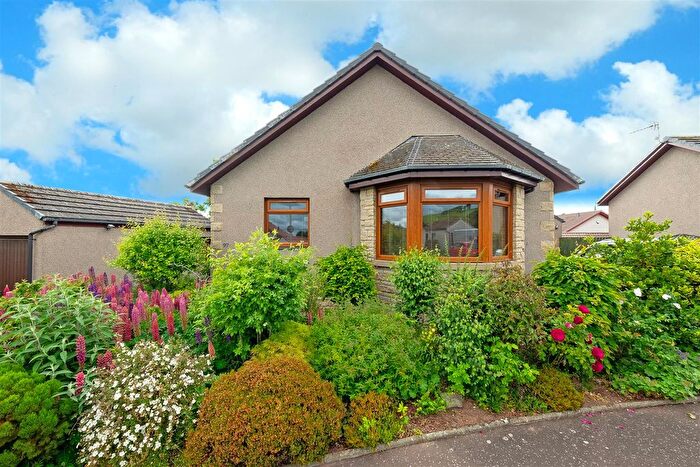
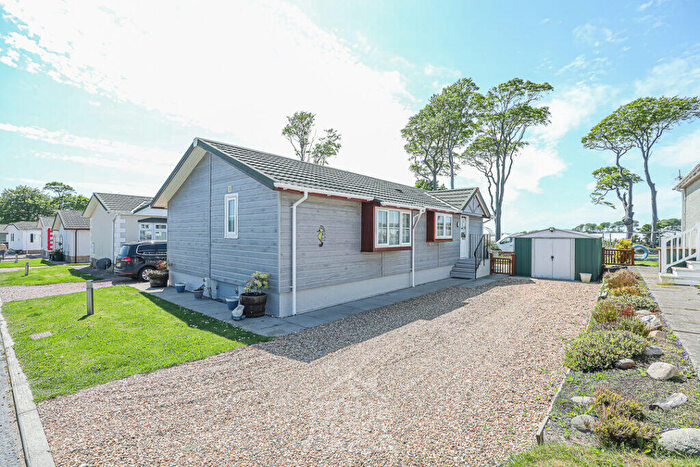
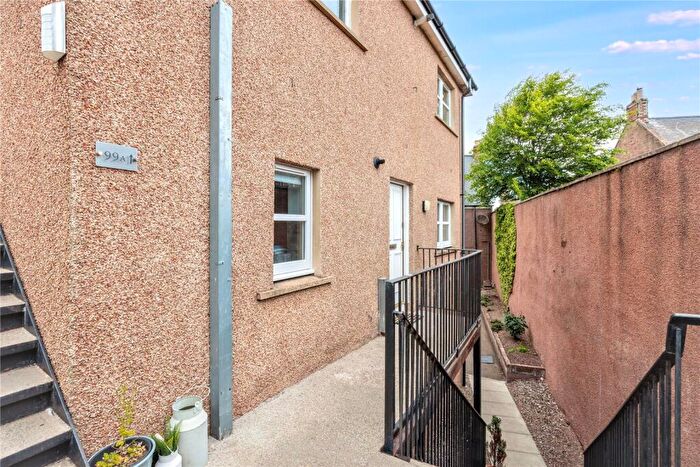
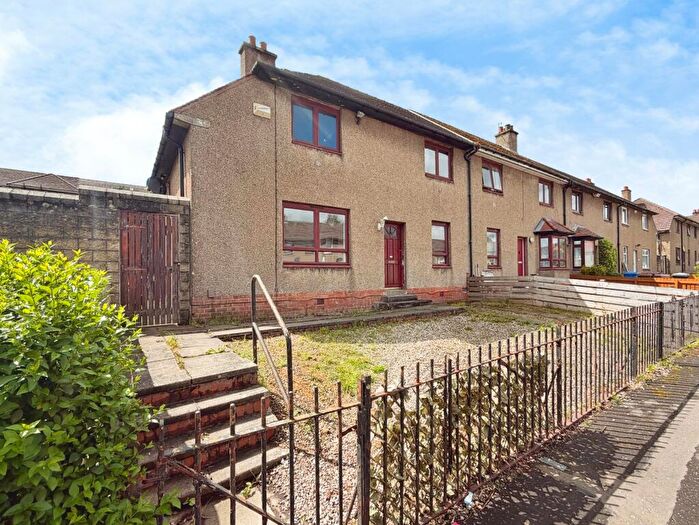
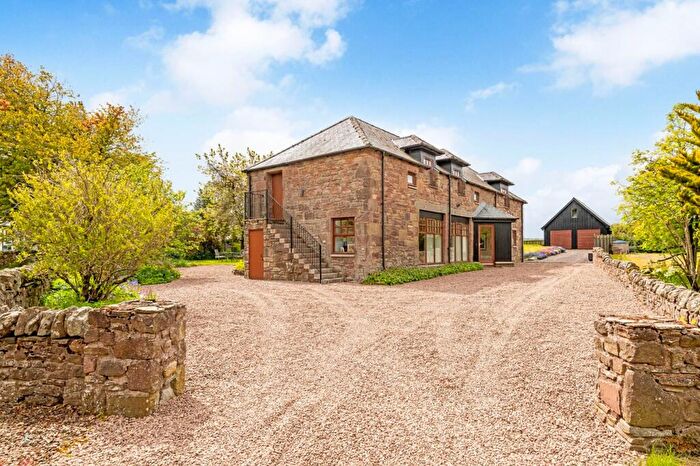
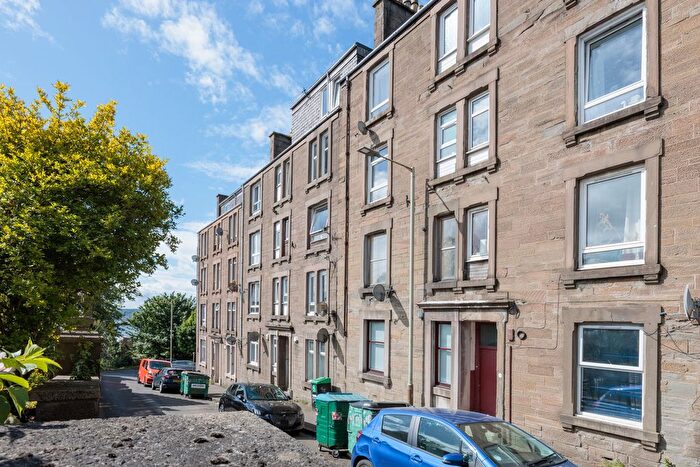
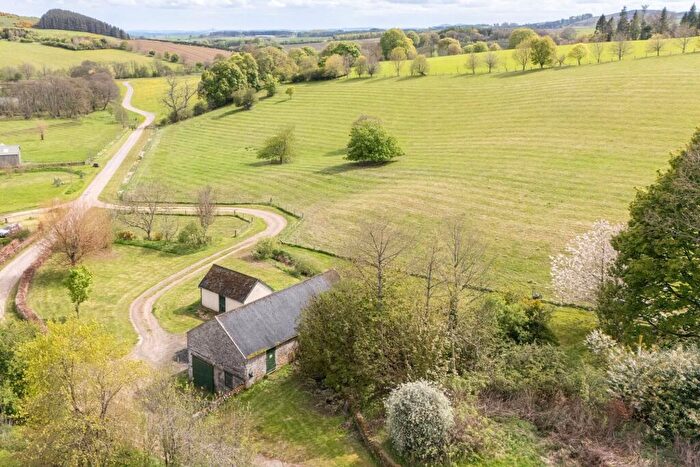
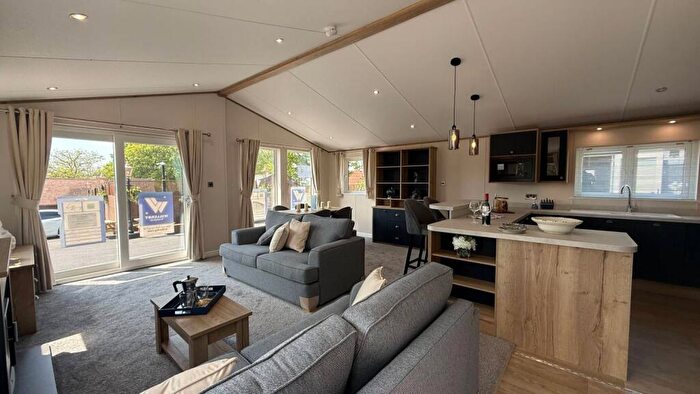
Properties for sale in Angus

![]()
If you are looking to sell your house, let it out, or receive a property valuation, an expert can help you.
Click the button below to get started.
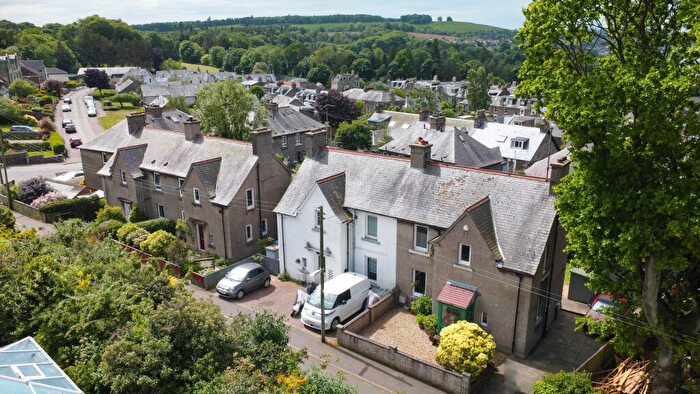

Towns in Angus
Navigate through our locations to find the location of your next house in Angus, Scotland for sale or to rent.
Transport in Angus
Please see below transportation links in this area:

- FAQ
- Price Paid By Year
Frequently asked questions about Angus
What is the average price for a property for sale in Angus?
The average price for a property for sale in Angus is £170,892. This amount is 15% lower than the average price in Scotland. There are more than 10,000 property listings for sale in Angus.
What locations have the most expensive properties for sale in Angus?
The locations with the most expensive properties for sale in Angus are Dundee at an average of £250,398, Blairgowrie at an average of £219,587 and Carnoustie at an average of £191,801.
What locations have the most affordable properties for sale in Angus?
The locations with the most affordable properties for sale in Angus are Arbroath at an average of £149,160, Montrose at an average of £150,054 and Brechin at an average of £150,480.
Which train stations are available in or near Angus?
Some of the train stations available in or near Angus are Arbroath, Carnoustie and Golf Street.
Property Price Paid in Angus by Year
The average sold property price by year was:
| Year | Average Sold Price | Price Change |
Sold Properties
|
|---|---|---|---|
| 2026 | £158,238 | -9% |
149 Properties |
| 2025 | £171,966 | - |
962 Properties |
| 2024 | £171,882 | 1% |
815 Properties |
| 2023 | £170,937 | -11% |
1,005 Properties |
| 2022 | £190,322 | 4% |
2,122 Properties |
| 2021 | £182,819 | 5% |
2,639 Properties |
| 2020 | £173,742 | 3% |
1,878 Properties |
| 2019 | £169,173 | 2% |
2,149 Properties |
| 2018 | £165,449 | 4% |
2,134 Properties |
| 2017 | £158,826 | 0,2% |
2,081 Properties |
| 2016 | £158,446 | 2% |
2,089 Properties |
| 2015 | £154,696 | 0,3% |
2,130 Properties |
| 2014 | £154,282 | 5% |
2,066 Properties |
| 2013 | £146,767 | 1% |
1,813 Properties |
| 2012 | £144,664 | 2% |
1,439 Properties |
| 2011 | £141,059 | -8% |
1,367 Properties |
| 2010 | £152,024 | 11% |
1,556 Properties |
| 2009 | £135,292 | -3% |
1,560 Properties |
| 2008 | £139,700 | 1% |
2,080 Properties |
| 2007 | £138,316 | 11% |
2,658 Properties |
| 2006 | £123,149 | 18% |
2,759 Properties |
| 2005 | £100,689 | 12% |
2,821 Properties |
| 2004 | £88,991 | 10% |
2,716 Properties |
| 2003 | £80,154 | 22% |
2,838 Properties |
| 2002 | £62,658 | -4% |
3,020 Properties |
| 2001 | £65,025 | - |
196 Properties |