
Houses for sale & to rent in DD10 8SH, Rosehill Court, Montrose and District, Montrose
House Prices in DD10 8SH, Rosehill Court, Montrose and District
Properties in DD10 8SH have an average house price of £150,000.00 and had 1 Property Transaction within the last 3 years.¹ DD10 8SH is a postcode in Rosehill Court located in Montrose and District, an area in Montrose, Angus, with 6 households², where the most expensive property was sold for £150,000.00.
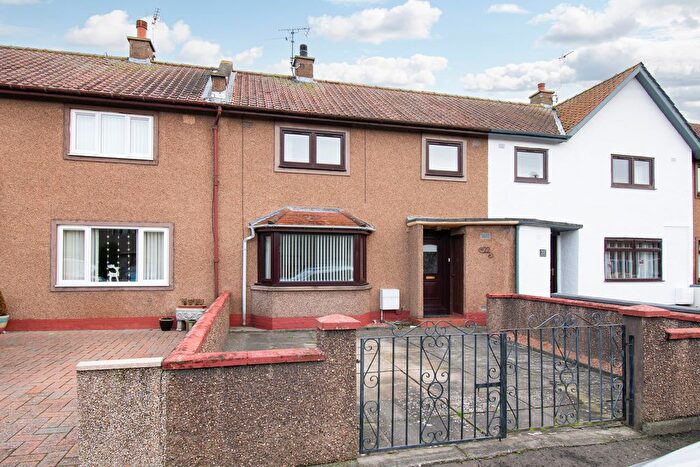
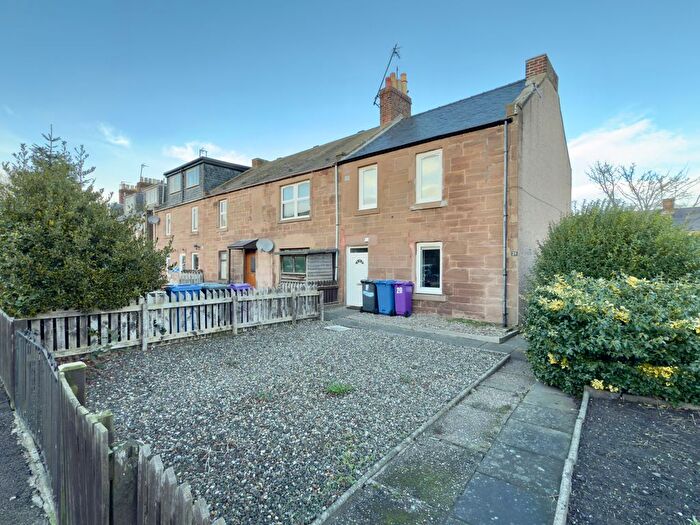
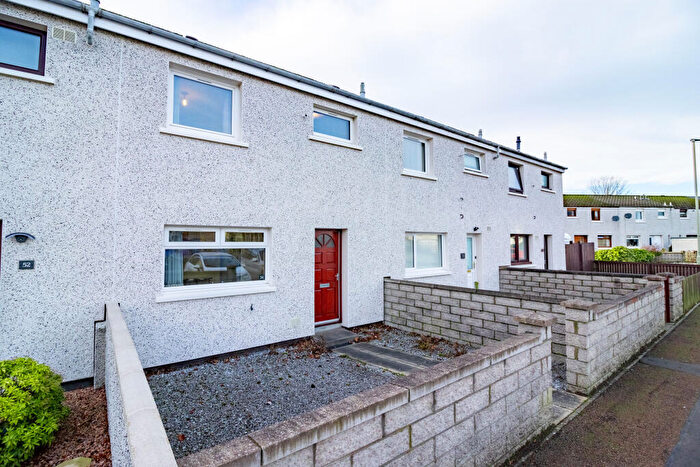
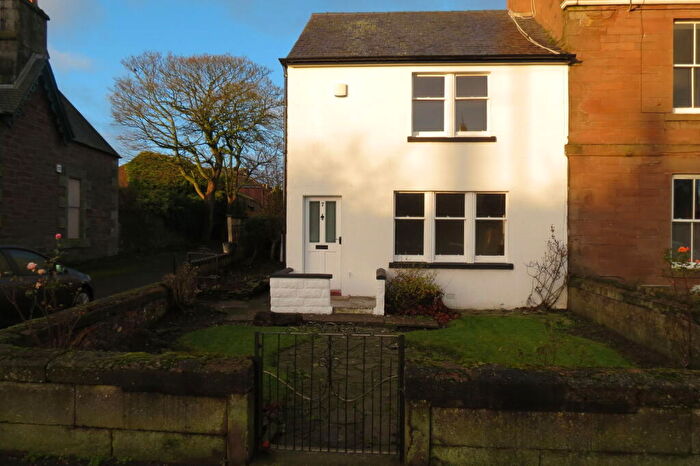
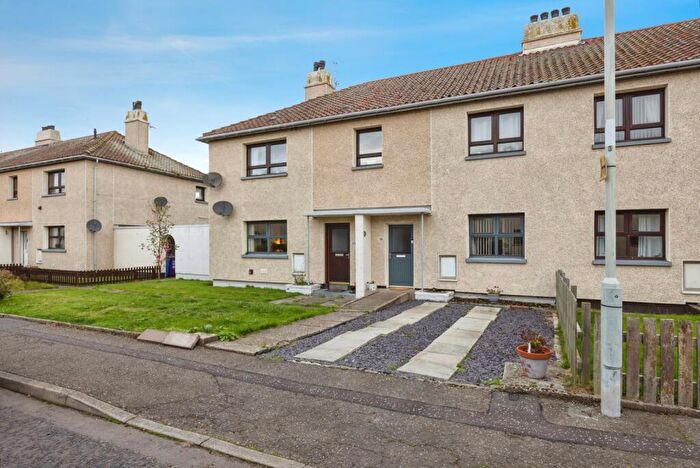
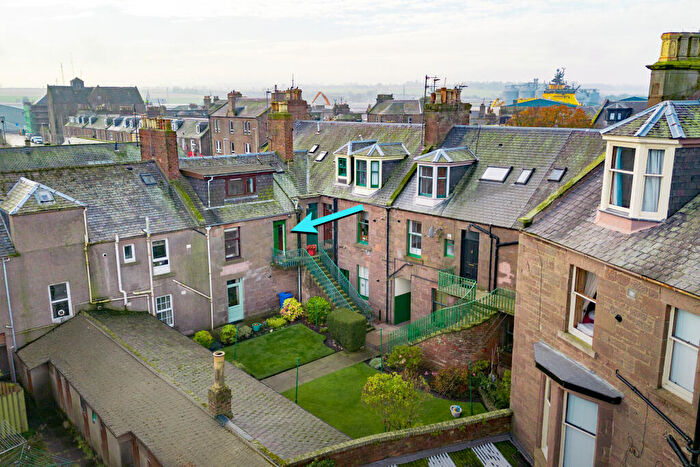
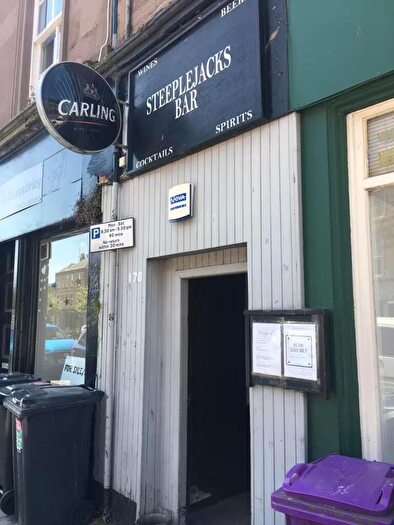
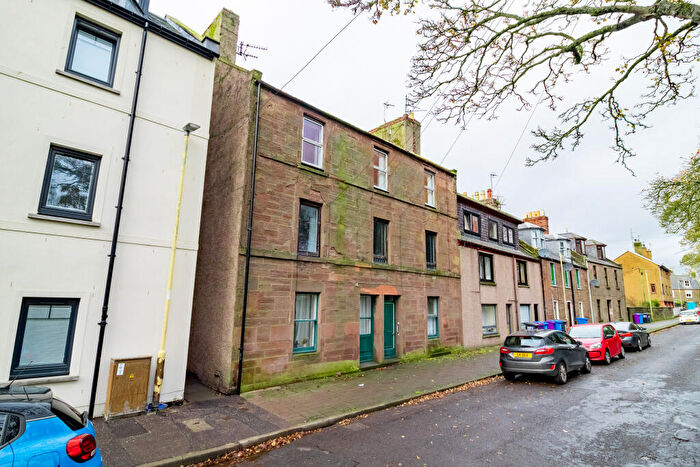
Properties for sale near DD10 8SH, Rosehill Court

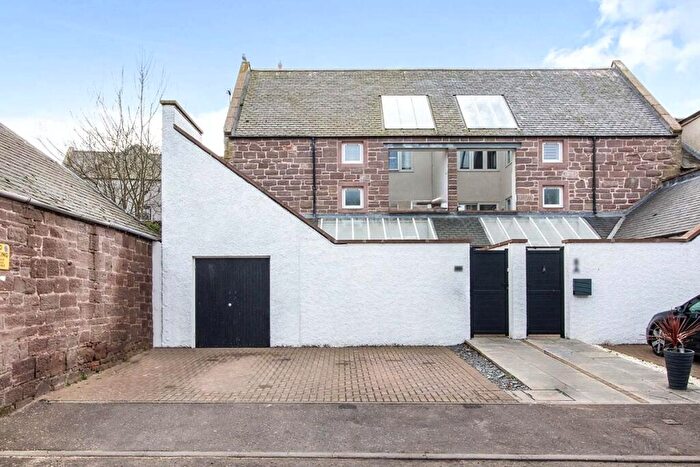
![]()
If you are looking to sell your house, let it out, or receive a property valuation, an expert can help you.
Click the button below to get started.

Price Paid in Rosehill Court, DD10 8SH, Montrose and District
2 Rosehill Court, DD10 8SH, Montrose and District Montrose
Property 2 has been sold 2 times. The last time it was sold was in 07/01/2022 and the sold price was £150,000.00.
This is a Property which was sold as an Established Building in 07/01/2022
| Date | Price | Classification |
|---|---|---|
| 07/01/2022 | £150,000.00 | Established Building |
| 03/11/2008 | £146,000.00 | Established Building |
3 Rosehill Court, DD10 8SH, Montrose and District Montrose
Property 3 has been sold 2 times. The last time it was sold was in 17/03/2020 and the sold price was £185,000.00.
This is a Property which was sold as an Established Building in 17/03/2020
| Date | Price | Classification |
|---|---|---|
| 17/03/2020 | £185,000.00 | Established Building |
| 25/08/2016 | £156,000.00 | Established Building |
5 Rosehill Court, DD10 8SH, Montrose and District Montrose
Property 5 has been sold 2 times. The last time it was sold was in 02/09/2009 and the sold price was £152,500.00.
This is a Property which was sold as an Established Building in 02/09/2009
| Date | Price | Classification |
|---|---|---|
| 02/09/2009 | £152,500.00 | Established Building |
| 01/07/2002 | £70,000.00 | Established Building |
Transport near DD10 8SH, Rosehill Court

House price paid reports for DD10 8SH, Rosehill Court
Click on the buttons below to see price paid reports by year or property price:
- Price Paid By Year
Property Price Paid in DD10 8SH, Rosehill Court by Year
The average sold property price by year was:
| Year | Average Sold Price | Price Change |
Sold Properties
|
|---|---|---|---|
| 2022 | £150,000 | -23% |
1 Property |
| 2020 | £185,000 | 16% |
1 Property |
| 2016 | £156,000 | 2% |
1 Property |
| 2009 | £152,500 | 4% |
1 Property |
| 2008 | £146,000 | 52% |
1 Property |
| 2002 | £70,000 | - |
1 Property |