
Houses for sale & to rent in DD10 9NT, Esk Road, Montrose and District, Montrose
House Prices in DD10 9NT, Esk Road, Montrose and District
Properties in DD10 9NT have no sales history available within the last 3 years. DD10 9NT is a postcode in Esk Road located in Montrose and District, an area in Montrose, Angus, with 4 households².
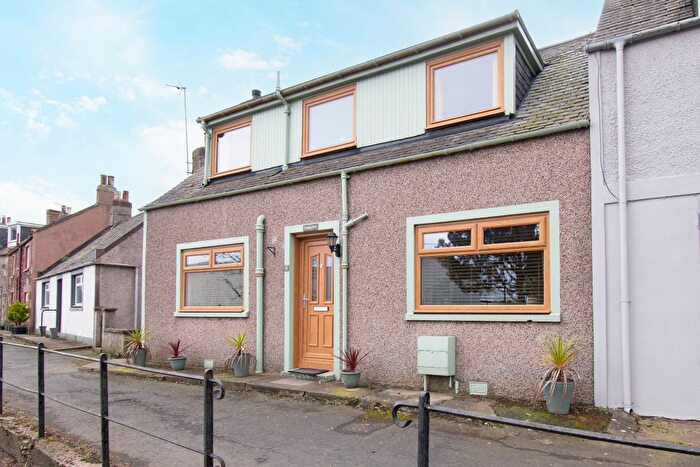
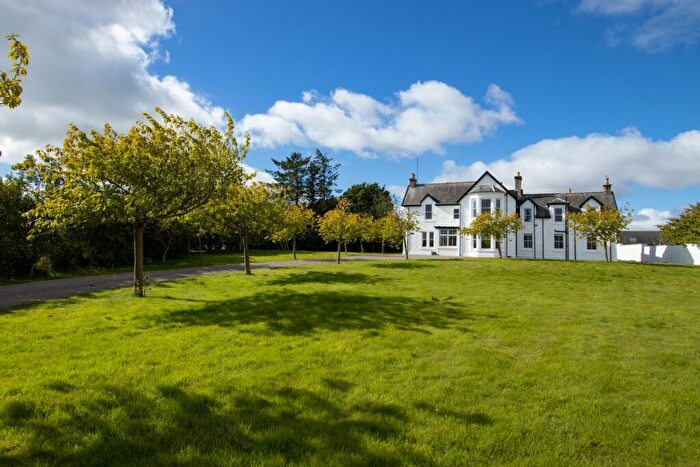
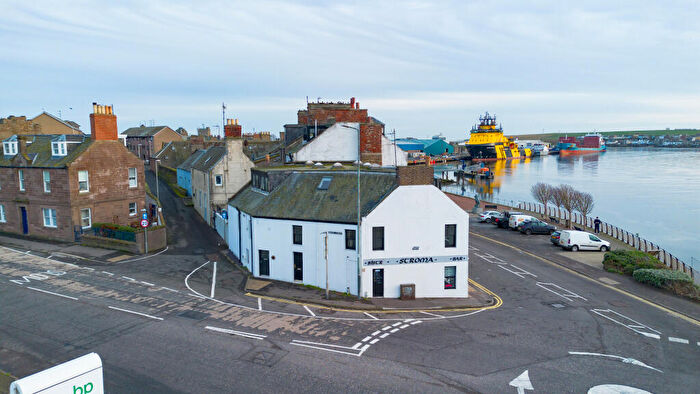
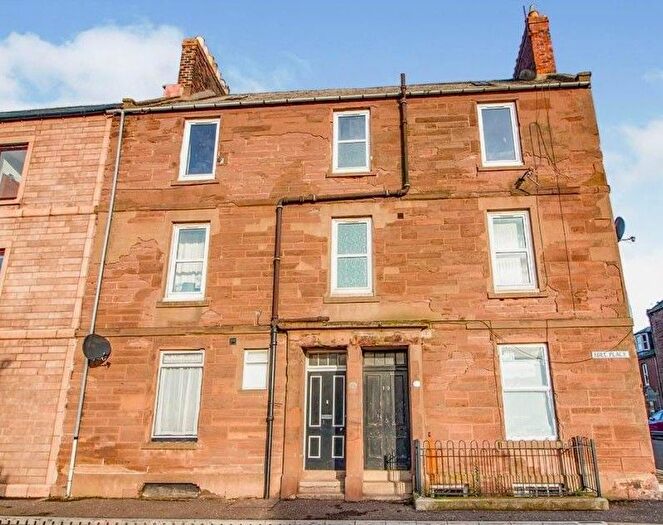
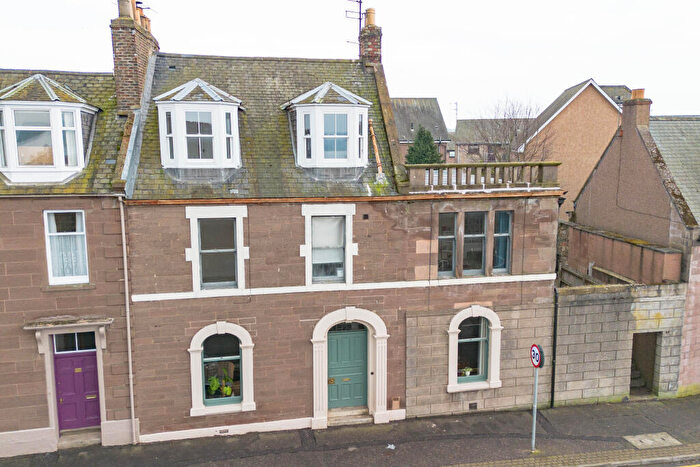
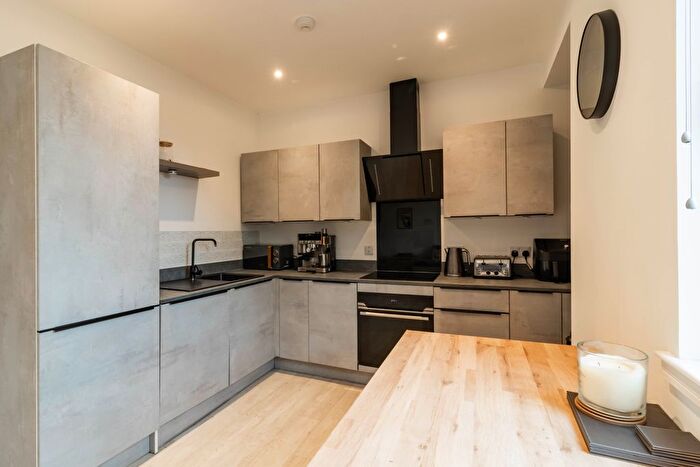
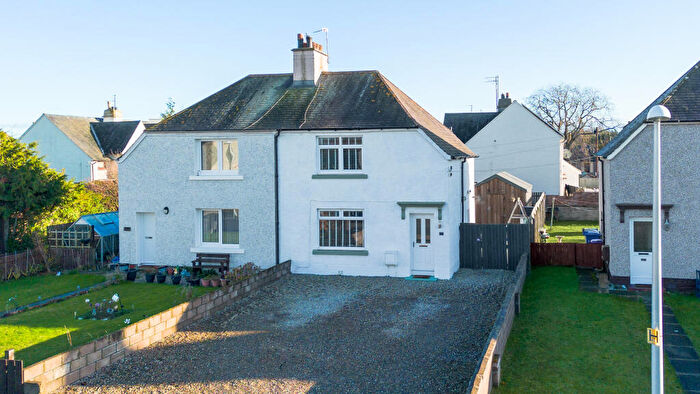
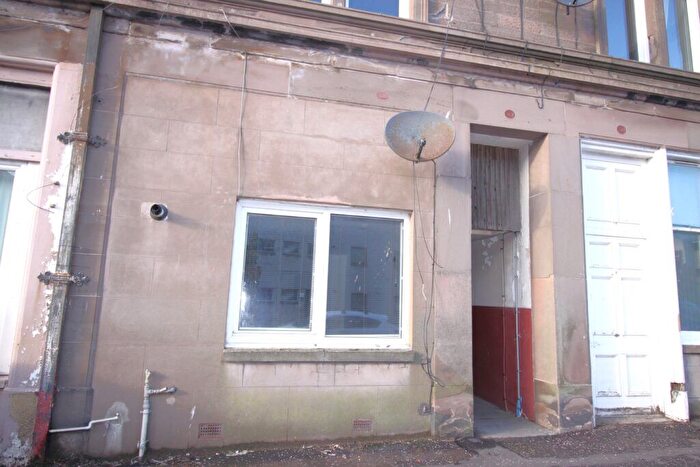
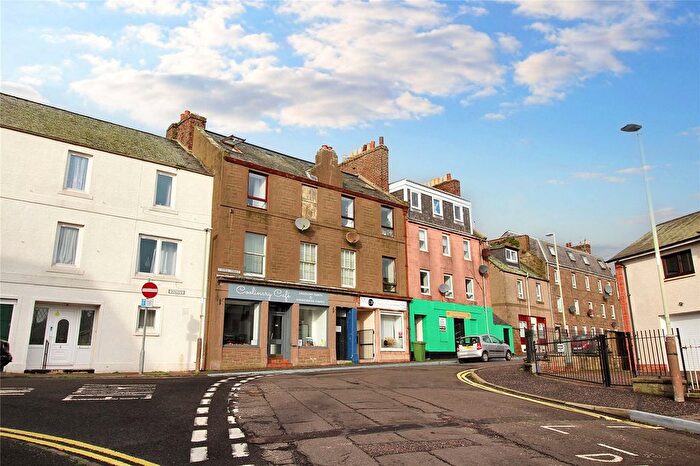
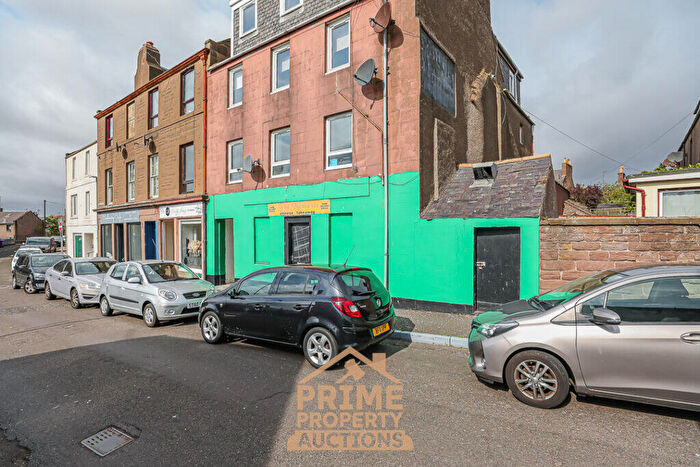
Properties for sale near DD10 9NT, Esk Road
![]()
If you are looking to sell your house, let it out, or receive a property valuation, an expert can help you.
Click the button below to get started.
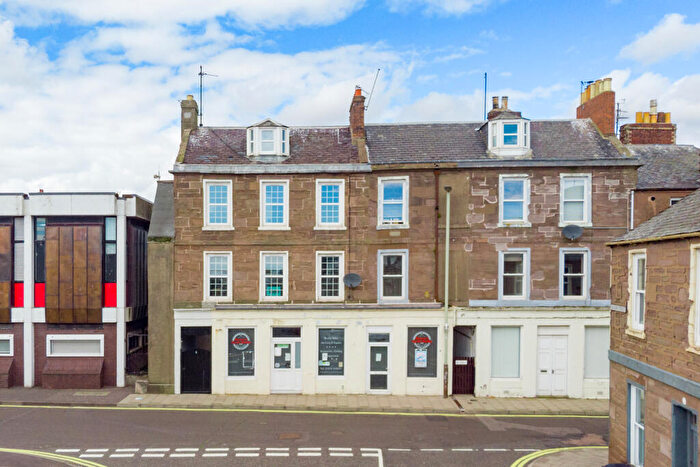
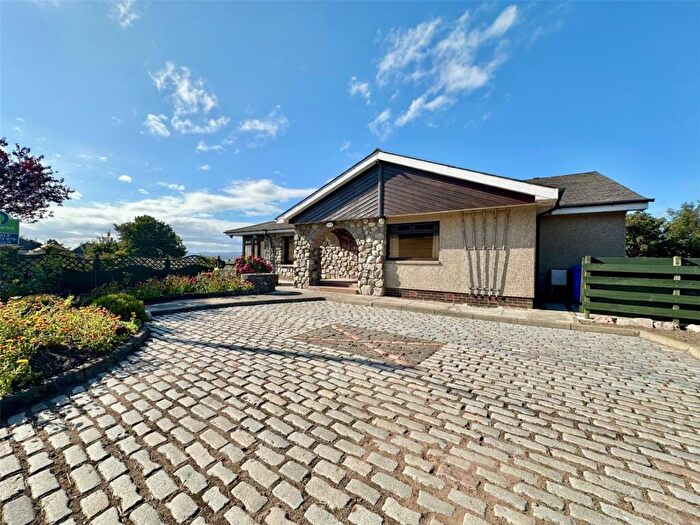
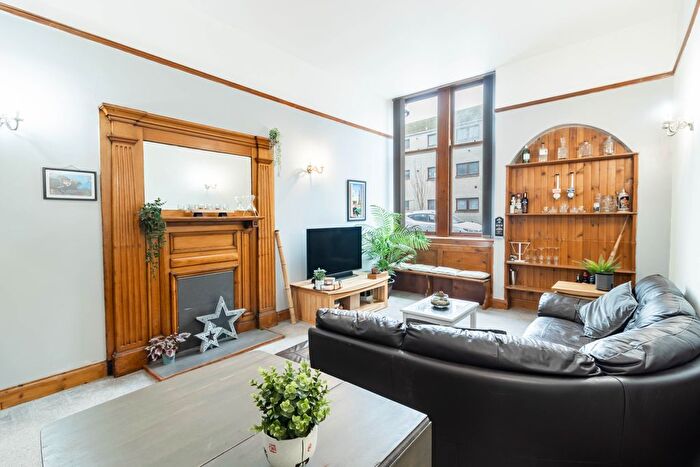
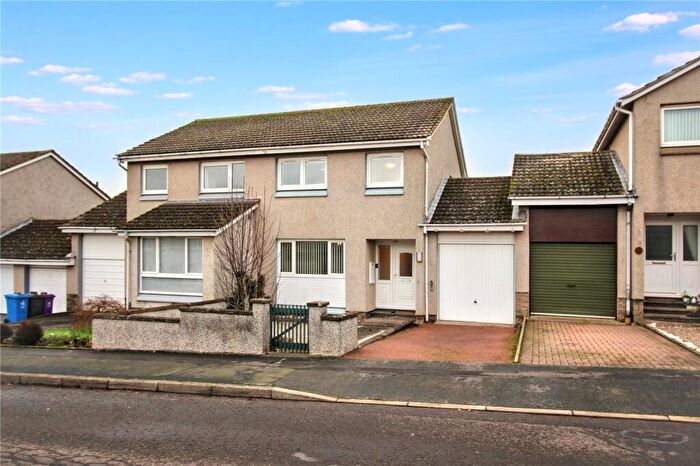
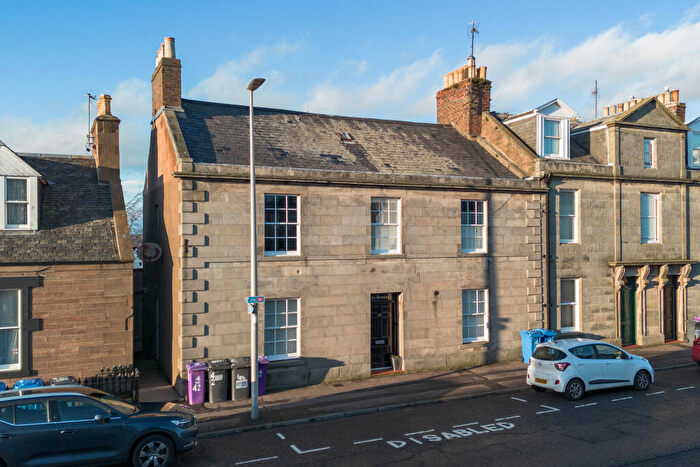
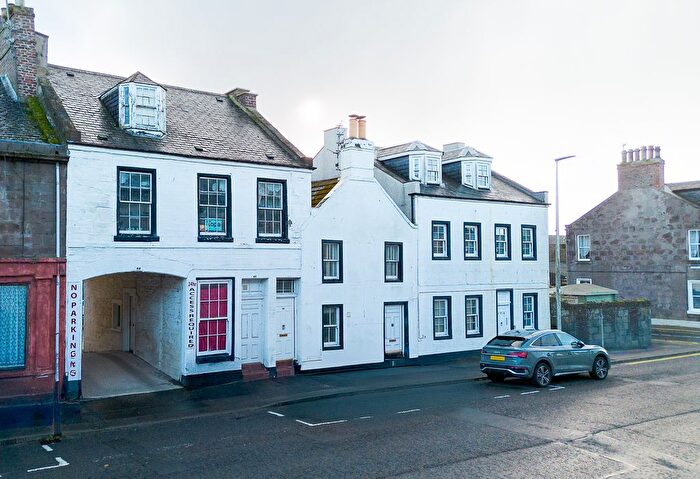
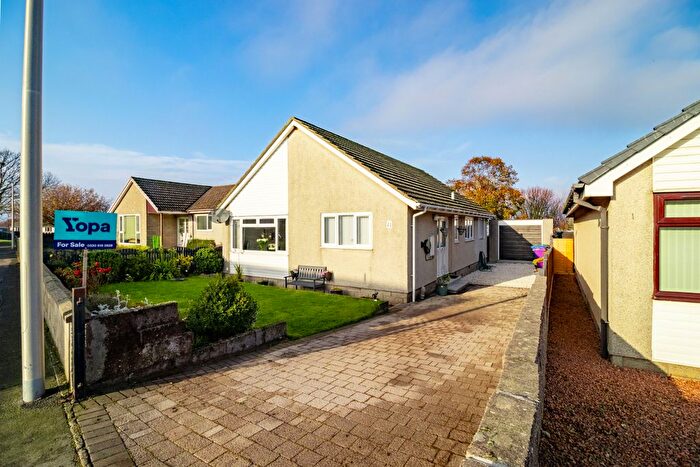
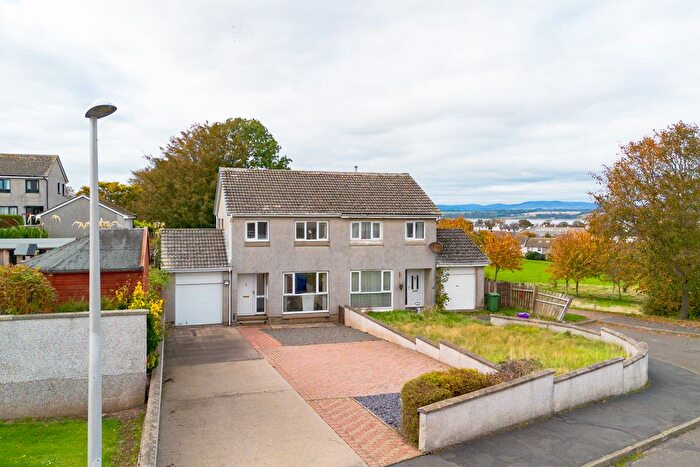
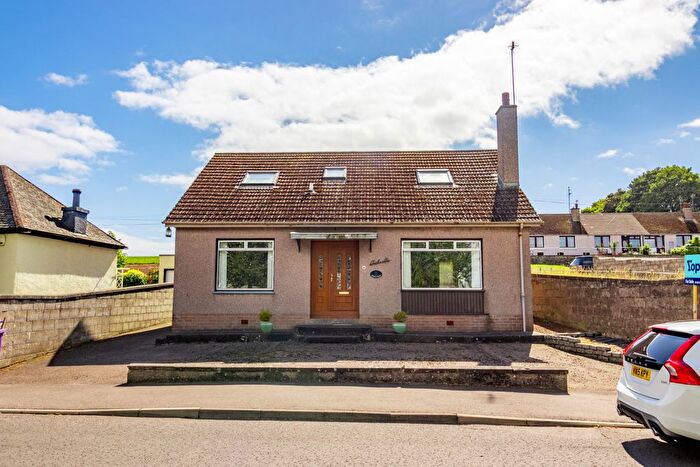
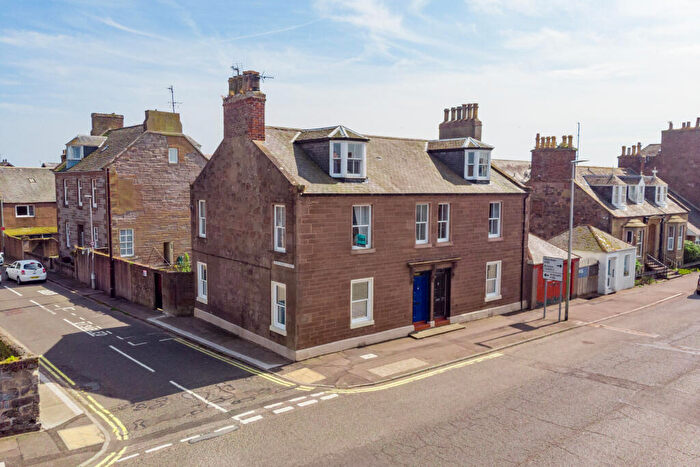
Previously listed properties near DD10 9NT, Esk Road
![]()
If you are looking to sell your house, let it out, or receive a property valuation, an expert can help you.
Click the button below to get started.


Price Paid in Esk Road, DD10 9NT, Montrose and District
1 Esk Road, DD10 9NT, Montrose and District Montrose
Property 1 has been sold 3 times. The last time it was sold was in 11/08/2021 and the sold price was £340,000.00.
This is a Property which was sold as an Established Building in 11/08/2021
| Date | Price | Classification |
|---|---|---|
| 11/08/2021 | £340,000.00 | Established Building |
| 03/11/2016 | £250,000.00 | Established Building |
| 24/01/2003 | £63,000.00 | Established Building |
1a Esk Road, DD10 9NT, Montrose and District Montrose
Property 1a has been sold 4 times. The last time it was sold was in 29/12/2020 and the sold price was £335,000.00.
This is a Property which was sold as an Established Building in 29/12/2020
| Date | Price | Classification |
|---|---|---|
| 29/12/2020 | £335,000.00 | Established Building |
| 09/01/2003 | £95,000.00 | Established Building |
| 09/01/2003 | £400.00 | Established Building |
| 09/01/2003 | £400.00 | Established Building |
3 Esk Road, DD10 9NT, Montrose and District Montrose
Property 3 has been sold 1 time. The last time it was sold was in 22/05/2002 and the sold price was £38,000.00.
This is a Property which was sold as an Established Building in 22/05/2002
| Date | Price | Classification |
|---|---|---|
| 22/05/2002 | £38,000.00 | Established Building |
Transport near DD10 9NT, Esk Road

House price paid reports for DD10 9NT, Esk Road
Click on the buttons below to see price paid reports by year or property price:
- Price Paid By Year
Property Price Paid in DD10 9NT, Esk Road by Year
The average sold property price by year was:
| Year | Average Sold Price | Price Change |
Sold Properties
|
|---|---|---|---|
| 2021 | £340,000 | 1% |
1 Property |
| 2020 | £335,000 | 25% |
1 Property |
| 2016 | £250,000 | 84% |
1 Property |
| 2003 | £39,700 | 4% |
4 Properties |
| 2002 | £38,000 | - |
1 Property |