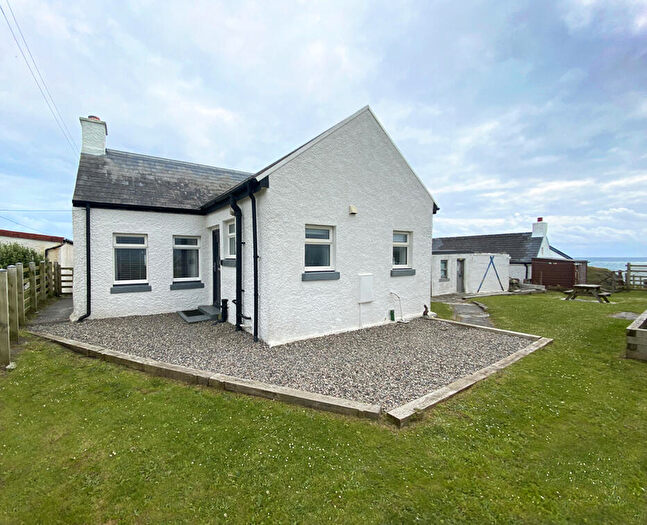
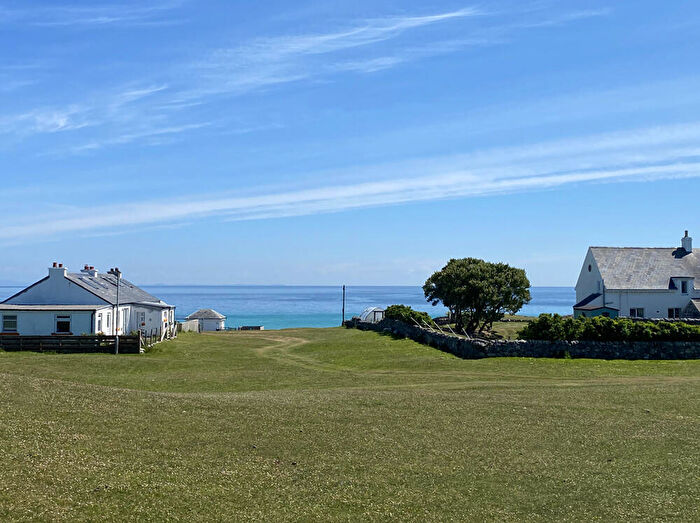
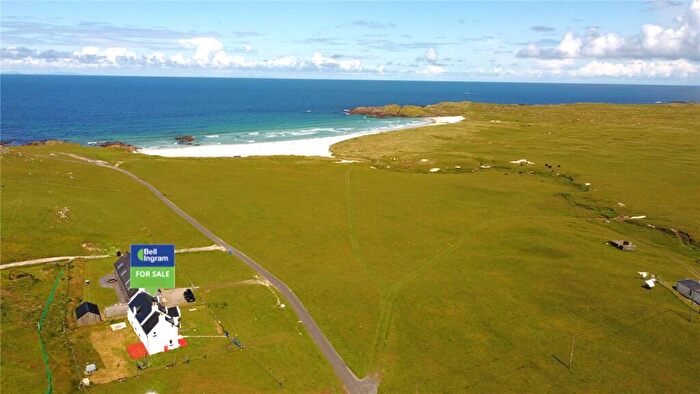
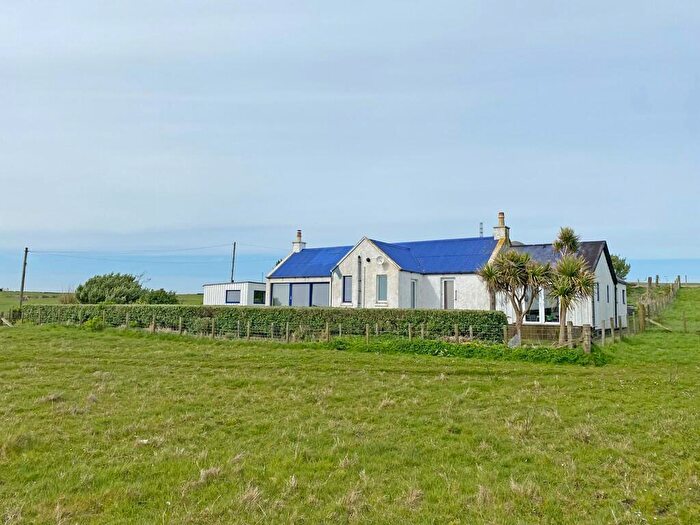
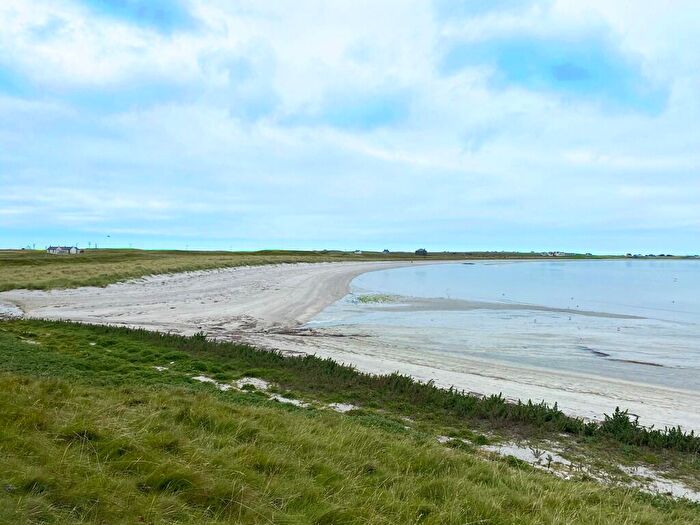
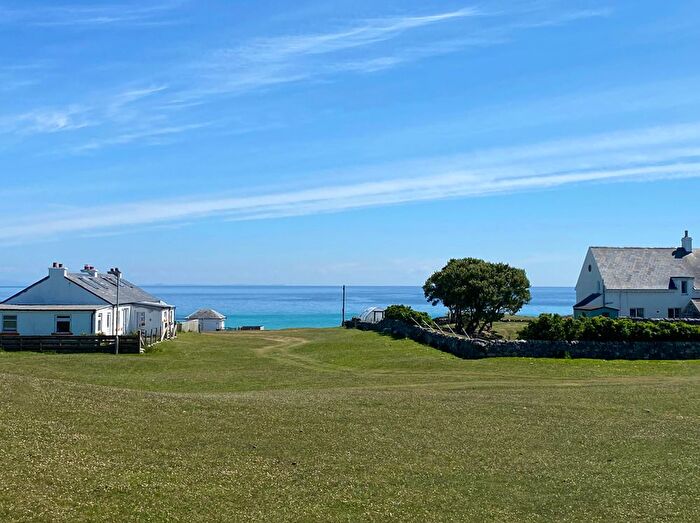
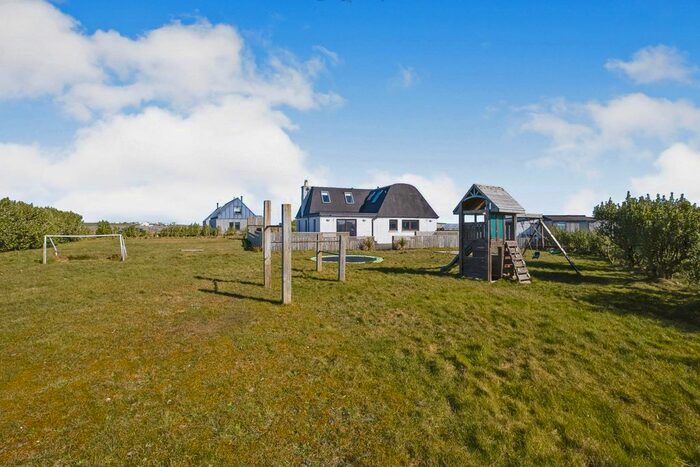
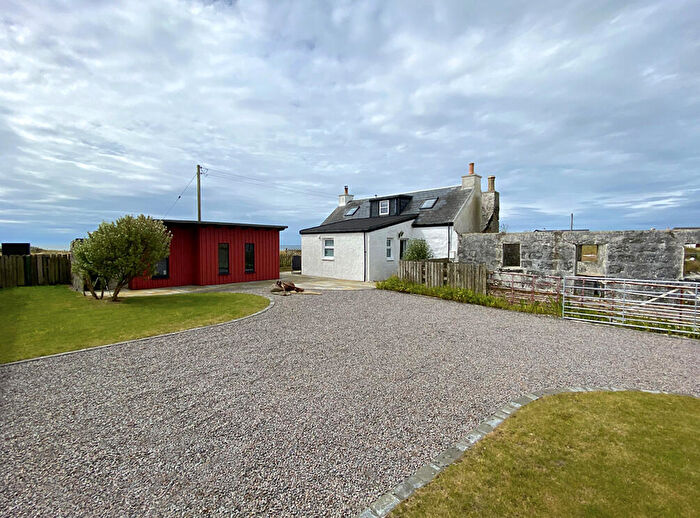
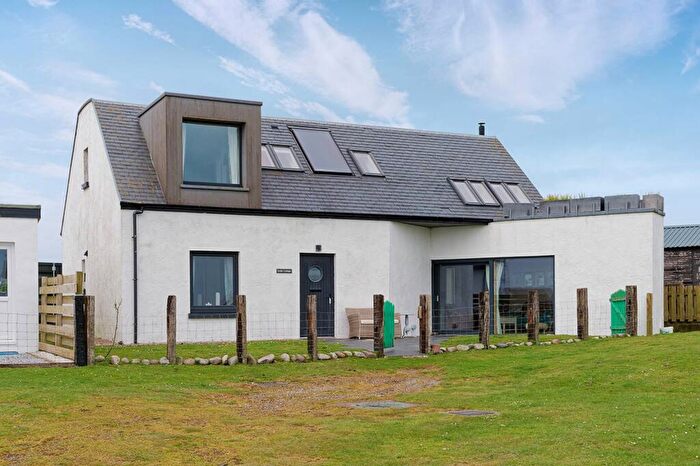
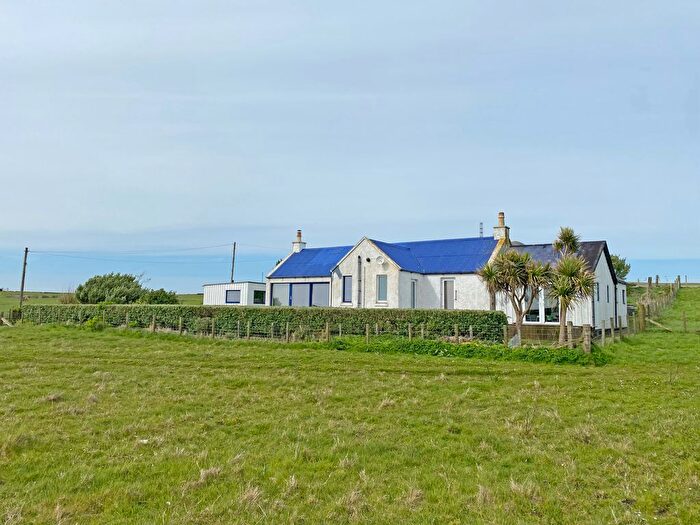
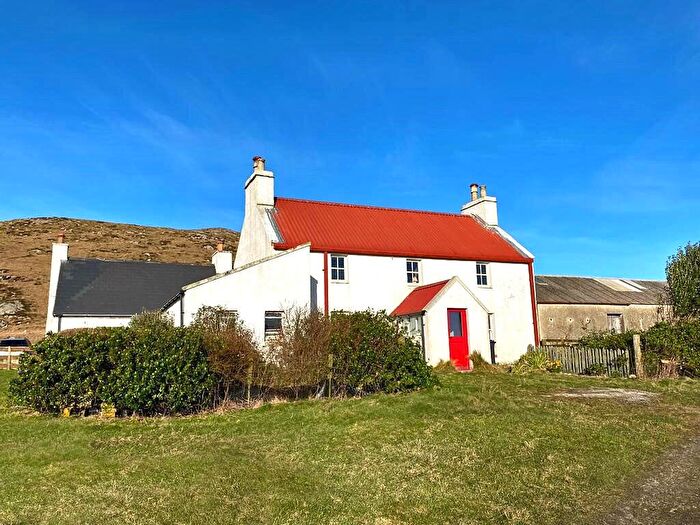
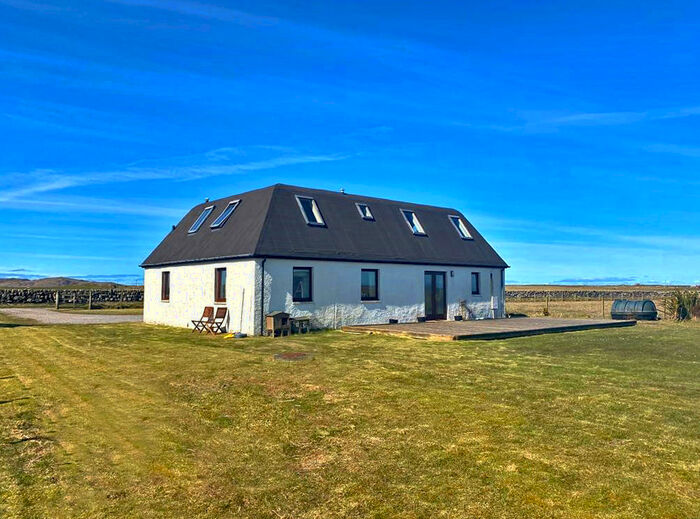
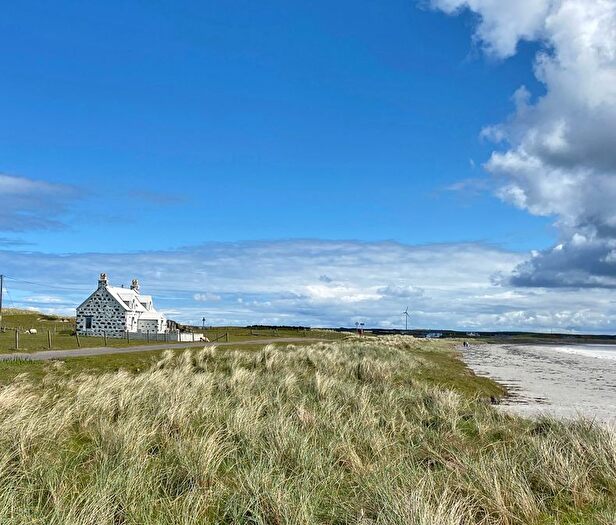
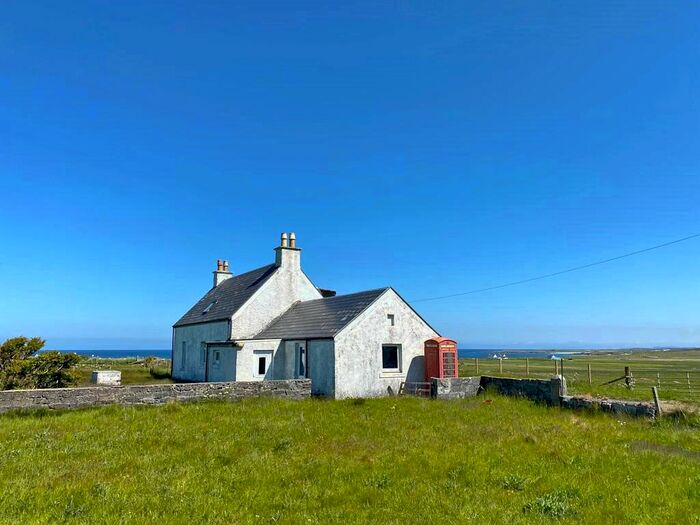
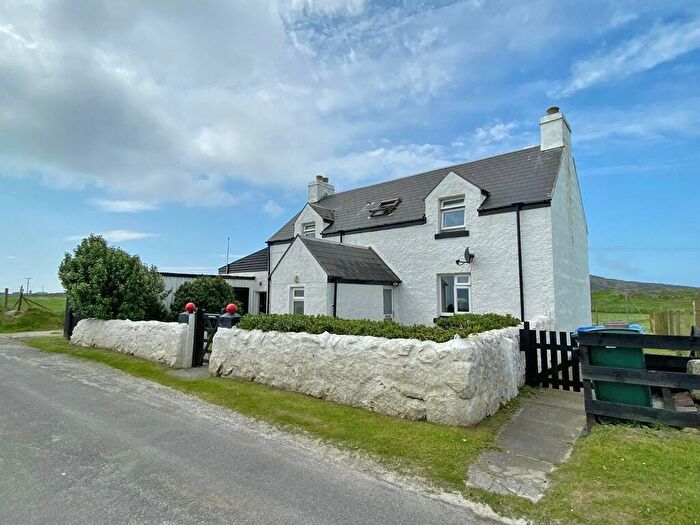
Houses for sale & to rent in Oban South and the Isles, Isle Of Tiree
House Prices in Oban South and the Isles
Properties in Oban South and the Isles have an average house price of £314,833.00 and had 12 Property Transactions within the last 3 years¹.
Oban South and the Isles is an area in Isle Of Tiree, Argyll and Bute with 316 households², where the most expensive property was sold for £550,000.00.
Properties for sale in Oban South and the Isles
Previously listed properties in Oban South and the Isles
Roads and Postcodes in Oban South and the Isles
Navigate through our locations to find the location of your next house in Oban South and the Isles, Isle Of Tiree for sale or to rent.
| Streets | Postcodes |
|---|---|
| Greenhill | PA77 6XG |
| Lower Square | PA77 6UG |
| Milton | PA77 6TT |
| Pier Road | PA77 6TL |
| Pier View | PA77 6AB |
| Reef Terrace | PA77 6UT |
| Sruthan Terrace | PA77 6UR |
| Upper Square | PA77 6UQ |
| PA77 6TN PA77 6TP PA77 6TR PA77 6TS PA77 6TW PA77 6TX PA77 6TY PA77 6TZ PA77 6UA PA77 6UB PA77 6UD PA77 6UE PA77 6UF PA77 6UH PA77 6UL PA77 6UN PA77 6UP PA77 6UU PA77 6UW PA77 6UX PA77 6UY PA77 6UZ PA77 6XA PA77 6XB PA77 6XD PA77 6XE PA77 6XF PA77 6XH PA77 6XJ PA77 6XL PA77 6XQ |
Transport near Oban South and the Isles
-
Arisaig Station
-
Beasdale Station
-
Morar Station
-
Mallaig Station
-
Lochailort Station
-
Oban Station
-
Connel Ferry Station
-
Glenfinnan Station
-
Taynuilt Station
-
Locheilside Station
- FAQ
- Price Paid By Year
Frequently asked questions about Oban South and the Isles
What is the average price for a property for sale in Oban South and the Isles?
The average price for a property for sale in Oban South and the Isles is £314,833. There are 65 property listings for sale in Oban South and the Isles.
Which train stations are available in or near Oban South and the Isles?
Some of the train stations available in or near Oban South and the Isles are Arisaig, Beasdale and Morar.
Property Price Paid in Oban South and the Isles by Year
The average sold property price by year was:
| Year | Average Sold Price | Price Change |
Sold Properties
|
|---|---|---|---|
| 2023 | £247,500 | -30% |
1 Property |
| 2022 | £320,954 | 29% |
11 Properties |
| 2021 | £229,333 | 6% |
21 Properties |
| 2020 | £214,429 | 38% |
17 Properties |
| 2019 | £133,666 | -24% |
9 Properties |
| 2018 | £166,350 | 10% |
10 Properties |
| 2017 | £150,450 | 12% |
10 Properties |
| 2016 | £132,311 | -24% |
18 Properties |
| 2015 | £163,866 | 4% |
12 Properties |
| 2014 | £156,533 | -16% |
15 Properties |
| 2013 | £182,150 | 23% |
10 Properties |
| 2012 | £141,050 | -8% |
10 Properties |
| 2011 | £152,750 | 20% |
14 Properties |
| 2010 | £122,683 | 31% |
6 Properties |
| 2009 | £84,292 | -21% |
8 Properties |
| 2008 | £102,291 | -22% |
14 Properties |
| 2007 | £124,985 | 18% |
17 Properties |
| 2006 | £102,319 | 34% |
19 Properties |
| 2005 | £67,821 | -8% |
17 Properties |
| 2004 | £73,324 | 54% |
22 Properties |
| 2003 | £33,422 | -0,1% |
23 Properties |
| 2002 | £33,442 | 99% |
13 Properties |
| 2001 | £500 | - |
1 Property |

