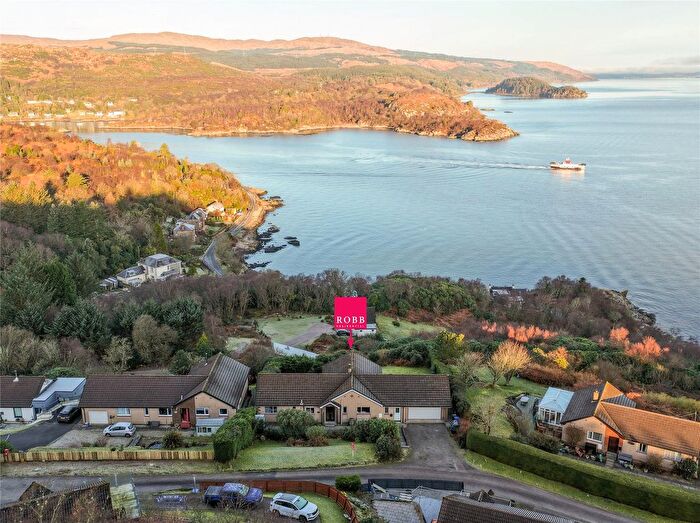
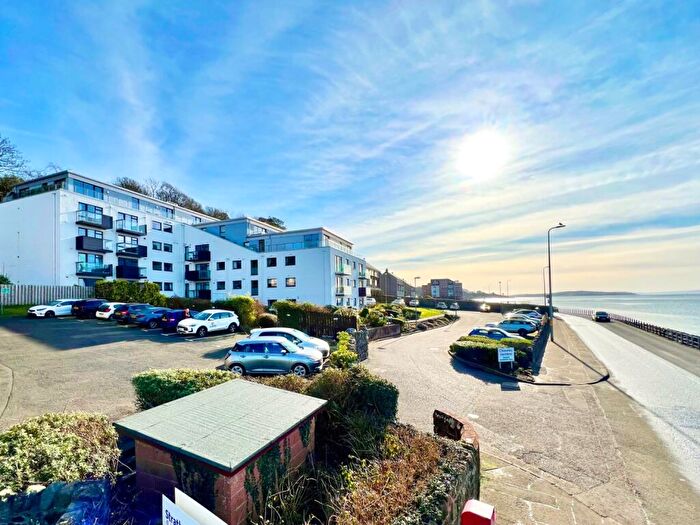
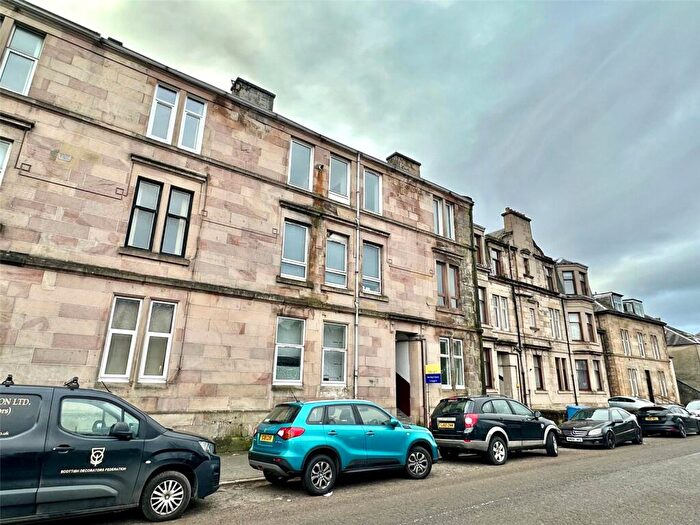
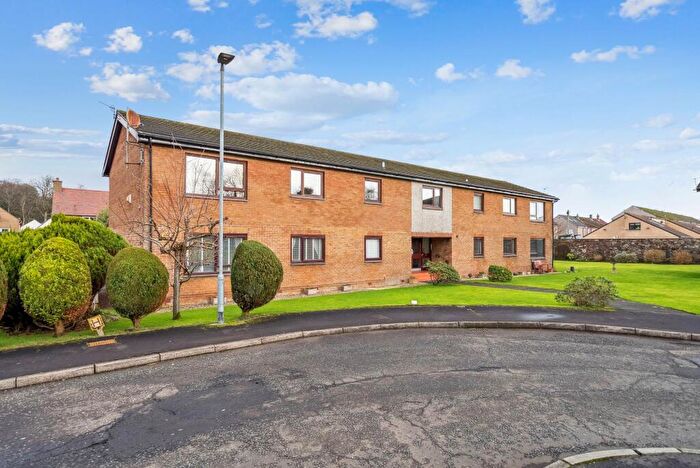
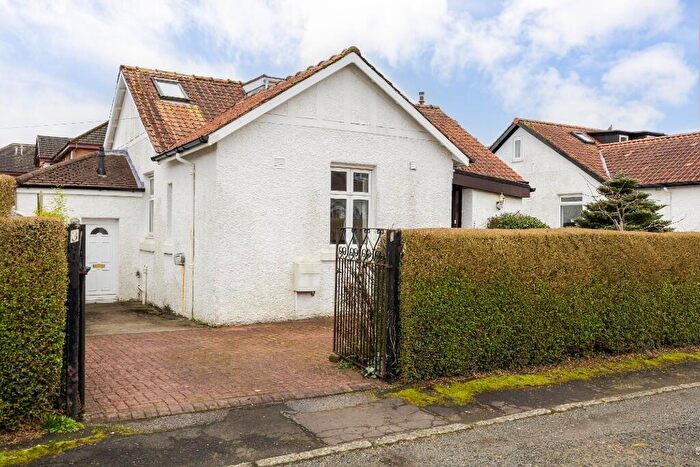
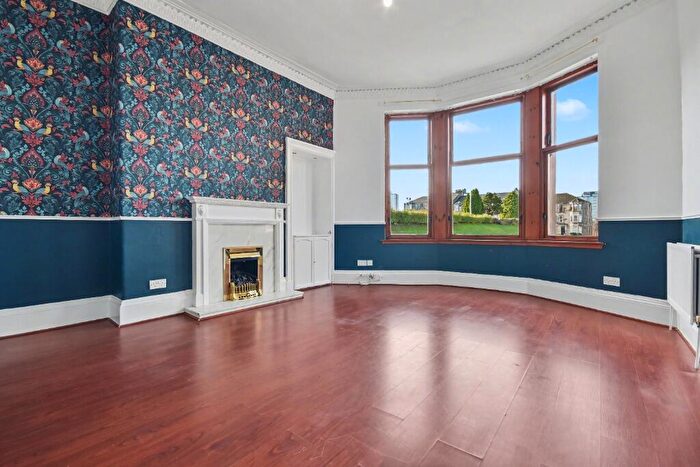
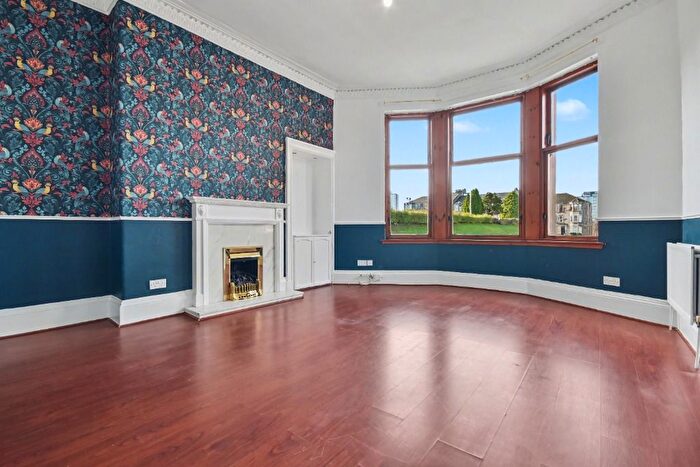
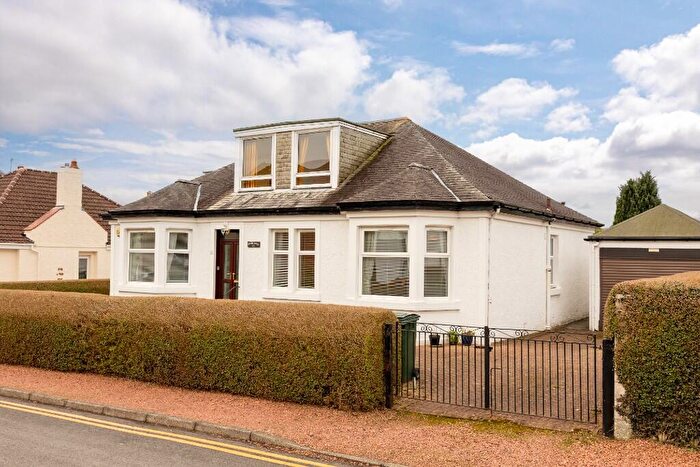
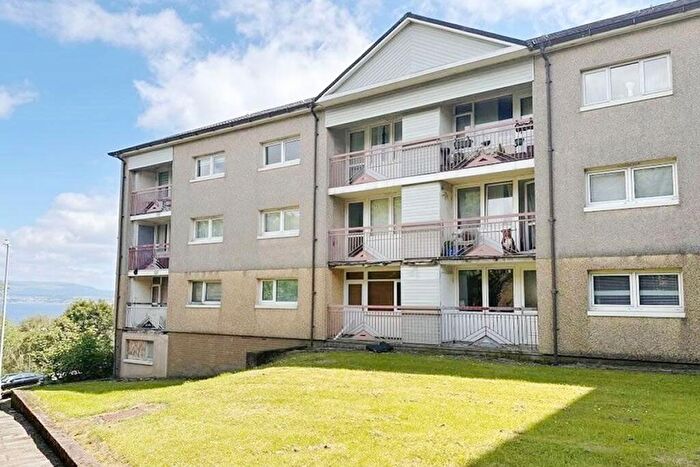
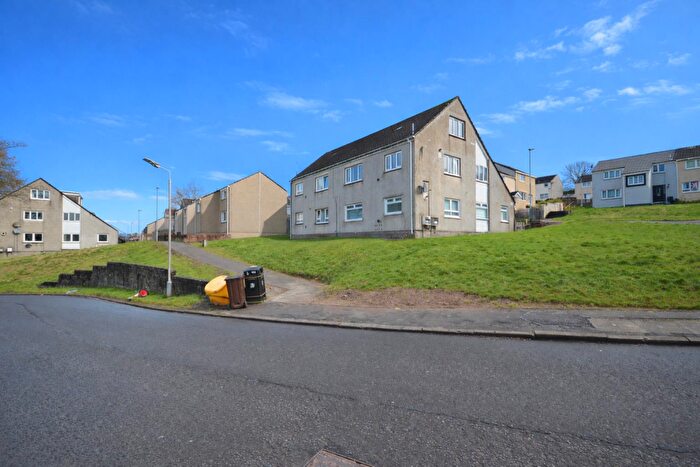
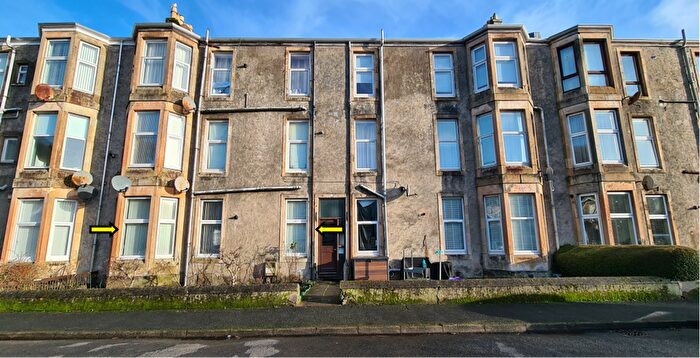
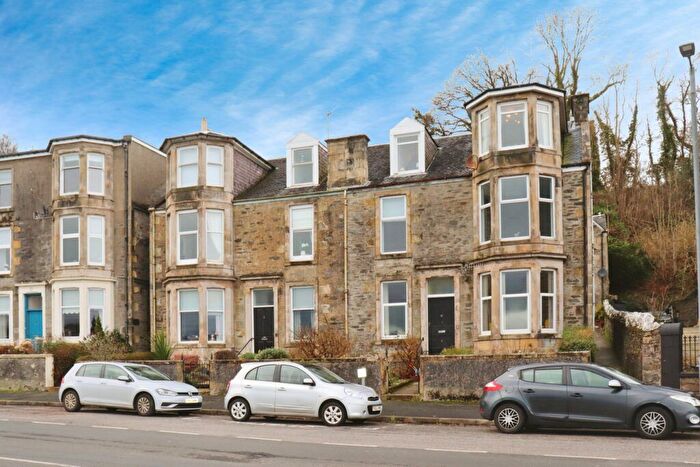
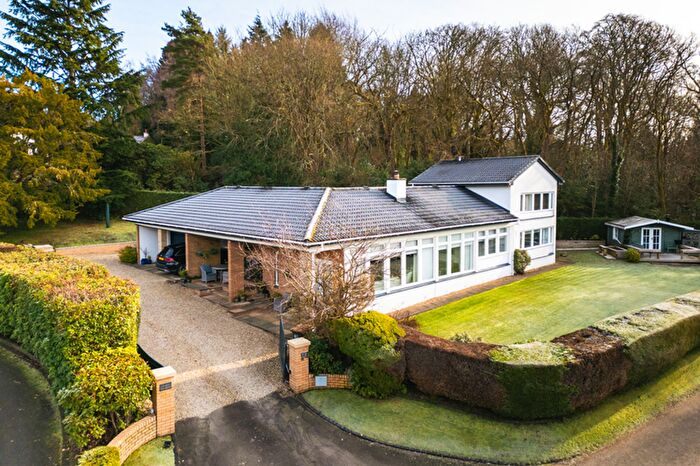
Houses for sale & to rent in Argyll and Bute, Scotland
House Prices in Argyll and Bute
Properties in Argyll and Bute have
an average house price of
£207,163.00
and had 1,621 Property Transactions
within the last 3 years.¹
Argyll and Bute is a location in
Scotland with
39,983 households², where the most expensive property was sold for £1,450,000.00.
Properties for sale in Argyll and Bute
Towns in Argyll and Bute
Navigate through our locations to find the location of your next house in Argyll and Bute, Scotland for sale or to rent.
- Alexandria
- Appin
- Bridge Of Orchy
- Cairndow
- Campbeltown
- Colintraive
- Crianlarich
- Dalmally
- Dumbarton
- Dunoon
- Glasgow
- Helensburgh
- Inveraray
- Isle Of Bute
- Isle Of Coll
- Isle Of Colonsay
- Isle Of Gigha
- Isle Of Iona
- Isle Of Islay
- Isle Of Jura
- Isle Of Mull
- Isle Of Tiree
- Lochgilphead
- Oban
- Tarbert
- Taynuilt
- Tighnabruaich
Transport in Argyll and Bute
Please see below transportation links in this area:
-
Garelochhead Station
-
Inverkip Station
-
Gourock Station
-
Wemyss Bay Station
-
IBM Station
-
Fort Matilda Station
-
Branchton Station
-
Drumfrochar Station
-
Greenock West Station
-
Helensburgh Central Station
- FAQ
- Price Paid By Year
Frequently asked questions about Argyll and Bute
What is the average price for a property for sale in Argyll and Bute?
The average price for a property for sale in Argyll and Bute is £207,163. This amount is 3% higher than the average price in Scotland. There are more than 10,000 property listings for sale in Argyll and Bute.
What locations have the most expensive properties for sale in Argyll and Bute?
The locations with the most expensive properties for sale in Argyll and Bute are Helensburgh at an average of £274,738, Dumbarton at an average of £266,556 and Taynuilt at an average of £245,630.
What locations have the most affordable properties for sale in Argyll and Bute?
The locations with the most affordable properties for sale in Argyll and Bute are Campbeltown at an average of £111,782, Tarbert at an average of £130,727 and Isle Of Bute at an average of £138,854.
Which train stations are available in or near Argyll and Bute?
Some of the train stations available in or near Argyll and Bute are Garelochhead, Inverkip and Gourock.
Property Price Paid in Argyll and Bute by Year
The average sold property price by year was:
| Year | Average Sold Price | Price Change |
Sold Properties
|
|---|---|---|---|
| 2025 | £207,424 | -0,3% |
421 Properties |
| 2024 | £207,981 | 1% |
463 Properties |
| 2023 | £206,500 | -2% |
737 Properties |
| 2022 | £211,135 | 9% |
1,856 Properties |
| 2021 | £191,192 | 9% |
2,288 Properties |
| 2020 | £174,665 | 2% |
1,587 Properties |
| 2019 | £171,358 | 5% |
1,938 Properties |
| 2018 | £163,274 | 6% |
1,792 Properties |
| 2017 | £152,841 | 0,1% |
1,869 Properties |
| 2016 | £152,759 | -0,1% |
1,757 Properties |
| 2015 | £152,908 | 5% |
1,603 Properties |
| 2014 | £145,833 | -3% |
1,588 Properties |
| 2013 | £150,567 | 0,1% |
1,365 Properties |
| 2012 | £150,380 | -2% |
1,301 Properties |
| 2011 | £152,973 | -1% |
1,235 Properties |
| 2010 | £154,259 | 4% |
1,261 Properties |
| 2009 | £147,672 | 5% |
1,273 Properties |
| 2008 | £140,925 | -8% |
1,757 Properties |
| 2007 | £151,575 | -1% |
2,153 Properties |
| 2006 | £152,553 | 19% |
2,528 Properties |
| 2005 | £123,048 | 18% |
2,360 Properties |
| 2004 | £101,296 | 20% |
2,534 Properties |
| 2003 | £81,290 | 14% |
2,502 Properties |
| 2002 | £69,567 | 13% |
2,573 Properties |
| 2001 | £60,405 | - |
177 Properties |

