
Houses for sale & to rent in FK14 7HS, Mylne Avenue, Clackmannanshire East, Dollar
House Prices in FK14 7HS, Mylne Avenue, Clackmannanshire East
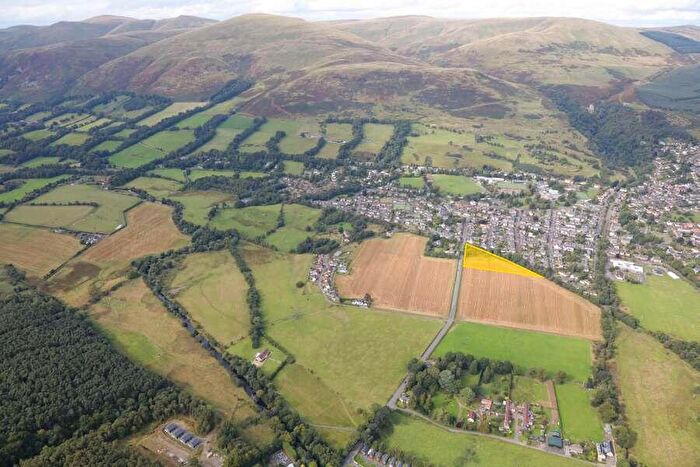
Properties in FK14 7HS have an average house price of £475k and had 2 Property Transactions within the last 3 years.¹ FK14 7HS is a postcode in Mylne Avenue located in Clackmannanshire East, an area in Dollar, Clackmannanshire, with 3 households², where the most expensive property was sold for £542k.
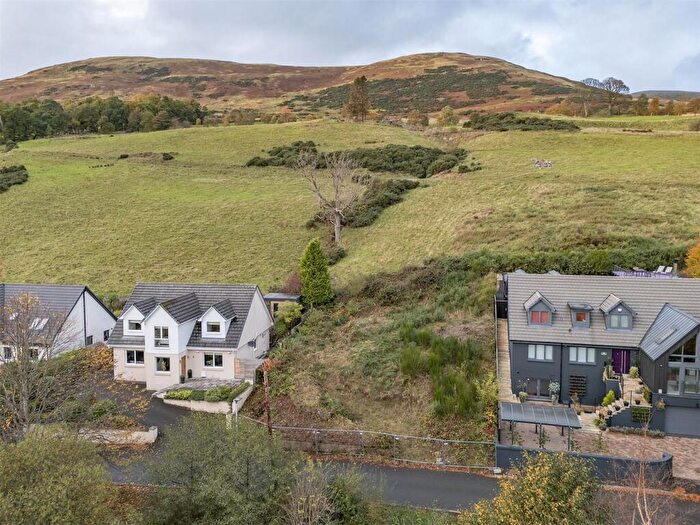
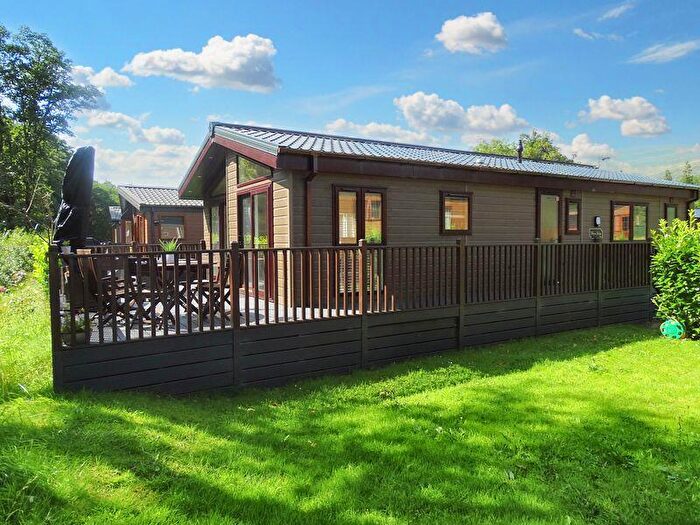
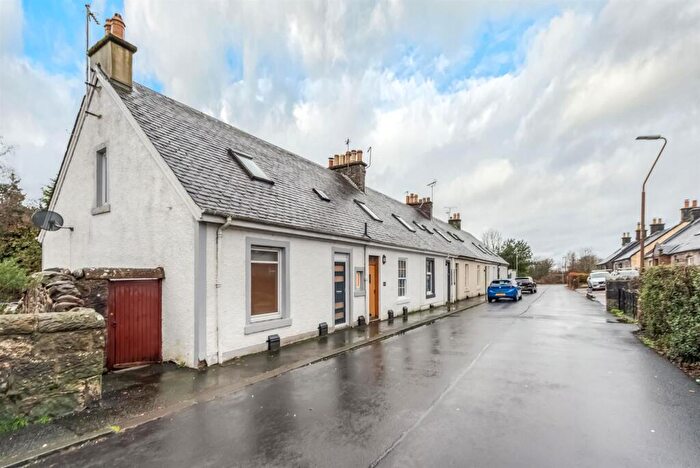
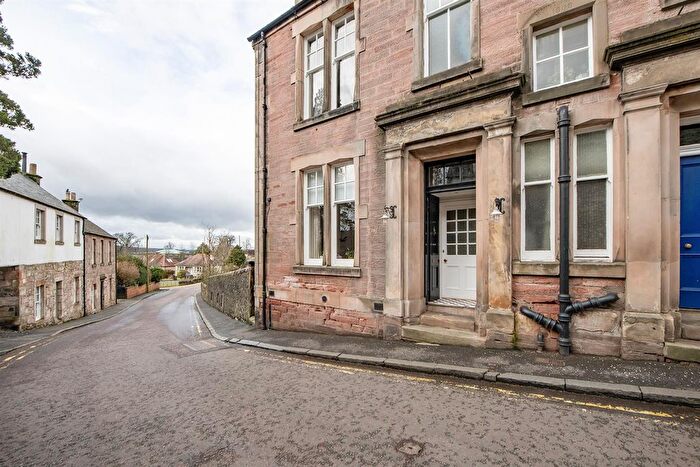
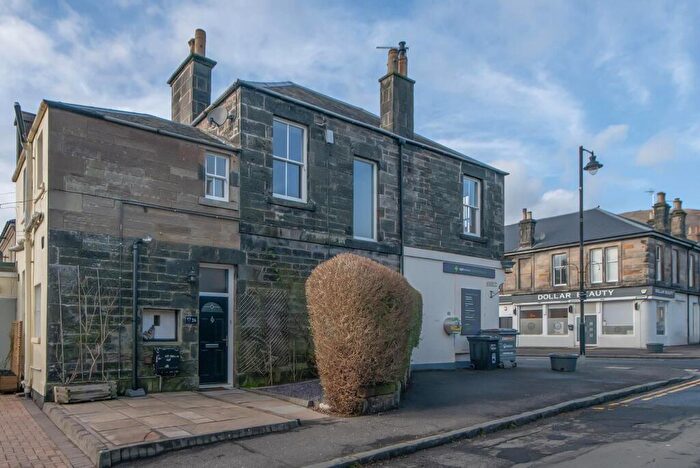
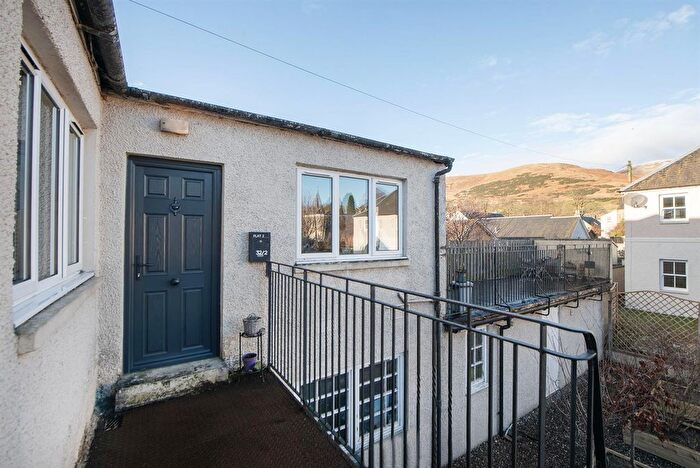
Properties for sale near FK14 7HS, Mylne Avenue
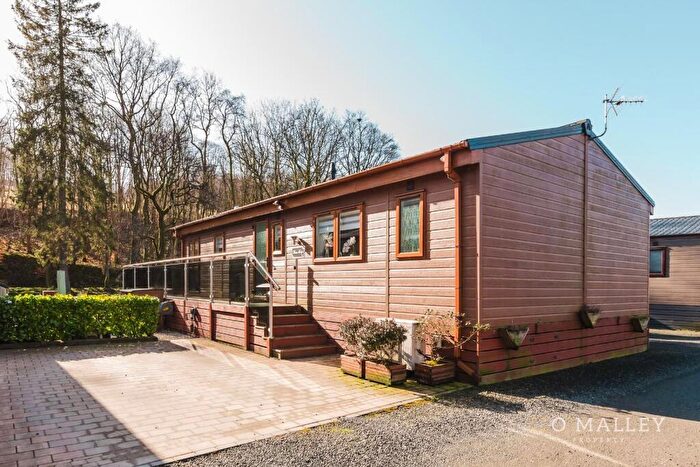
![]()
If you are looking to sell your house, let it out, or receive a property valuation, an expert can help you.
Click the button below to get started.

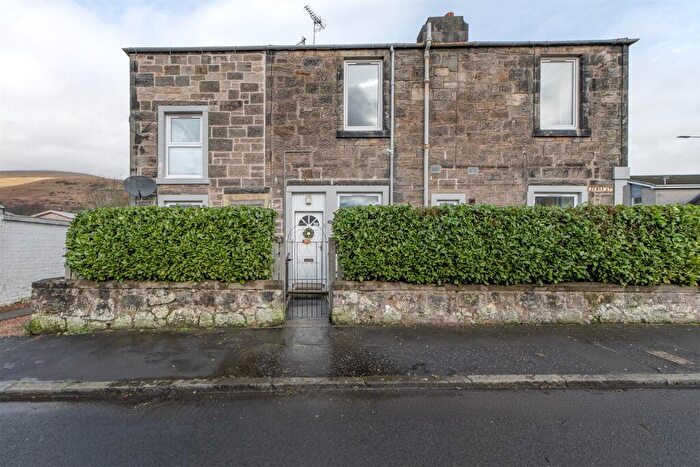
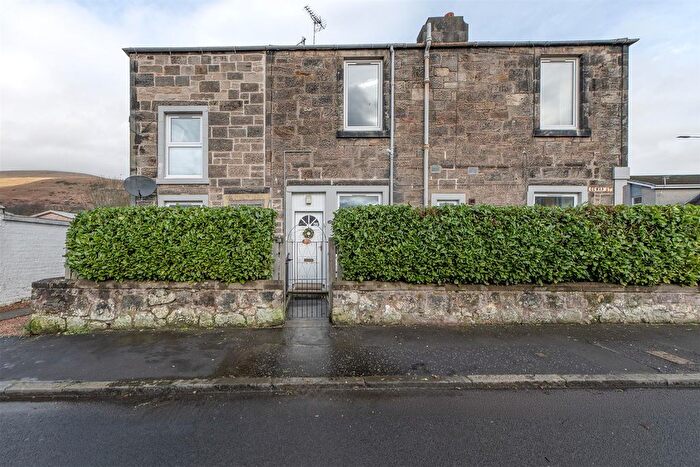
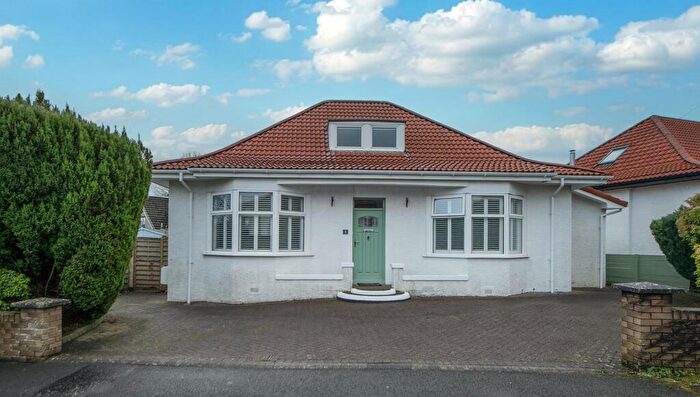
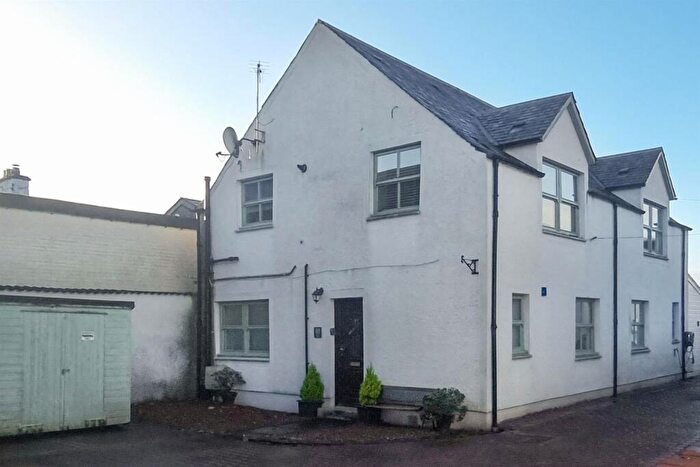
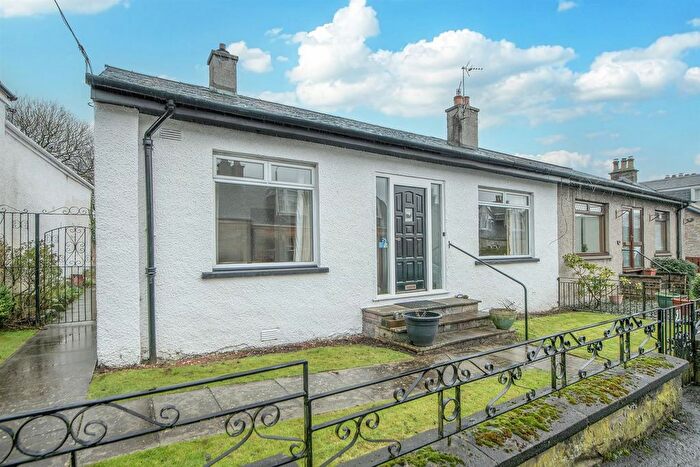
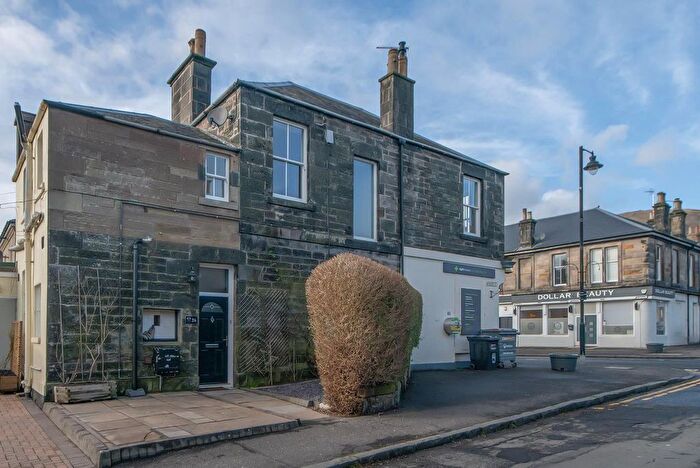
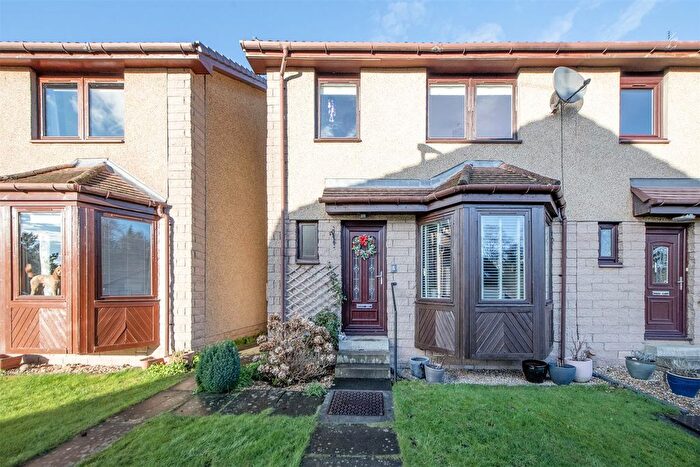
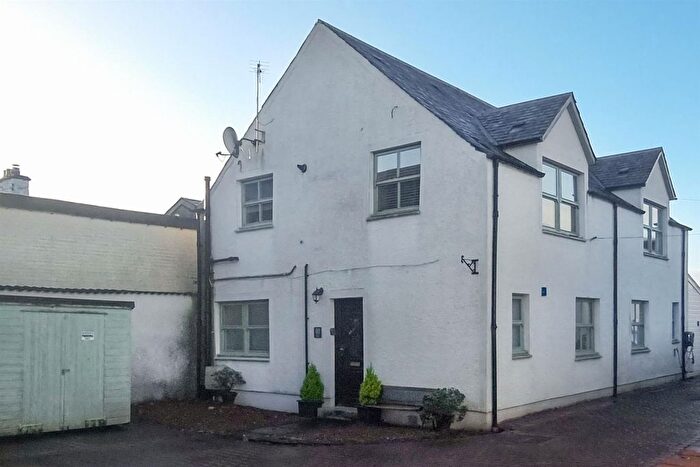
Previously listed properties near FK14 7HS, Mylne Avenue


![]()
If you are looking to sell your house, let it out, or receive a property valuation, an expert can help you.
Click the button below to get started.


Price Paid in Mylne Avenue, FK14 7HS, Clackmannanshire East
16 Mylne Avenue, FK14 7HS, Clackmannanshire East Dollar
Property 16 has been sold 2 times. The last time it was sold was in 02/10/2025 and the sold price was £542,000.00.
This is a Property which was sold as a New Build in 02/10/2025
| Date | Price | Classification |
|---|---|---|
| 02/10/2025 | £542,000.00 | New Build |
| 08/12/2015 | £277,500.00 | Established Building |
10 Mylne Avenue, FK14 7HS, Clackmannanshire East Dollar
Property 10 has been sold 2 times. The last time it was sold was in 12/05/2023 and the sold price was £408,000.00.
This is a Property which was sold as a New Build in 12/05/2023
| Date | Price | Classification |
|---|---|---|
| 12/05/2023 | £408,000.00 | New Build |
| 25/01/2021 | £322,500.00 | Established Building |
Postcodes in Mylne Avenue, Clackmannanshire East
Navigate through other locations in Mylne Avenue, Clackmannanshire East, Dollar to see more property listings for sale or to rent.
Transport near FK14 7HS, Mylne Avenue
-
 Alloa Station
 -
Gleneagles Station
-
Stirling Station
-
Bridge Of Allan Station
-
Dunfermline Queen Margaret Station
-
Dunblane Station
-
Larbert Station
-
Dunfermline Station
-
Falkirk Grahamston Station
-
Camelon Station
House price paid reports for FK14 7HS, Mylne Avenue
Click on the buttons below to see price paid reports by year or property price:
- Price Paid By Year
Property Price Paid in FK14 7HS, Mylne Avenue by Year
The average sold property price by year was:
| Year | Average Sold Price | Price Change |
Sold Properties
|
|---|---|---|---|
| 2025 | £542,000 | 25% |
1 Property |
| 2023 | £408,000 | 21% |
1 Property |
| 2021 | £322,500 | 14% |
1 Property |
| 2015 | £277,500 | - |
1 Property |