
Houses for sale & to rent in Kinross-shire, Dollar
House Prices in Kinross-shire
Properties in Kinross-shire have an average house price of £383k and had 6 Property Transactions within the last 3 years¹.
Kinross-shire is an area in Dollar, Perth and Kinross with 197 households², where the most expensive property was sold for £920k.
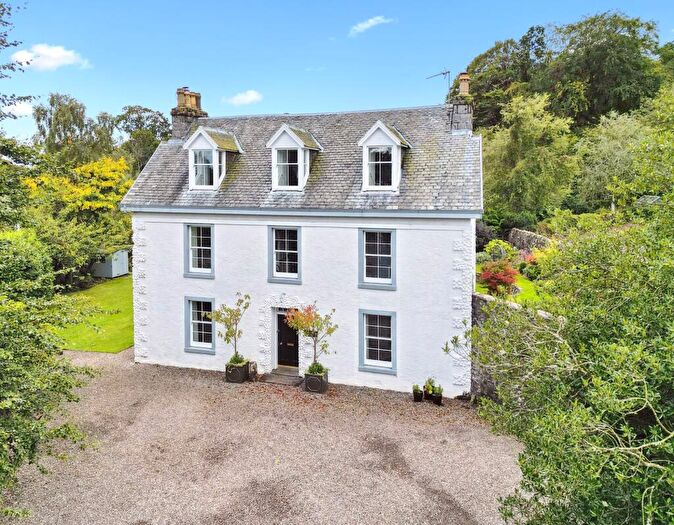
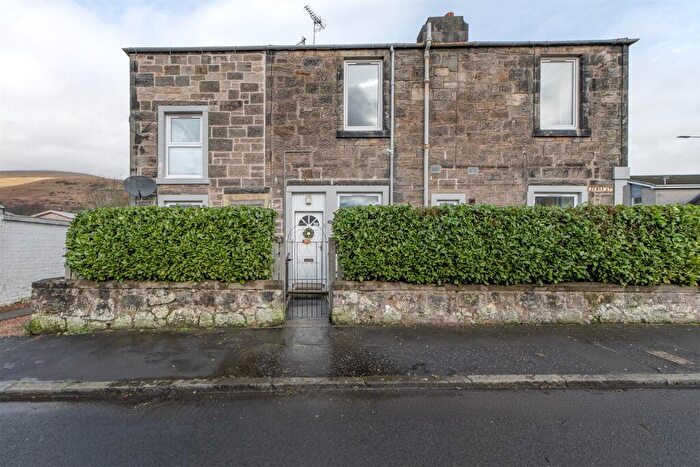
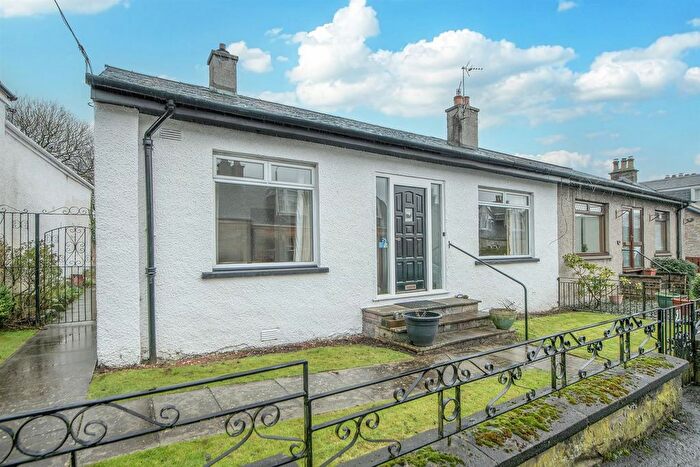
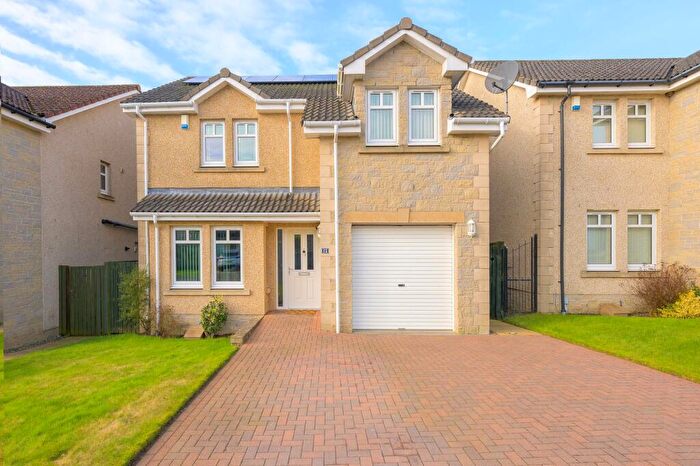
Properties for sale in Kinross-shire
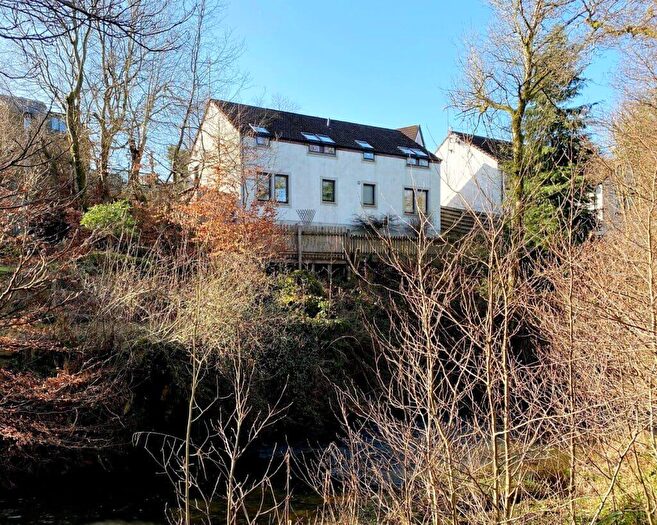

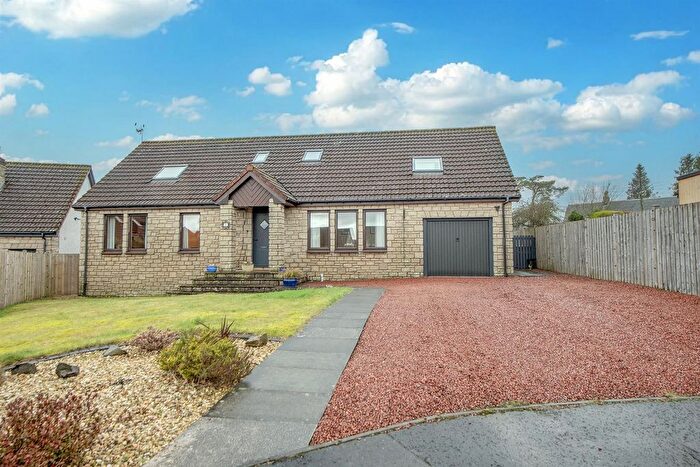
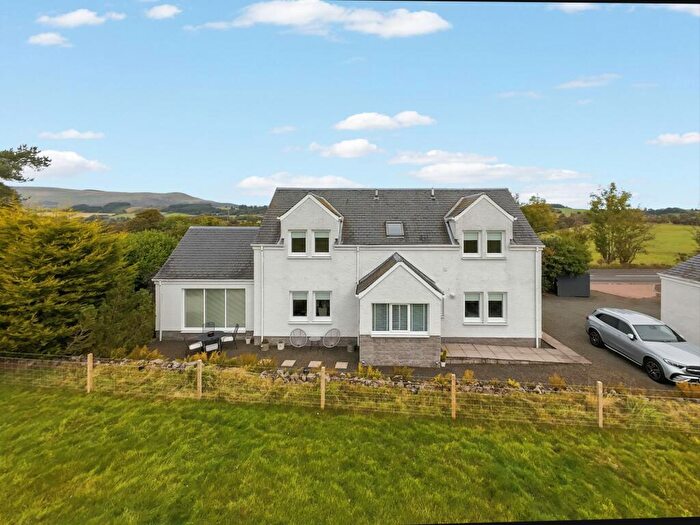
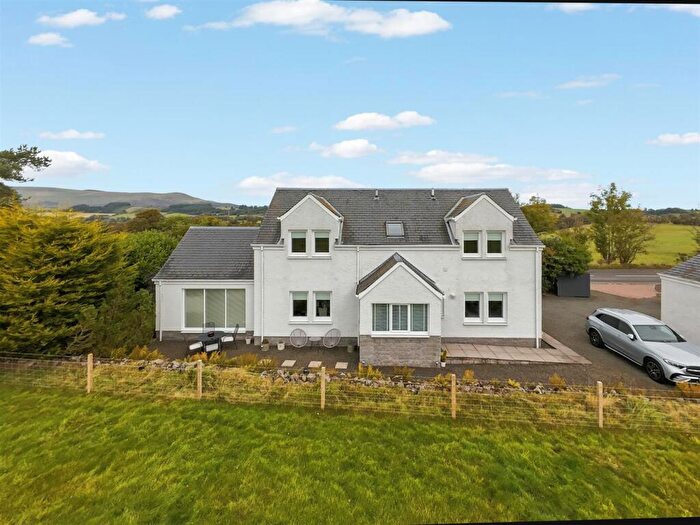
![]()
If you are looking to sell your house, let it out, or receive a property valuation, an expert can help you.
Click the button below to get started.


Roads and Postcodes in Kinross-shire
Navigate through our locations to find the location of your next house in Kinross-shire, Dollar for sale or to rent.
| Streets | Postcodes |
|---|---|
| Dunning Glen | FK14 7LD |
| Gairney Burn Lane | FK14 7PW |
| Gartwhinzean Loan | FK14 7LU |
| Gartwhinzean Road | FK14 7LW |
| Main Street | FK14 7NU |
| Mill Gardens | FK14 7LQ |
| Mossend Green | FK14 7NJ |
| Vicars Bridge Road | FK14 7LR |
| Windy Ridge | FK14 7PB |
| FK14 7LE FK14 7LP FK14 7NB FK14 7ND FK14 7NH FK14 7NL FK14 7NN FK14 7NP FK14 7NS FK14 7NT FK14 7NW FK14 7NX FK14 7NY FK14 7NZ FK14 7GZ |
Transport near Kinross-shire

- FAQ
- Price Paid By Year
Frequently asked questions about Kinross-shire
What is the average price for a property for sale in Kinross-shire?
The average price for a property for sale in Kinross-shire is £382,950. There are 707 property listings for sale in Kinross-shire.
Which train stations are available in or near Kinross-shire?
Some of the train stations available in or near Kinross-shire are Alloa, Dunfermline Queen Margaret and Dunfermline.
Property Price Paid in Kinross-shire by Year
The average sold property price by year was:
| Year | Average Sold Price | Price Change |
Sold Properties
|
|---|---|---|---|
| 2025 | £546,000 | 54% |
2 Properties |
| 2024 | £253,700 | -25% |
1 Property |
| 2023 | £317,333 | 1% |
3 Properties |
| 2022 | £315,458 | 12% |
12 Properties |
| 2021 | £276,754 | -1% |
21 Properties |
| 2020 | £279,444 | -41% |
9 Properties |
| 2019 | £395,083 | 44% |
6 Properties |
| 2018 | £219,443 | -8% |
9 Properties |
| 2017 | £237,209 | 10% |
12 Properties |
| 2016 | £213,827 | -11% |
8 Properties |
| 2015 | £237,771 | 23% |
17 Properties |
| 2014 | £183,093 | -56% |
8 Properties |
| 2013 | £285,342 | 28% |
6 Properties |
| 2012 | £204,202 | -9% |
8 Properties |
| 2011 | £223,000 | -25% |
4 Properties |
| 2010 | £278,500 | 31% |
2 Properties |
| 2009 | £193,500 | -5% |
5 Properties |
| 2008 | £203,475 | -38% |
18 Properties |
| 2007 | £281,791 | 34% |
13 Properties |
| 2006 | £187,267 | 10% |
13 Properties |
| 2005 | £169,100 | -15% |
10 Properties |
| 2004 | £194,863 | 17% |
11 Properties |
| 2003 | £161,735 | 35% |
15 Properties |
| 2002 | £104,906 | - |
16 Properties |