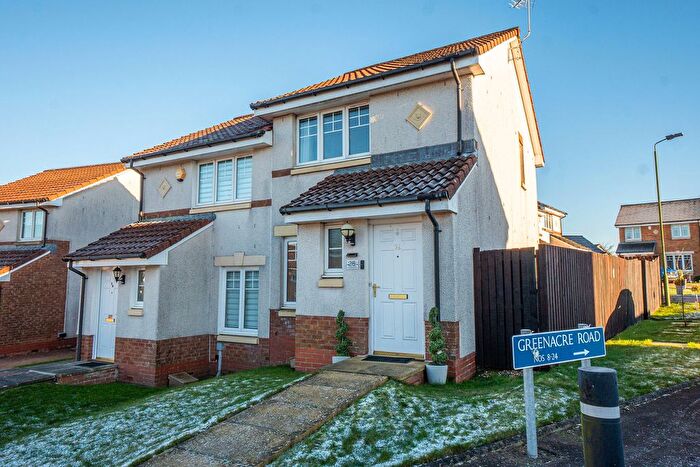
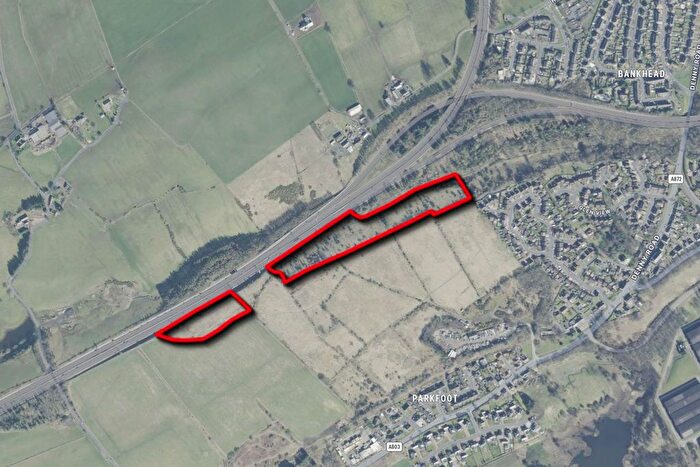
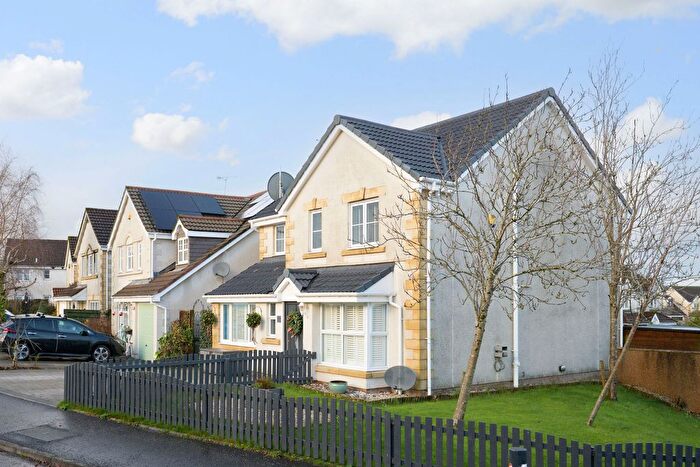
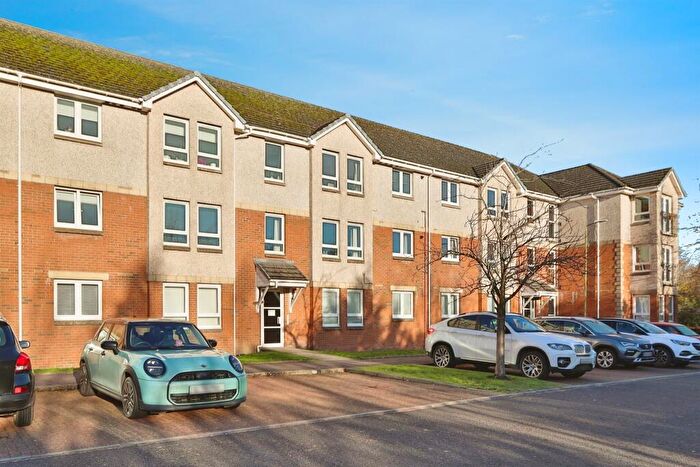
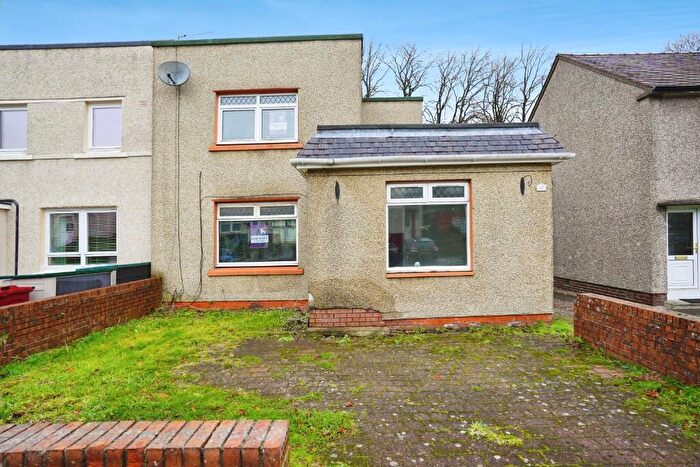
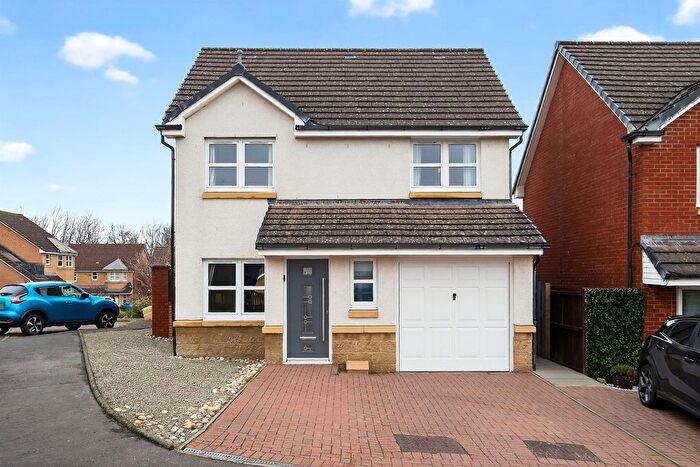
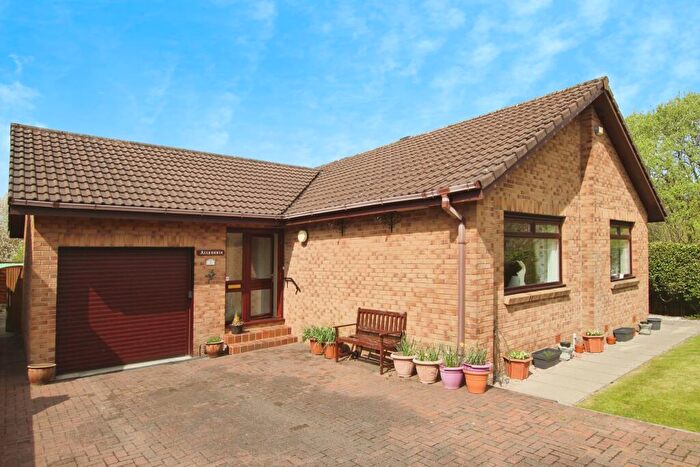
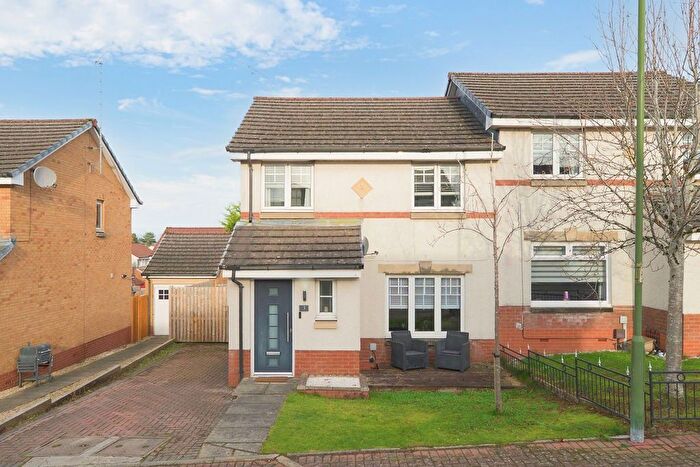
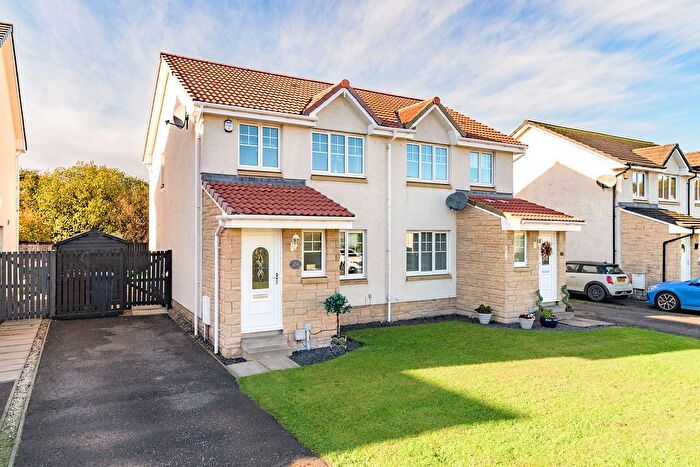
Houses for sale & to rent in Bonnybridge and Larbert, Bonnybridge
House Prices in Bonnybridge and Larbert
Properties in Bonnybridge and Larbert have an average house price of £168,111.00 and had 120 Property Transactions within the last 3 years¹.
Bonnybridge and Larbert is an area in Bonnybridge, Falkirk with 3,425 households², where the most expensive property was sold for £570,000.00.
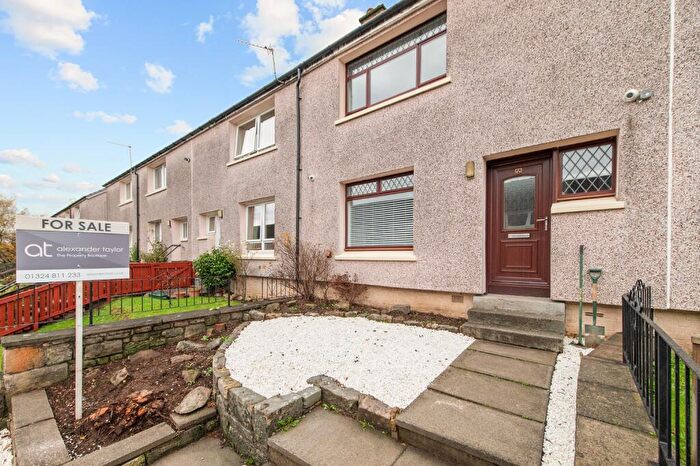
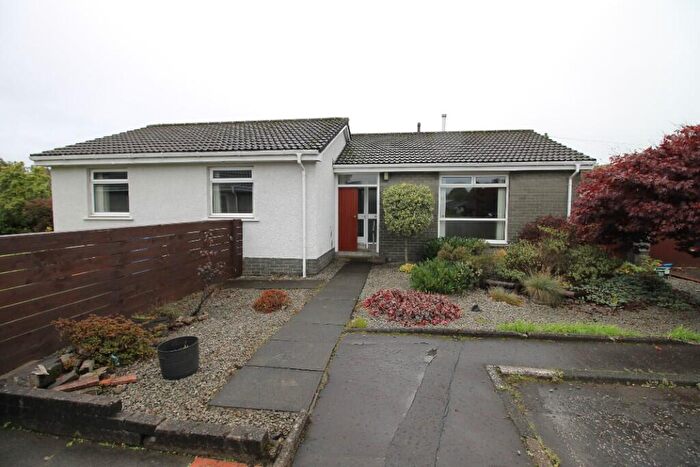
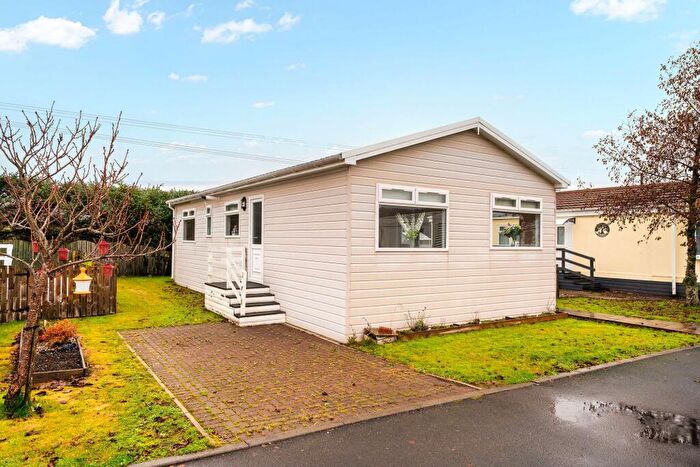
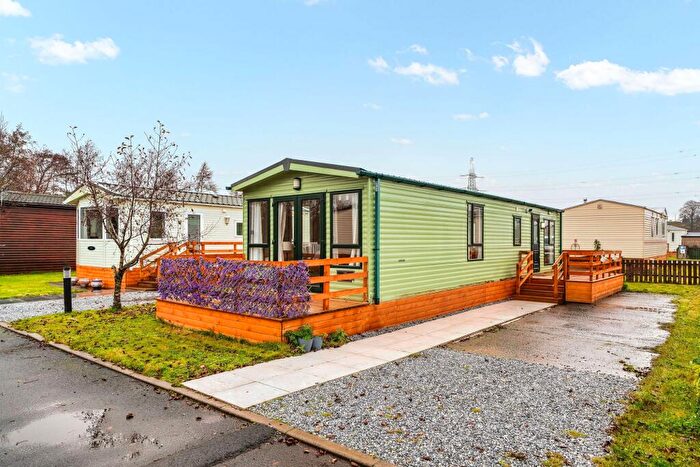
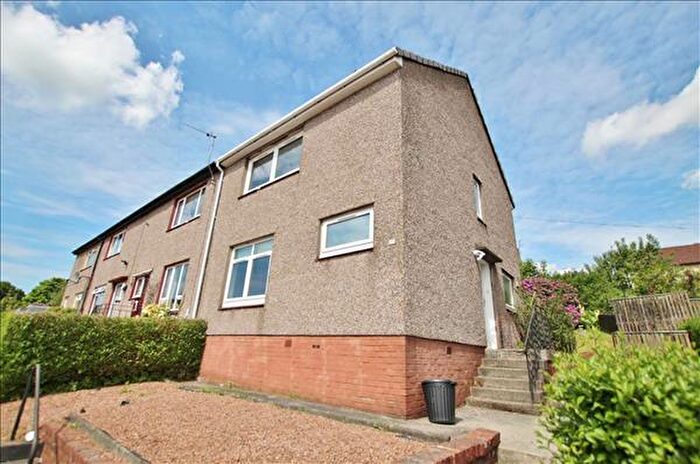
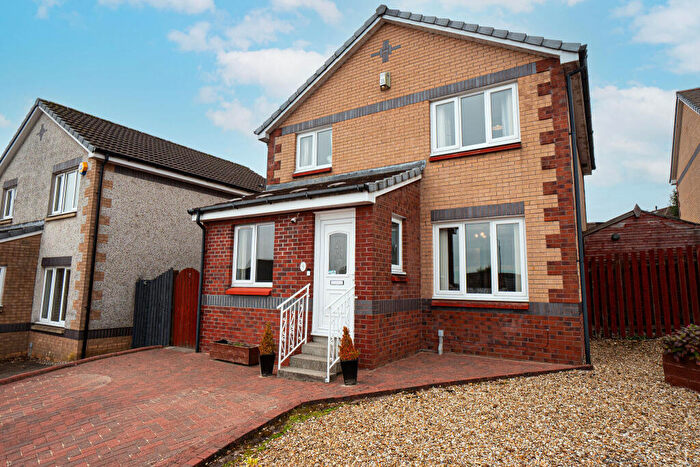
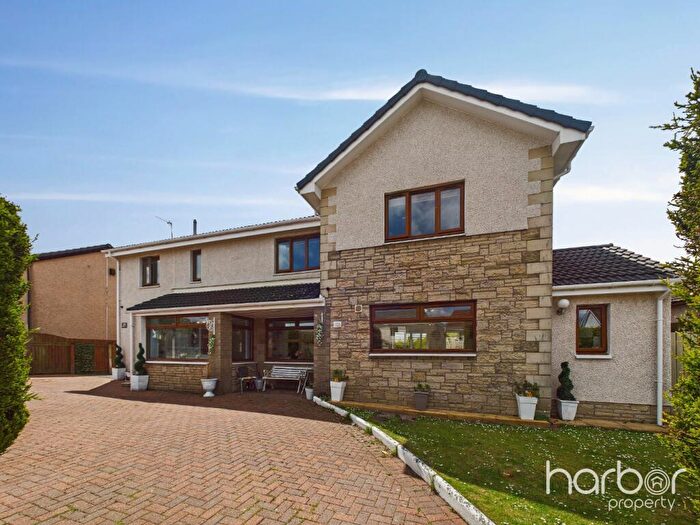
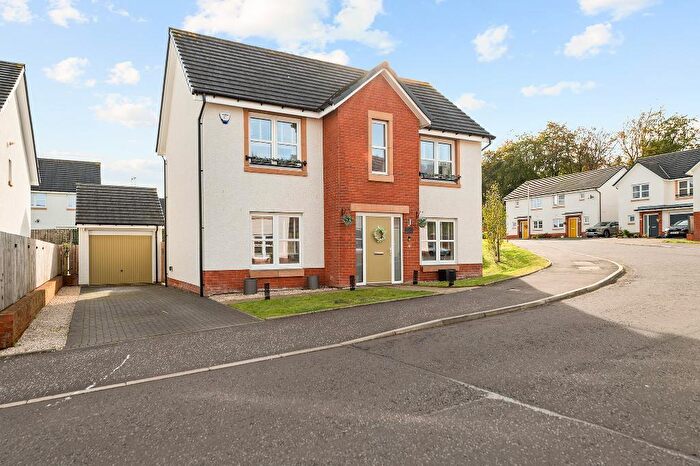
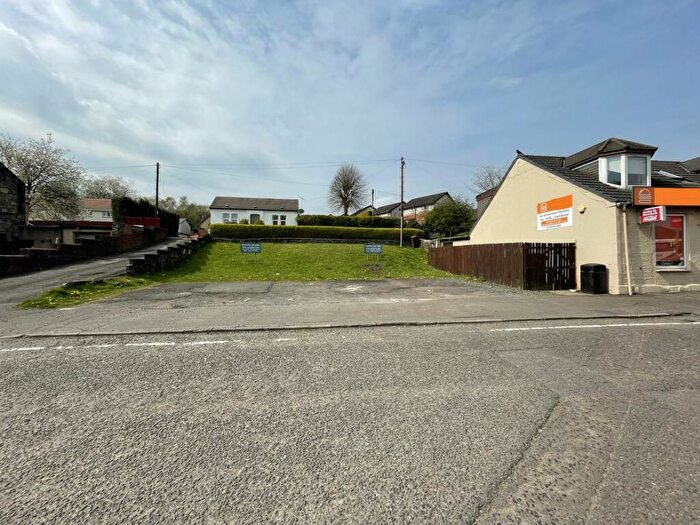
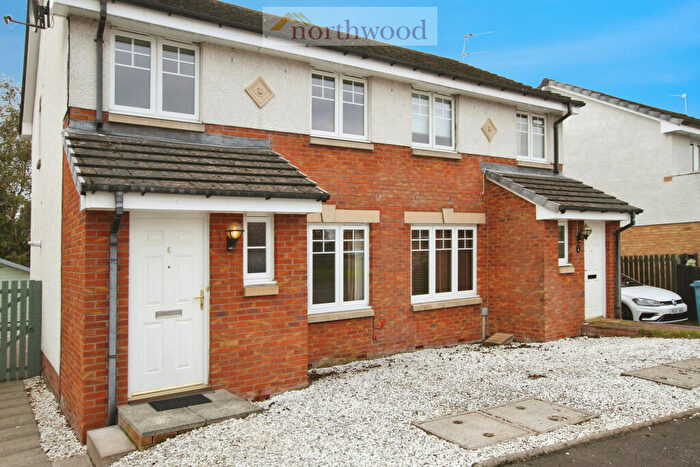
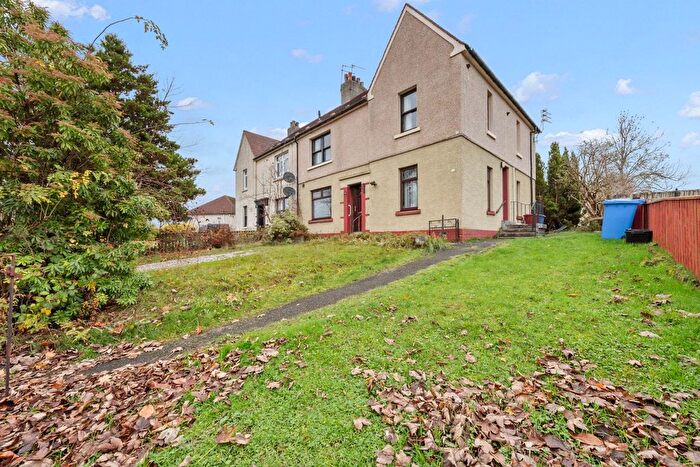
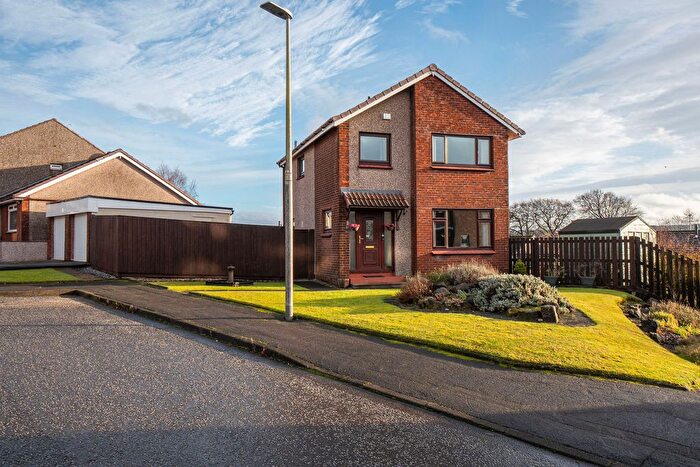
Properties for sale in Bonnybridge and Larbert
Previously listed properties in Bonnybridge and Larbert
Roads and Postcodes in Bonnybridge and Larbert
Navigate through our locations to find the location of your next house in Bonnybridge and Larbert, Bonnybridge for sale or to rent.
| Streets | Postcodes |
|---|---|
| Allan Place | FK4 2EZ |
| Alloway Crescent | FK4 1EY FK4 1EZ |
| Anderson Street | FK4 1AN |
| Antonine Grove | FK4 2DW |
| Ardgay Crescent | FK4 2FN |
| Ardgay Drive | FK4 2FH |
| Ardgay Road | FK4 2FL |
| Ardgay Terrace | FK4 2FP |
| Ashley Street | FK4 1NL |
| Atrium Way | FK4 2DP |
| Balfour Street | FK4 1NN FK4 1NP |
| Banton Place | FK4 2DT |
| Barley Hill | FK4 1AH |
| Bonnybridge Industrial Estate | FK4 2BW |
| Bonnyfield Road | FK4 1DL FK4 1DR |
| Bonnymill Place | FK4 2GA |
| Bonnymill Terrace | FK4 2EW |
| Bonnymuir Crescent | FK4 1GD |
| Bonnymuir Place | FK4 2GD |
| Bonnyside Road | FK4 2AA FK4 2AB FK4 2AD FK4 2AE FK4 2AG |
| Bonnyvale Place | FK4 1DG |
| Bonnyview Gardens | FK4 1PW |
| Bonnywood Avenue | FK4 1NS FK4 1NT FK4 1NU |
| Bowling Green Place | FK4 1DS |
| Bridge Street | FK4 1AA FK4 1AB FK4 1AD |
| Broomhill Road | FK4 2AH FK4 2AJ FK4 2AN FK4 2AT FK4 2AY FK4 2FA |
| Caledonia Terrace | FK4 1DQ |
| Chacefield Street | FK4 1PR FK4 1PS |
| Church Street | FK4 2AZ |
| Claremont Street | FK4 1NJ |
| Corona Crescent | FK4 1GG |
| Cowan Street | FK4 1ND |
| Cowden Hill Gardens | FK4 1AQ |
| Dickburn Crescent | FK4 1DJ |
| Drummond Place | FK4 1PT |
| Duncairn Avenue | FK4 1EA FK4 1EB |
| Duncan Street | FK4 1DP |
| Dunure Crescent | FK4 1EG |
| Dunure Street | FK4 1EF |
| Dunvegan Place | FK4 1EX |
| Emma's Way | FK4 1GF |
| Fairfield Avenue | FK4 1LU FK4 1LX |
| Fairways Place | FK4 1PZ |
| Falkirk Road | FK4 1BA FK4 1BB FK4 1BD FK4 1BG FK4 1BH FK4 1SN |
| Fergusson Grove | FK4 1PU |
| Ford Road | FK4 1LJ |
| Foundry Road | FK4 2AP |
| Foxdale Avenue | FK4 2FD |
| Foxdale Court | FK4 2FF |
| Foxdale Drive | FK4 2FE |
| Foxdale Place | FK4 2FB |
| Gateside Avenue | FK4 1AX FK4 1AY |
| Glenmore Drive | FK4 1EU |
| Glenyards Road | FK4 2EA FK4 2EB |
| Grahamsdyke Crescent | FK4 2DH |
| Grahamsdyke Road | FK4 2DF |
| Greenacre Drive | FK4 2BF |
| Greenacre Place | FK4 2BJ |
| Greenacre Road | FK4 2BE |
| Greenfield Street | FK4 1PF |
| Greenhill Road | FK4 2DG FK4 2DN FK4 2DR |
| Greenhill Square | FK4 2EG |
| Harley Gardens | FK4 2BQ |
| High Street | FK4 1BX FK4 1BY FK4 1DA FK4 1DB FK4 1DH |
| Highland Dykes Crescent | FK4 1ES |
| Highland Dykes Drive | FK4 1PD FK4 1PE |
| Hillview Road | FK4 2BD FK4 2EH FK4 2ER |
| Hope Park Terrace | FK4 1DY |
| Hunter Gardens | FK4 2BH |
| Jubilee Way | FK4 1GE |
| Lade Road | FK4 1DD |
| Larbert Road | FK4 1DW FK4 1ED FK4 1EE FK4 1EJ FK4 1EL FK4 1EN FK4 1EP FK4 1ER FK4 1NY |
| Laurel Grove | FK4 2ED FK4 2EE |
| Laurel Place | FK4 2DY |
| Laurelbank Avenue | FK4 2DS |
| Leapark Drive | FK4 2DU FK4 2DX |
| Lochinvar Place | FK4 2BL |
| Main Street | FK4 1AF FK4 1AG FK4 1AJ FK4 1AL FK4 1BT |
| Mannfield Avenue | FK4 2DA |
| Margaret Drive | FK4 1LT |
| Millar Place | FK4 2AR |
| Milnquarter Road | FK4 2FG |
| Moffat Place | FK4 2EX |
| Morrison Avenue | FK4 1ET |
| Norwood Avenue | FK4 1PQ FK4 1PY |
| Norwood Court | FK4 1NW |
| Norwood Place | FK4 1PX |
| Ochil Gardens | FK4 2EF |
| Park Street | FK4 2AS |
| Paterson Place | FK4 1BE |
| Peathill Road | FK4 1LS FK4 1LY |
| Peathill Terrace | FK4 1LN |
| Primrose Street | FK4 1PH |
| Princess Street | FK4 1BJ |
| Reilly Gardens | FK4 2BB |
| Robertson Avenue | FK4 1PA FK4 1PB |
| Roman Road | FK4 2DD FK4 2DE FK4 2FJ |
| Rose Street | FK4 1PG |
| Seabegs Crescent | FK4 2DB |
| Seabegs Place | FK4 2BY |
| Seabegs Road | FK4 2AQ FK4 2BN FK4 2BP FK4 2BS FK4 2BT FK4 2BX |
| Skene Street | FK4 1NF |
| Smeaton Drive | FK4 1AS |
| Spence Street | FK4 1NH |
| Stewart Street | FK4 1DN |
| Thornton Avenue | FK4 1AP FK4 1AR FK4 1AU FK4 1AW |
| Ure Crescent | FK4 1NA FK4 1NB FK4 1NE FK4 1NG FK4 1NR |
| Vale Of Bonny View | FK4 1BN FK4 1BP |
| Waverley Crescent | FK4 2AX |
| Wellpark Terrace | FK4 1DE FK4 1LR |
| Wellstood Court | FK4 1BQ |
| Wheatlands Avenue | FK4 1PJ FK4 1PL FK4 1PN FK4 1PP |
| Wilson Place | FK4 2AU |
| Woodburn Crescent | FK4 2DJ FK4 2DL |
| Woodlea Gardens | FK4 1DF |
| FK4 1LW FK4 2BA FK4 2EJ FK4 2EP FK4 2ET FK4 2EU FK4 2EY FK4 2HA FK4 2HB |
Transport near Bonnybridge and Larbert
- FAQ
- Price Paid By Year
Frequently asked questions about Bonnybridge and Larbert
What is the average price for a property for sale in Bonnybridge and Larbert?
The average price for a property for sale in Bonnybridge and Larbert is £168,111. This amount is 2% lower than the average price in Bonnybridge. There are 528 property listings for sale in Bonnybridge and Larbert.
Which train stations are available in or near Bonnybridge and Larbert?
Some of the train stations available in or near Bonnybridge and Larbert are Larbert, Camelon and Falkirk High.
Property Price Paid in Bonnybridge and Larbert by Year
The average sold property price by year was:
| Year | Average Sold Price | Price Change |
Sold Properties
|
|---|---|---|---|
| 2023 | £161,185 | -5% |
19 Properties |
| 2022 | £169,413 | 5% |
101 Properties |
| 2021 | £160,359 | 7% |
106 Properties |
| 2020 | £148,368 | 7% |
100 Properties |
| 2019 | £138,422 | -8% |
129 Properties |
| 2018 | £149,134 | 8% |
153 Properties |
| 2017 | £136,652 | 11% |
167 Properties |
| 2016 | £121,661 | 9% |
140 Properties |
| 2015 | £110,133 | 1% |
119 Properties |
| 2014 | £108,877 | -1% |
120 Properties |
| 2013 | £109,542 | -7% |
115 Properties |
| 2012 | £117,460 | 7% |
92 Properties |
| 2011 | £109,190 | -3% |
91 Properties |
| 2010 | £112,294 | -1% |
85 Properties |
| 2009 | £113,641 | 1% |
71 Properties |
| 2008 | £112,720 | -21% |
141 Properties |
| 2007 | £136,672 | 19% |
212 Properties |
| 2006 | £111,311 | 20% |
218 Properties |
| 2005 | £89,012 | -4% |
240 Properties |
| 2004 | £92,566 | 20% |
269 Properties |
| 2003 | £73,646 | 8% |
303 Properties |
| 2002 | £68,045 | -114% |
195 Properties |
| 2001 | £145,603 | - |
14 Properties |

