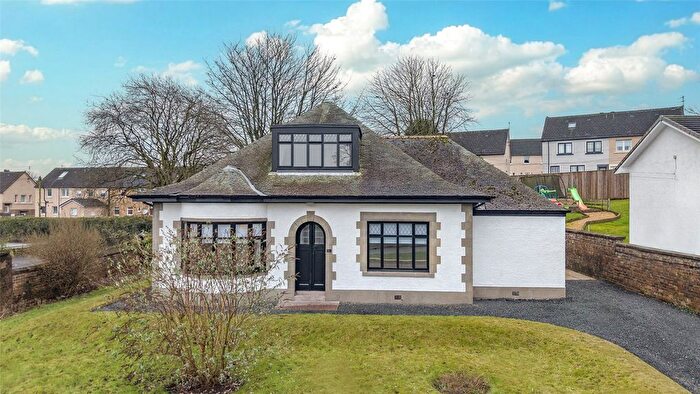
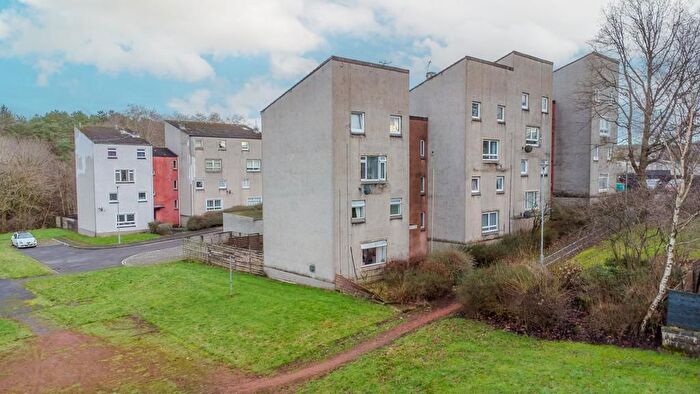
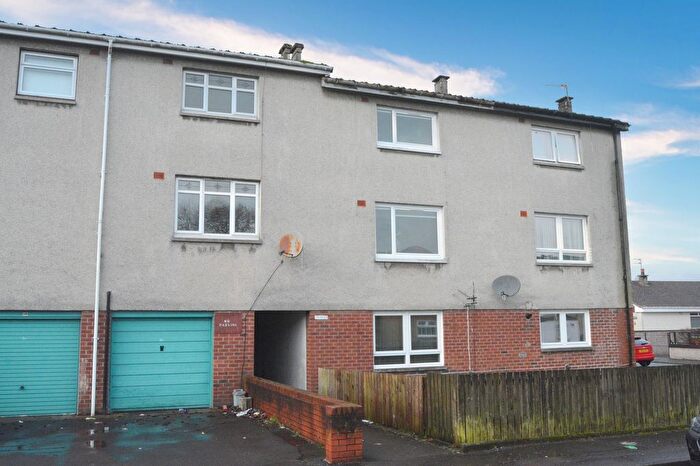
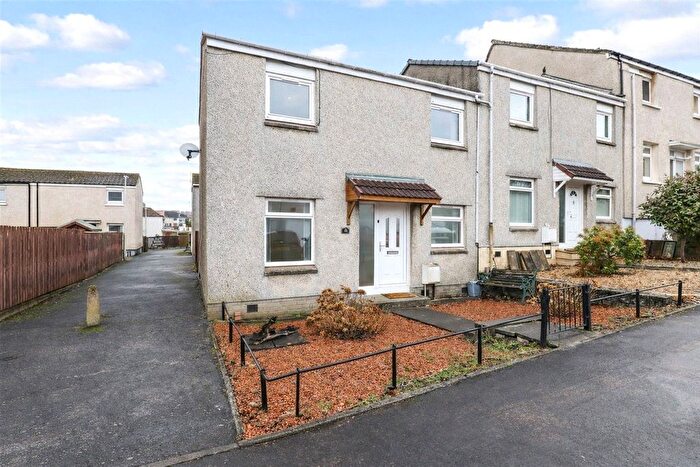
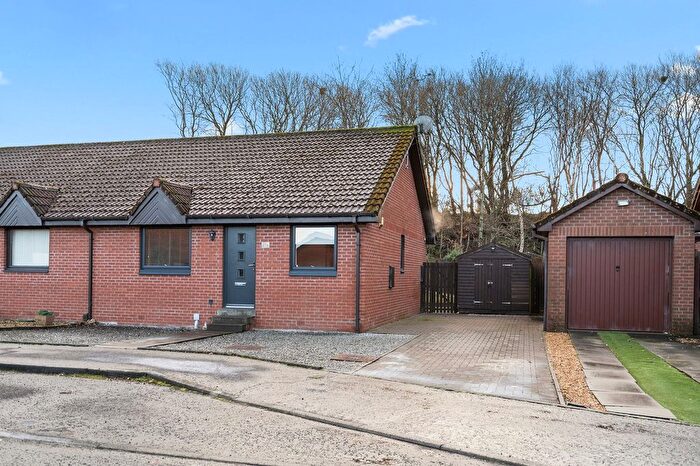
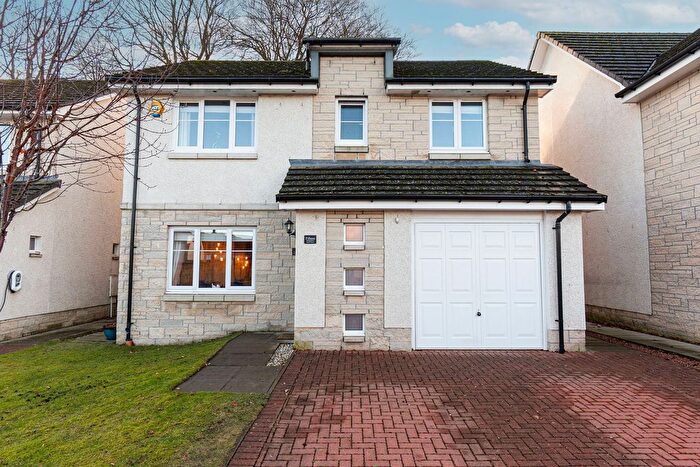
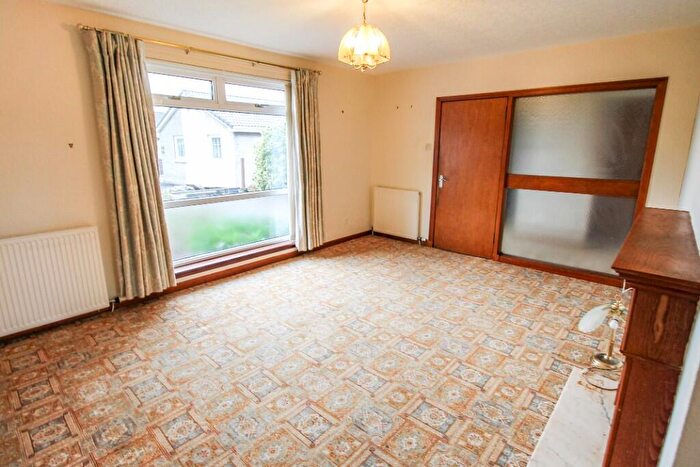
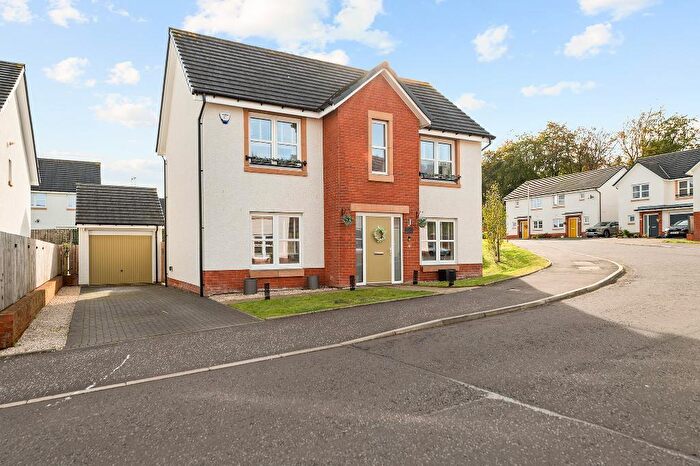
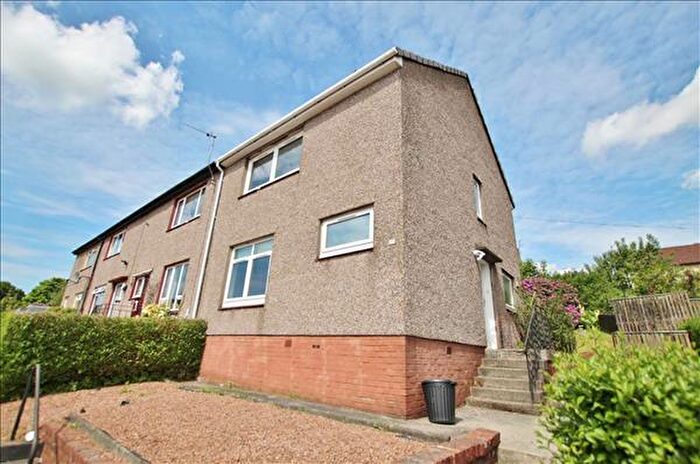
Houses for sale & to rent in Denny and Banknock, Bonnybridge
House Prices in Denny and Banknock
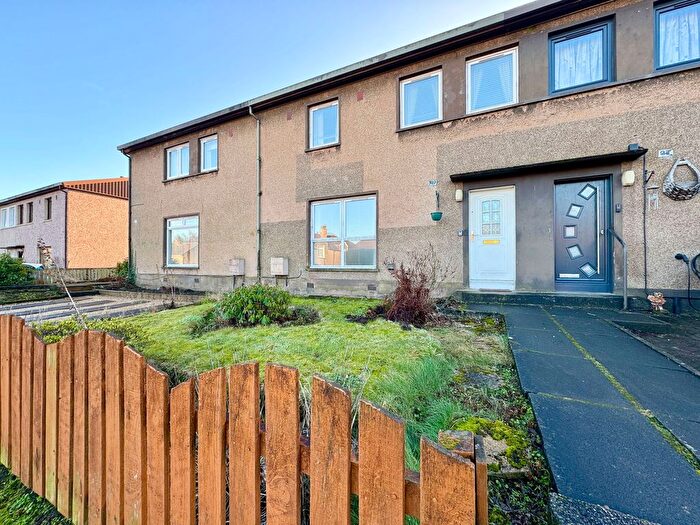
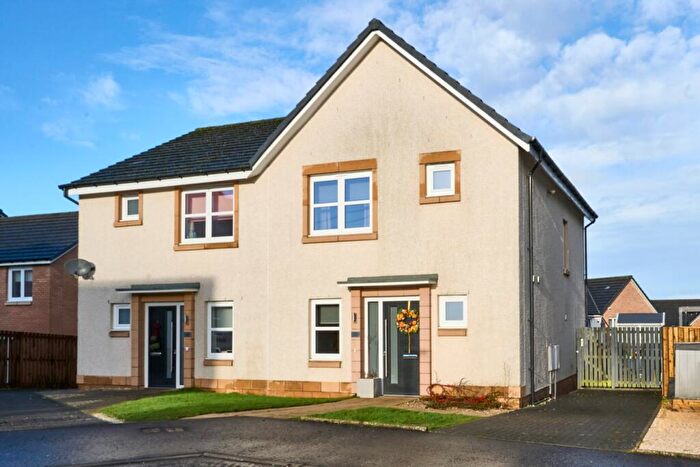
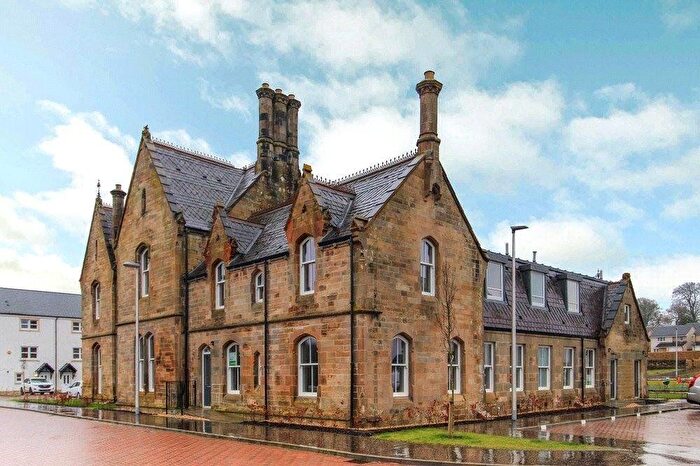
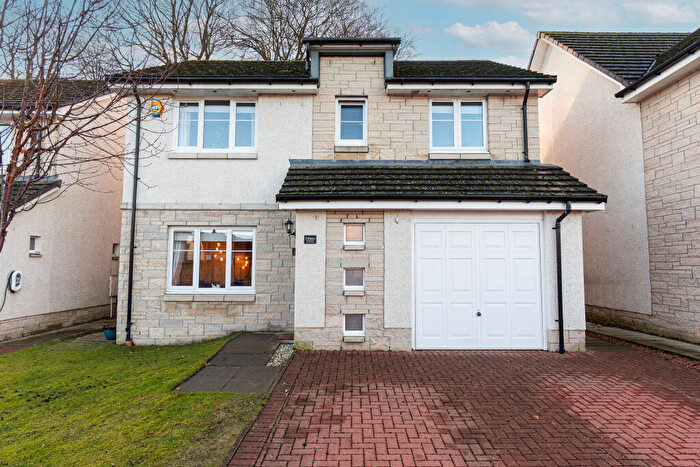
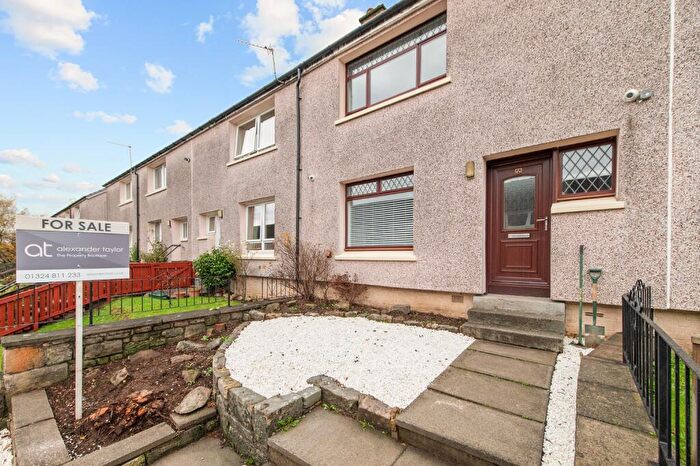
Properties in Denny and Banknock have an average house price of £140,909.00 and had 10 Property Transactions within the last 3 years¹.
Denny and Banknock is an area in Bonnybridge, Falkirk with 2,075 households², where the most expensive property was sold for £260,000.00.
Properties for sale in Denny and Banknock
Roads and Postcodes in Denny and Banknock
Navigate through our locations to find the location of your next house in Denny and Banknock, Bonnybridge for sale or to rent.
| Streets | Postcodes |
|---|---|
| Allandale Cottages | FK4 2HE FK4 2HF |
| Almond Drive | FK4 1JZ |
| Anderson Terrace | FK4 1QD |
| Antonine Gate | FK4 2HS |
| Ash Place | FK4 1TY |
| Auchincloch Drive | FK4 1LA FK4 1LB |
| Ballinkier Avenue | FK4 1JH |
| Bankhead Crescent | FK4 1RX FK4 1RY FK4 1RZ |
| Bankier Road | FK4 1JE FK4 1JT FK4 1TF |
| Bankier Terrace | FK4 1JF FK4 1JG |
| Bankview Terrace | FK4 1SF |
| Belmont Avenue | FK4 1SS |
| Bog Road | FK4 1TJ FK4 1TL |
| Bonnybridge Road | FK4 1RL FK4 1RN |
| Braeface Road | FK4 1UB FK4 1UE |
| Broomridge Place | FK4 1TQ |
| By Pass Road | FK4 1RR FK4 1RS |
| Castlehill Crescent | FK4 1JS |
| Castleview Terrace | FK4 1HR FK4 1HS |
| Cedar Road | FK4 1JQ |
| Cherry Lane | FK4 1JY |
| Coneypark Crescent | FK4 1TT FK4 1TU |
| Coneypark Place | FK4 1TZ |
| Cumbernauld Road | FK4 1QJ |
| Denny Road | FK4 1RG FK4 1RH FK4 1RP |
| Dundas Cottages | FK4 2HL |
| Elmbank Crescent | FK4 1RU |
| Garngrew Road | FK4 1HP |
| Glasgow Road | FK4 1QF FK4 1QG FK4 1QH FK4 1QL FK4 1QN FK4 1QP FK4 1QR FK4 1QS FK4 1QT FK4 1QW FK4 1QX FK4 1QY FK4 1UR FK4 1QQ |
| Glen View | FK4 1RJ |
| Glenview Avenue | FK4 1JU FK4 1JX |
| Hawthorn Drive | FK4 1LF |
| Hazel Road | FK4 1LH FK4 1LQ |
| Hillhead Avenue | FK4 1JN |
| Hogan Place | FK4 1FB |
| Hoggan Court | FK4 1UJ |
| Hoggan Path | FK4 1UL |
| Hollandbush Avenue | FK4 1JB FK4 1JJ |
| Hollandbush Crescent | FK4 1JL FK4 1LD |
| Holly Grove | FK4 1LG |
| Hyslop Place | FK4 1SH |
| James Street | FK4 1HG |
| John Bassy Drive | FK4 1TN |
| John Street | FK4 1HJ |
| Kelvinview Avenue | FK4 1JR |
| Kerr Crescent | FK4 1HH |
| Kilsyth Road | FK4 1HA FK4 1HB FK4 1HD FK4 1HE FK4 1HN FK4 1HX FK4 1HY FK4 1JD FK4 1QA FK4 1QB FK4 1UF FK4 1UH |
| Laburnum Road | FK4 1SU FK4 1SY |
| Larch Drive | FK4 1HW |
| Laurel Square | FK4 1SW |
| Lind Place | FK4 1NQ |
| Linden Drive | FK4 1LE |
| Loanhead Avenue | FK4 1SA |
| Lyoncross | FK4 1UG |
| Maple Place | FK4 1SP |
| Margaret Avenue | FK4 1HT |
| Mayfield Drive | FK4 1QE |
| Mcvean Place | FK4 1QZ |
| Mochray Court | FK4 1FE |
| Montrose Way | FK4 1SJ |
| Park Avenue | FK4 1RT FK4 1SB FK4 1SD FK4 1SE |
| Pearson Avenue | FK4 1RQ |
| Pearson Place | FK4 1RD |
| Quarrie Road | FK4 1TR |
| Rankin Crescent | FK4 1RA |
| Rowan Drive | FK4 1TB |
| Russell Place | FK4 1SL |
| Singers Place | FK4 1FD |
| Station Road | FK4 1RE FK4 1RF |
| Thorndale Gardens | FK4 2HG |
| Viewfield Road | FK4 1TG FK4 1TH |
| Walker Drive | FK4 1RW |
| Watson Place | FK4 2BG |
| Wellpark Road | FK4 1TP |
| Willow Drive | FK4 1JW |
| Wyneford Road | FK4 1UD |
| FK4 1ST FK4 1SX FK4 1SZ FK4 1TA FK4 1TD FK4 1TX FK4 1UA FK4 2HD FK4 2HH FK4 2HJ FK4 2HN FK4 2HP FK4 2HR FK4 1BF |
Transport near Denny and Banknock
- FAQ
- Price Paid By Year
Frequently asked questions about Denny and Banknock
What is the average price for a property for sale in Denny and Banknock?
The average price for a property for sale in Denny and Banknock is £140,909. This amount is 9% lower than the average price in Bonnybridge. There are 1,004 property listings for sale in Denny and Banknock.
Which train stations are available in or near Denny and Banknock?
Some of the train stations available in or near Denny and Banknock are Cumbernauld, Larbert and Greenfaulds.
Property Price Paid in Denny and Banknock by Year
The average sold property price by year was:
| Year | Average Sold Price | Price Change |
Sold Properties
|
|---|---|---|---|
| 2023 | £140,909 | -29% |
10 Properties |
| 2022 | £181,446 | 10% |
58 Properties |
| 2021 | £163,880 | 1% |
87 Properties |
| 2020 | £161,749 | 9% |
69 Properties |
| 2019 | £146,914 | -9% |
76 Properties |
| 2018 | £159,735 | 15% |
68 Properties |
| 2017 | £135,500 | 11% |
69 Properties |
| 2016 | £119,922 | -7% |
67 Properties |
| 2015 | £128,654 | 4% |
77 Properties |
| 2014 | £123,312 | 6% |
80 Properties |
| 2013 | £115,547 | 2% |
67 Properties |
| 2012 | £112,659 | -30% |
50 Properties |
| 2011 | £146,157 | 16% |
59 Properties |
| 2010 | £122,304 | 8% |
50 Properties |
| 2009 | £112,128 | -27% |
53 Properties |
| 2008 | £142,457 | -14% |
78 Properties |
| 2007 | £161,933 | 31% |
100 Properties |
| 2006 | £111,726 | 25% |
144 Properties |
| 2005 | £83,371 | -4% |
126 Properties |
| 2004 | £86,469 | 43% |
109 Properties |
| 2003 | £48,930 | -11% |
110 Properties |
| 2002 | £54,294 | 8% |
145 Properties |
| 2001 | £50,182 | - |
15 Properties |

