
Houses for sale & to rent in Carse, Kinnaird and Tryst, Stirling
House Prices in Carse, Kinnaird and Tryst
Properties in Carse, Kinnaird and Tryst have an average house price of £253k and had 4 Property Transactions within the last 3 years¹.
Carse, Kinnaird and Tryst is an area in Stirling, Falkirk with 52 households², where the most expensive property was sold for £307k.
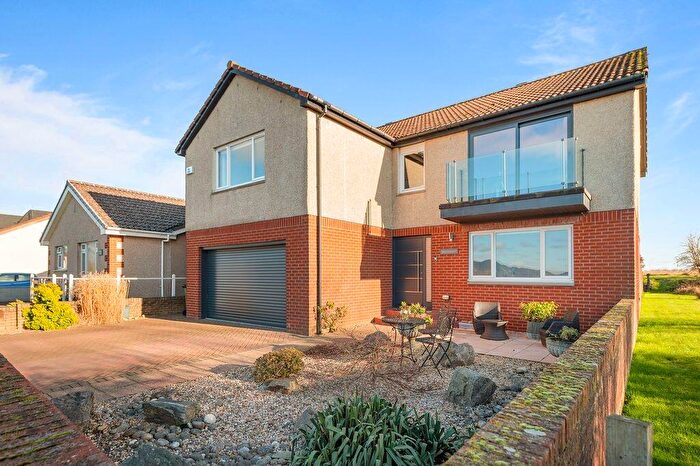
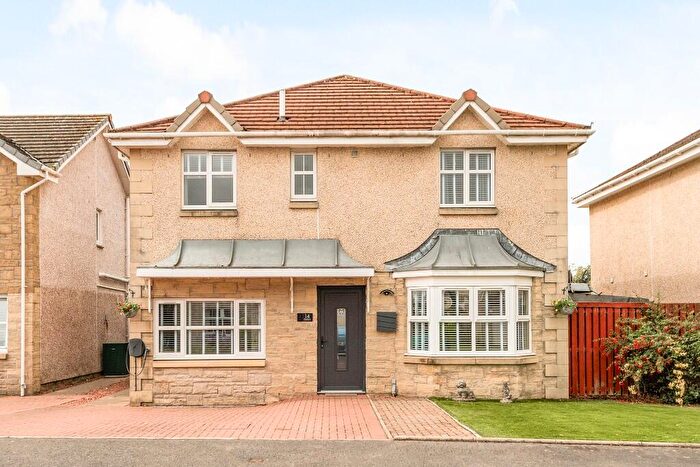
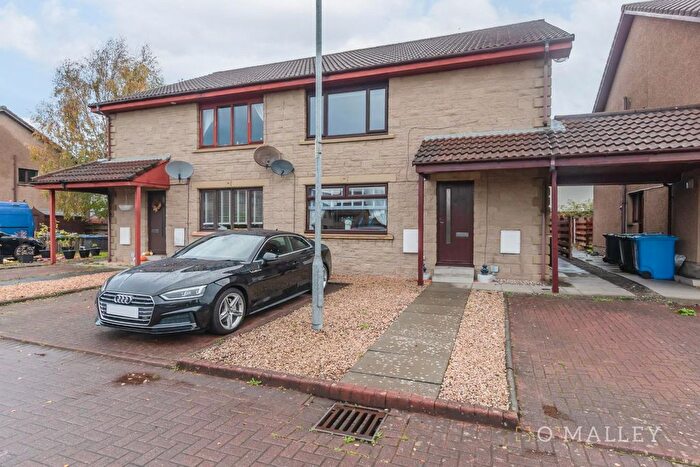
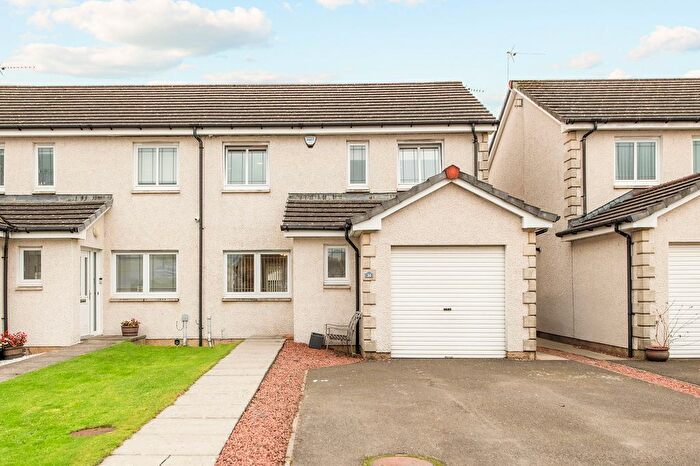
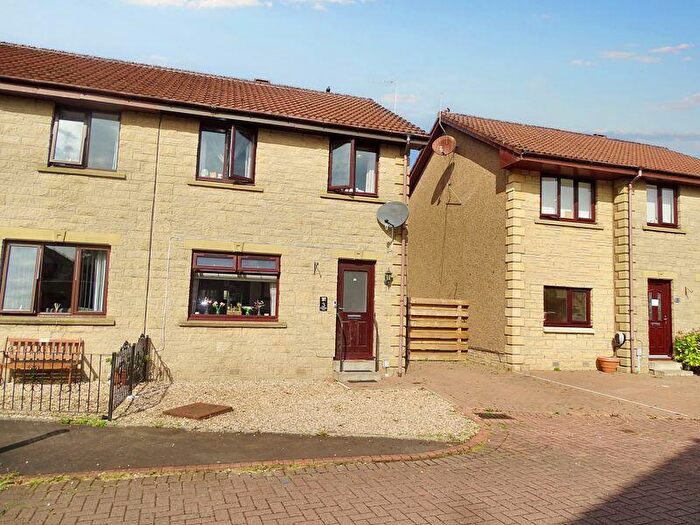
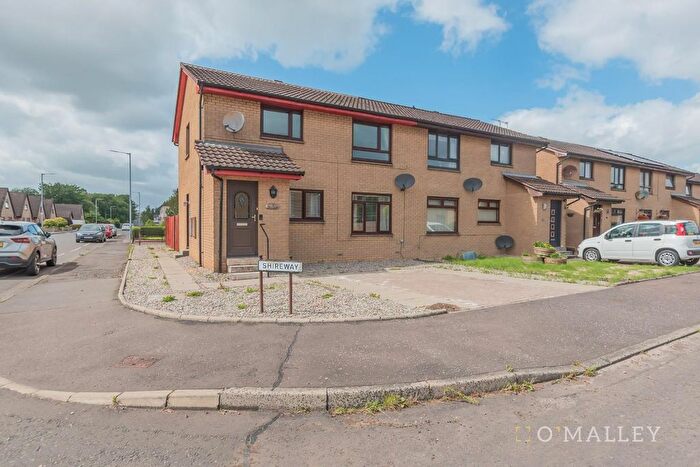
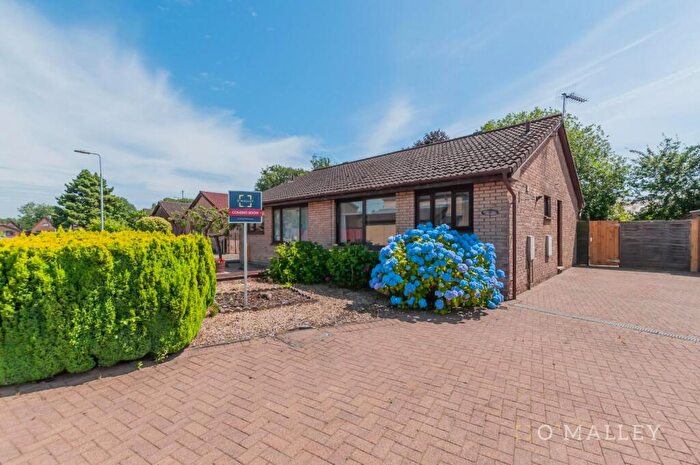
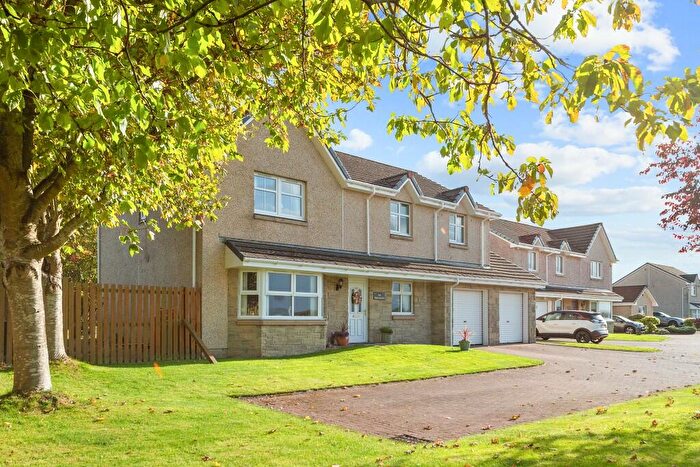
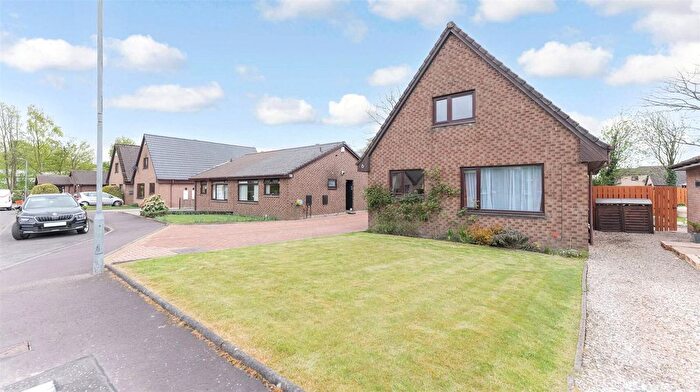
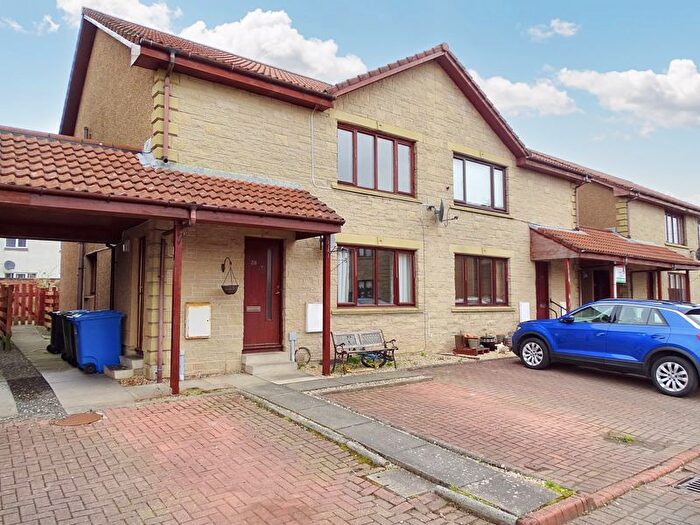
Properties for sale in Carse, Kinnaird and Tryst
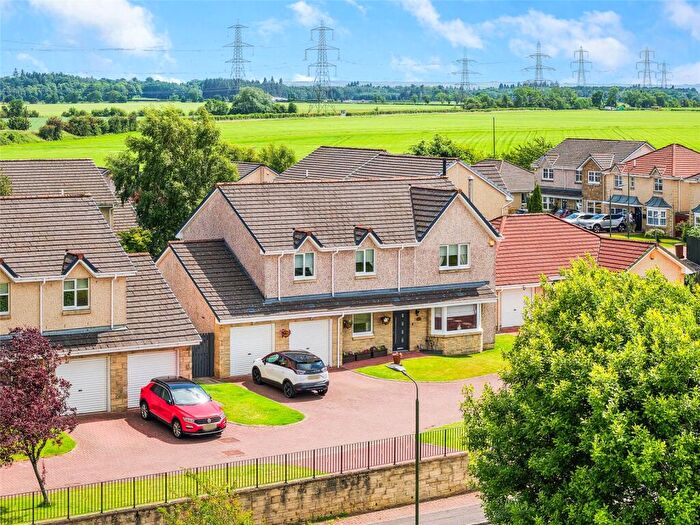
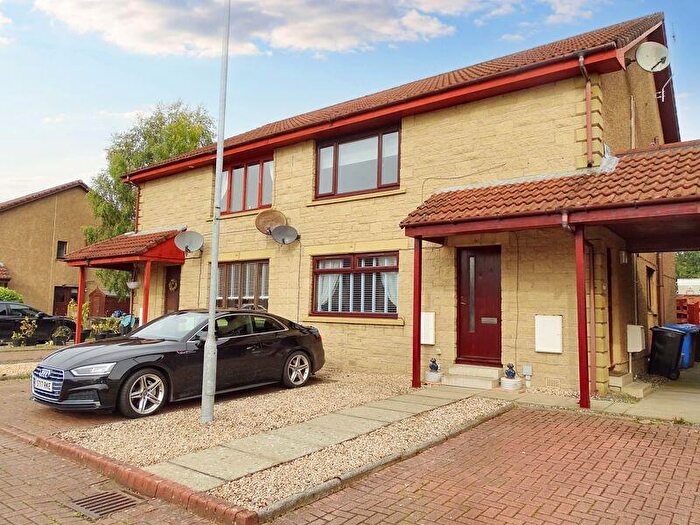
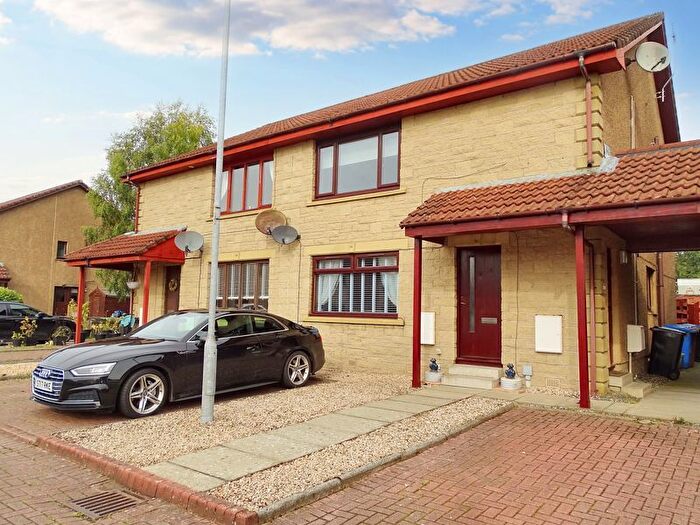
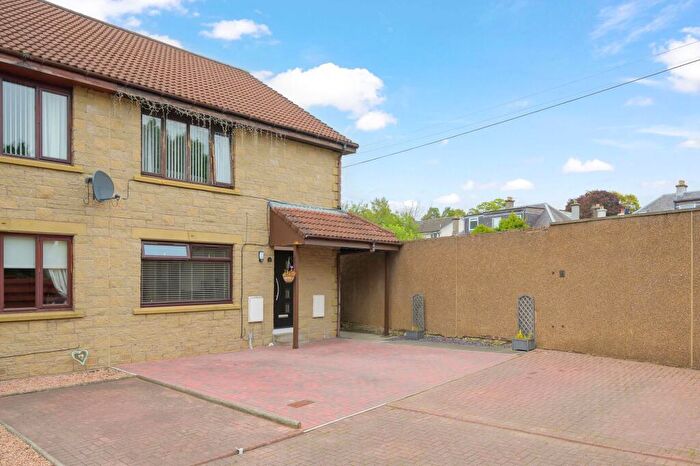
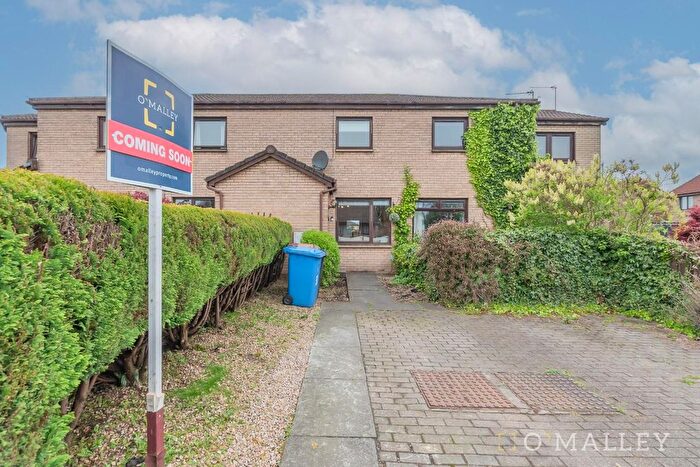
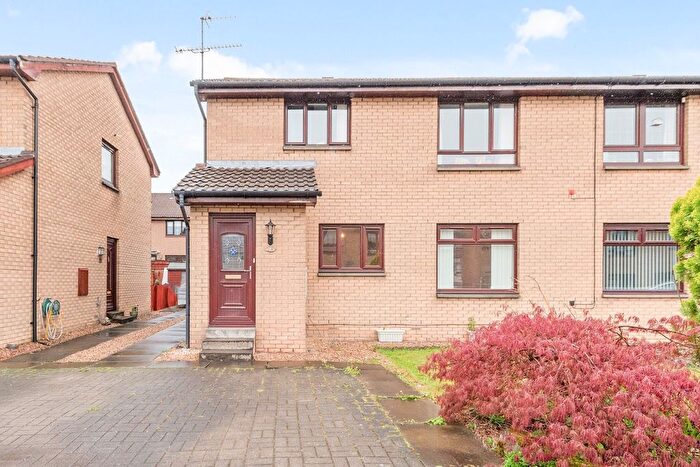
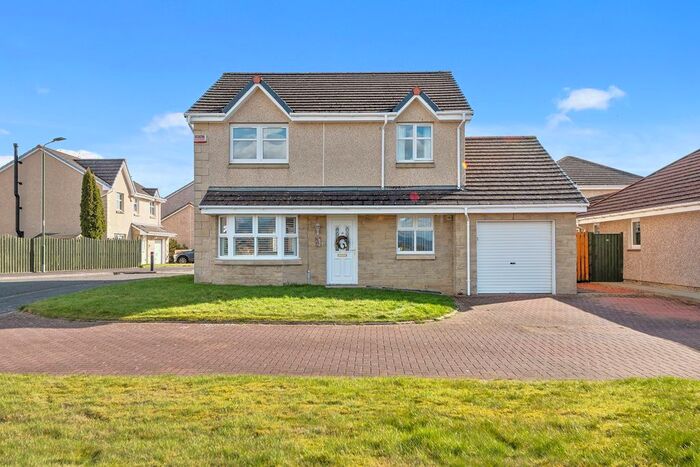
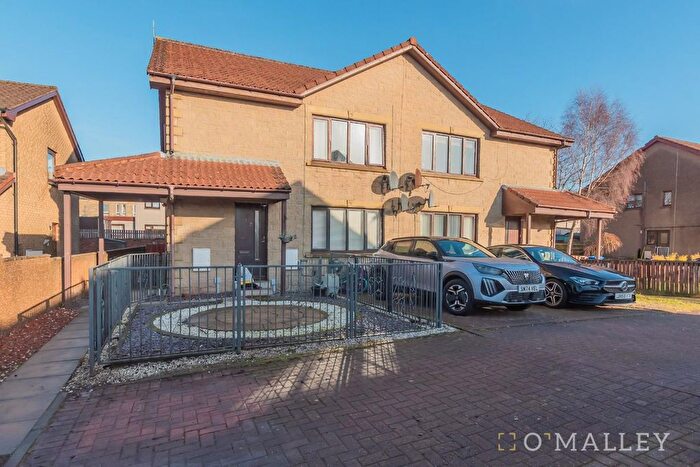
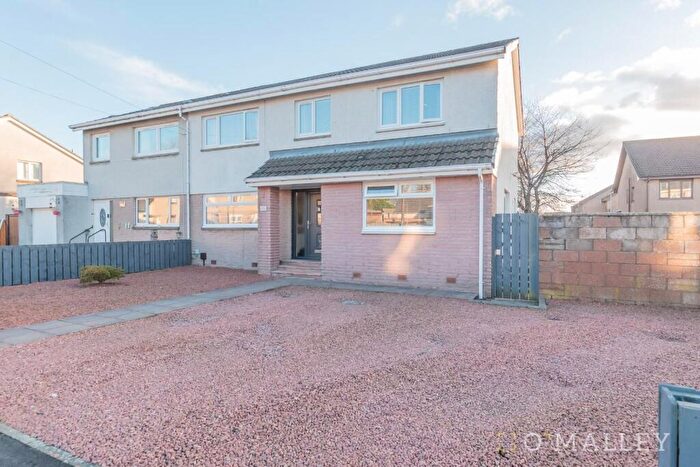
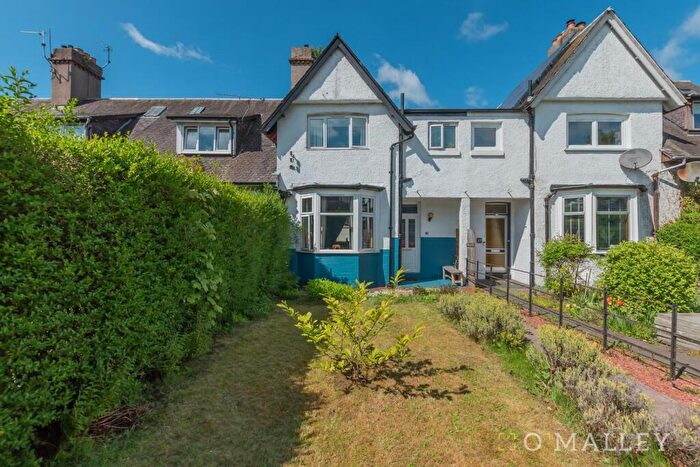
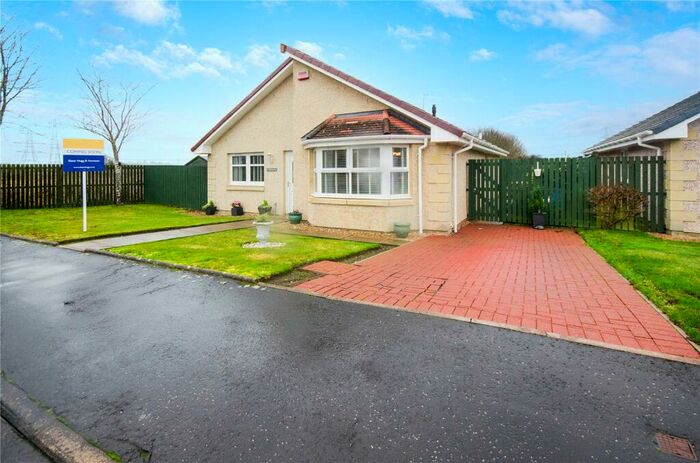
Previously listed properties in Carse, Kinnaird and Tryst
![]()
If you are looking to sell your house, let it out, or receive a property valuation, an expert can help you.
Click the button below to get started.


Roads and Postcodes in Carse, Kinnaird and Tryst
Navigate through our locations to find the location of your next house in Carse, Kinnaird and Tryst, Stirling for sale or to rent.
| Streets | Postcodes |
|---|---|
| Ferry Road | FK7 7LF |
| Kersie Terrace | FK7 7NJ |
| The Haven | FK7 7LB |
| FK7 7LG FK7 7NH FK7 7NL |
Transport near Carse, Kinnaird and Tryst
-
 Alloa Station
 -
Stirling Station
-
Larbert Station
-
Camelon Station
-
Bridge Of Allan Station
-
Falkirk Grahamston Station
-
Falkirk High Station
-
Dunblane Station
-
Polmont Station
- FAQ
- Price Paid By Year
Frequently asked questions about Carse, Kinnaird and Tryst
What is the average price for a property for sale in Carse, Kinnaird and Tryst?
The average price for a property for sale in Carse, Kinnaird and Tryst is £252,500. There are 76 property listings for sale in Carse, Kinnaird and Tryst.
Which train stations are available in or near Carse, Kinnaird and Tryst?
Some of the train stations available in or near Carse, Kinnaird and Tryst are Alloa, Stirling and Larbert.
Property Price Paid in Carse, Kinnaird and Tryst by Year
The average sold property price by year was:
| Year | Average Sold Price | Price Change |
Sold Properties
|
|---|---|---|---|
| 2025 | £307,000 | 10% |
1 Property |
| 2024 | £277,000 | 23% |
1 Property |
| 2023 | £213,000 | 27% |
2 Properties |
| 2021 | £156,056 | -79% |
2 Properties |
| 2020 | £279,750 | -19% |
2 Properties |
| 2019 | £332,500 | 47% |
3 Properties |
| 2018 | £177,625 | -10% |
2 Properties |
| 2017 | £195,000 | -26% |
1 Property |
| 2016 | £245,000 | - |
1 Property |
| 2015 | £245,000 | 14% |
1 Property |
| 2014 | £211,250 | 5% |
2 Properties |
| 2013 | £201,666 | 16% |
3 Properties |
| 2012 | £170,000 | -18% |
1 Property |
| 2011 | £200,000 | 66% |
2 Properties |
| 2009 | £67,500 | -522% |
2 Properties |
| 2008 | £419,710 | 76% |
5 Properties |
| 2007 | £99,000 | -85% |
2 Properties |
| 2006 | £183,083 | 4% |
3 Properties |
| 2005 | £175,000 | 49% |
2 Properties |
| 2004 | £90,010 | 43% |
2 Properties |
| 2003 | £51,416 | -118% |
6 Properties |
| 2002 | £112,236 | - |
10 Properties |