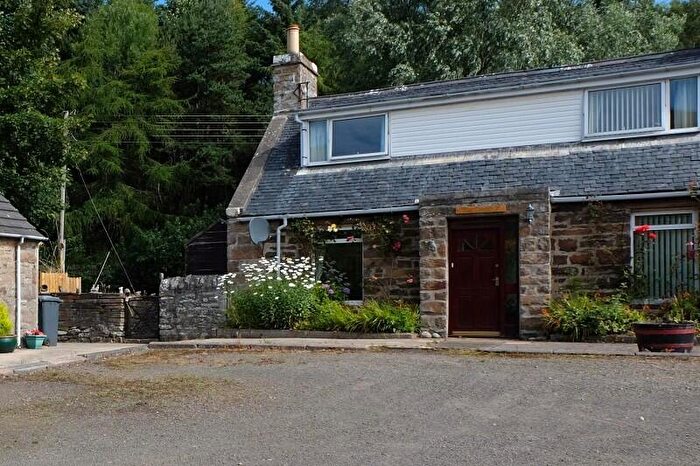
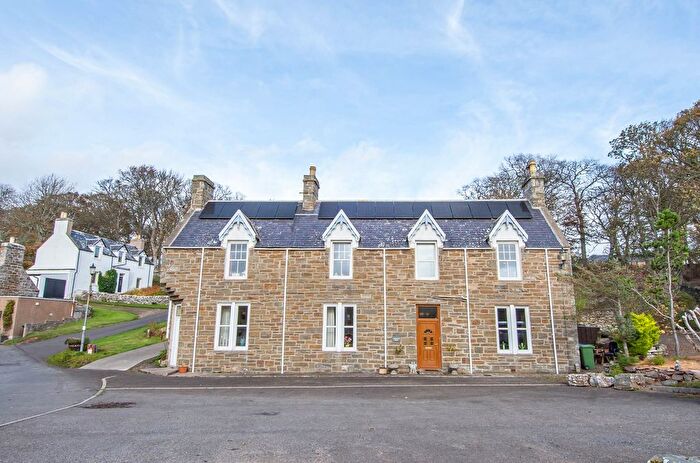
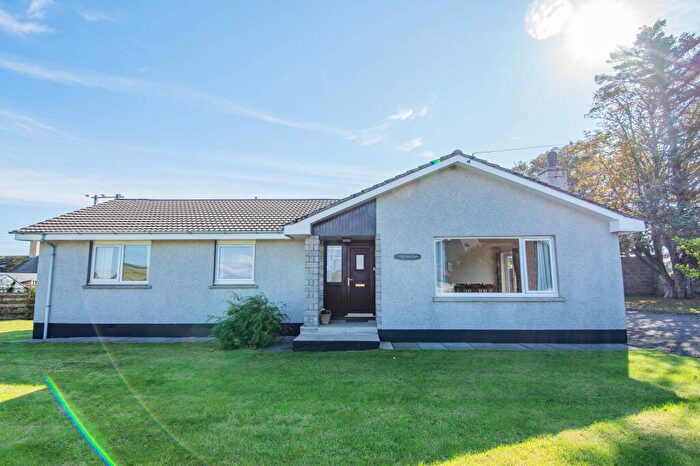
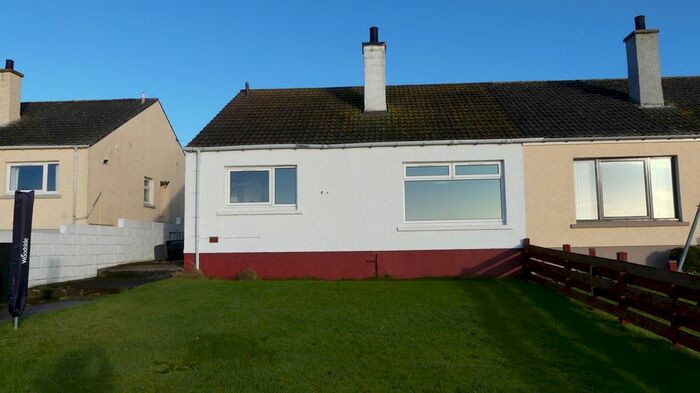
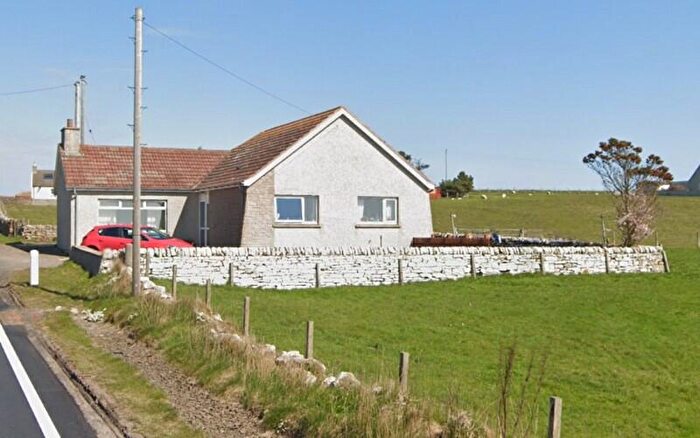
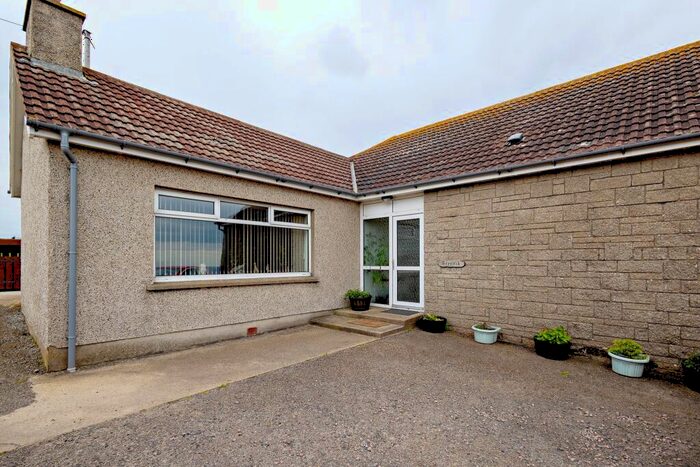
Houses for sale & to rent in Wick and East Caithness, Dunbeath
House Prices in Wick and East Caithness
Properties in Wick and East Caithness have no sales history available within the last 3 years.
Wick and East Caithness is an area in Dunbeath, Highland with 186 households².
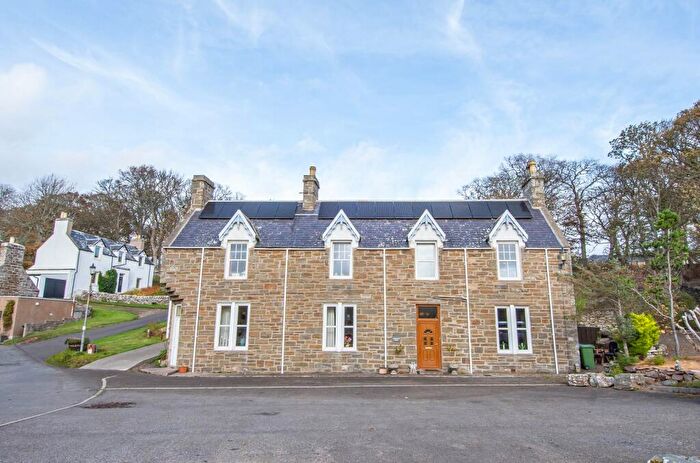
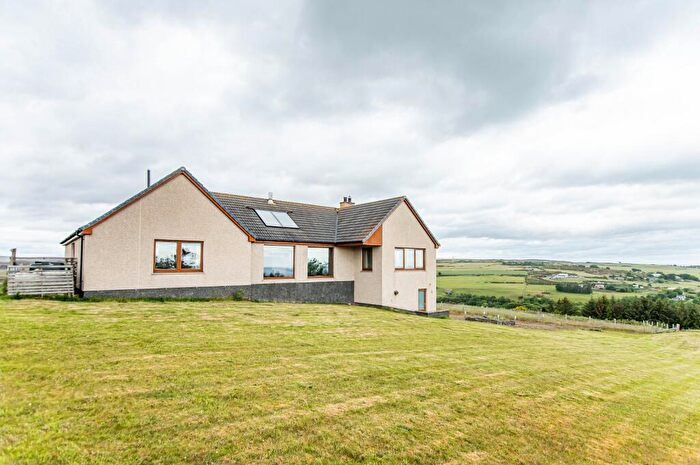
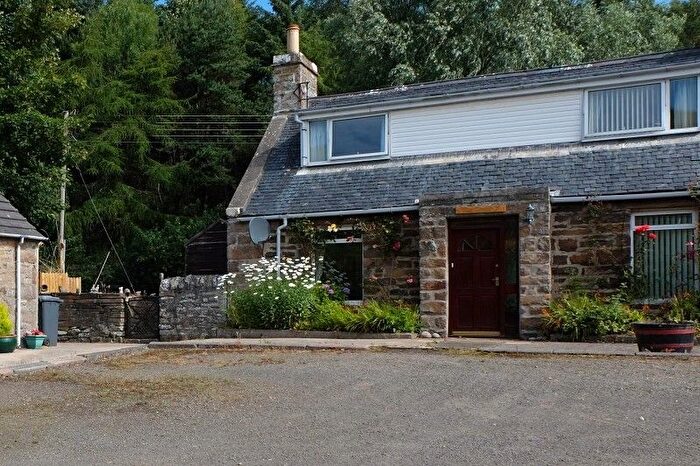
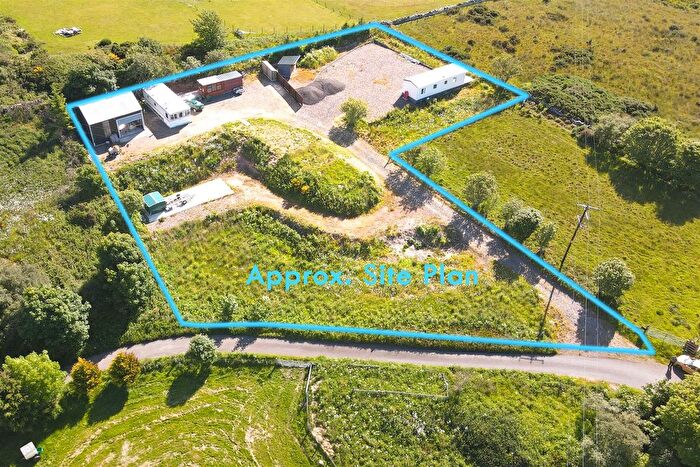
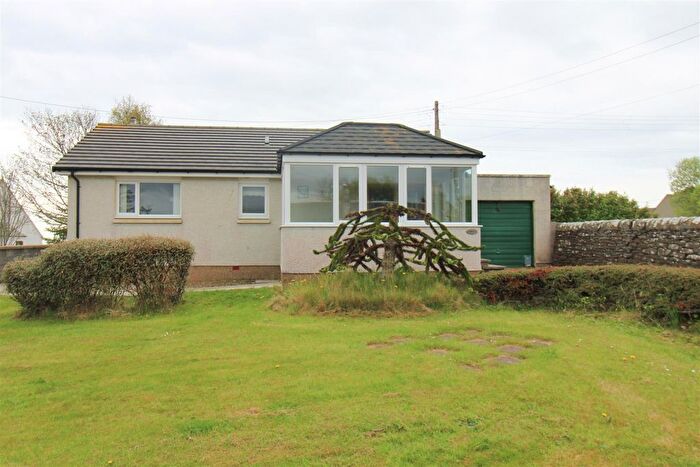
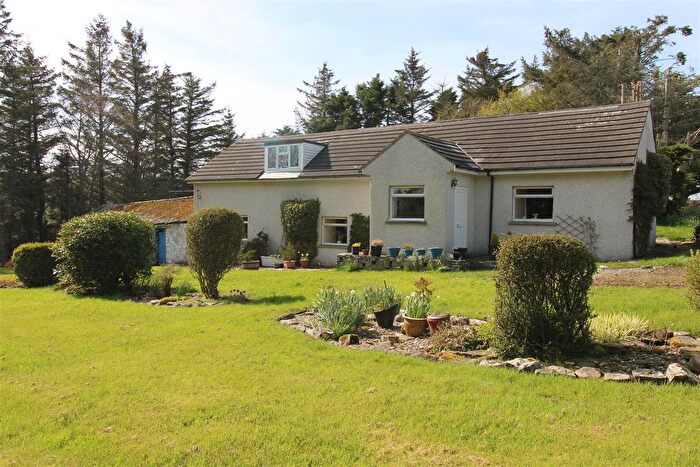
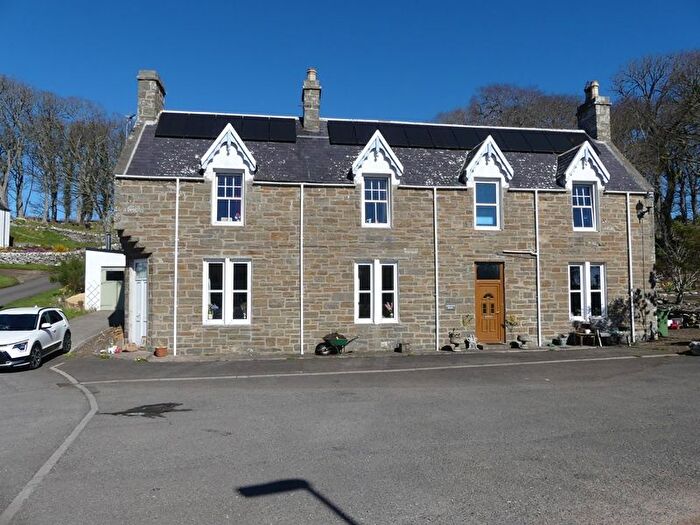
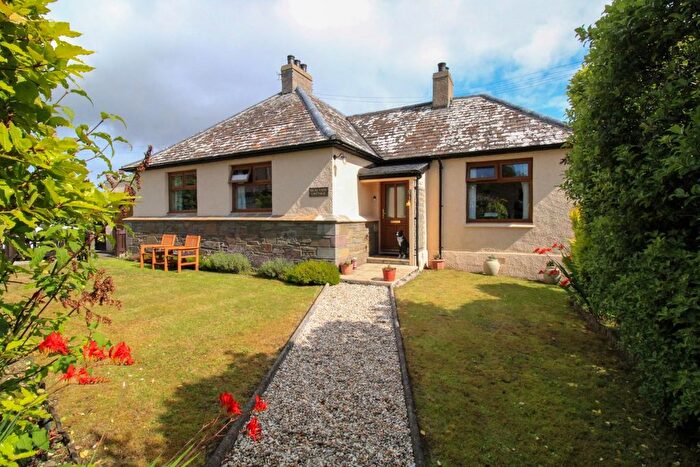
Properties for sale in Wick and East Caithness
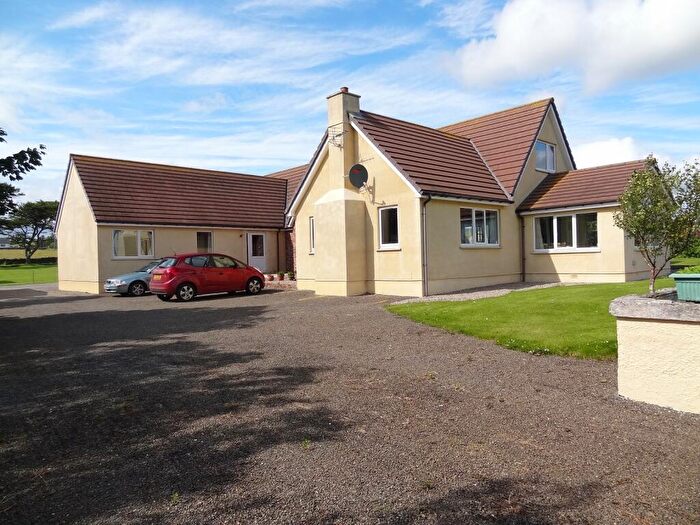
Previously listed properties in Wick and East Caithness
Roads and Postcodes in Wick and East Caithness
Navigate through our locations to find the location of your next house in Wick and East Caithness, Dunbeath for sale or to rent.
| Streets | Postcodes |
|---|---|
| Achorn Road | KW6 6EZ |
| Campbell Avenue | KW6 6EB |
| Clashvalley Road | KW6 6ER |
| Knockglass Road | KW6 6EQ |
| Neil Gunn Road | KW6 6EP |
| Portormin Road | KW6 6EF |
| KW6 6EA KW6 6ED KW6 6EE KW6 6EG KW6 6EH KW6 6EJ KW6 6EL KW6 6EN KW6 6ET KW6 6EU KW6 6EX KW6 6EY |
Transport near Wick and East Caithness
-
Helmsdale Station
-
Altnabreac Station
-
Kildonan Station
-
Scotscalder Station
-
Forsinard Station
-
Kinbrace Station
-
Georgemas Junction Station
-
Wick Station
- FAQ
- Price Paid By Year
Frequently asked questions about Wick and East Caithness
Which train stations are available in or near Wick and East Caithness?
Some of the train stations available in or near Wick and East Caithness are Helmsdale, Altnabreac and Kildonan.
Property Price Paid in Wick and East Caithness by Year
The average sold property price by year was:
| Year | Average Sold Price | Price Change |
Sold Properties
|
|---|---|---|---|
| 2022 | £119,000 | -30% |
3 Properties |
| 2021 | £154,214 | 36% |
7 Properties |
| 2020 | £98,000 | -28% |
1 Property |
| 2019 | £125,168 | 15% |
6 Properties |
| 2018 | £106,666 | -30% |
3 Properties |
| 2017 | £138,375 | 22% |
4 Properties |
| 2016 | £108,300 | 8% |
5 Properties |
| 2015 | £99,166 | 20% |
3 Properties |
| 2014 | £79,166 | -25% |
3 Properties |
| 2013 | £98,888 | -2% |
12 Properties |
| 2012 | £101,000 | -3% |
3 Properties |
| 2010 | £104,000 | 20% |
4 Properties |
| 2009 | £83,714 | -2% |
7 Properties |
| 2008 | £85,060 | -19% |
7 Properties |
| 2007 | £100,979 | -8% |
9 Properties |
| 2006 | £108,750 | 33% |
4 Properties |
| 2005 | £72,629 | 87% |
8 Properties |
| 2004 | £9,600 | -317% |
3 Properties |
| 2003 | £40,000 | -9% |
2 Properties |
| 2002 | £43,500 | 19% |
2 Properties |
| 2001 | £35,087 | - |
4 Properties |

