
Houses for sale & to rent in Wick and East Caithness, Lybster
House Prices in Wick and East Caithness
Properties in Wick and East Caithness have an average house price of £172k and had 6 Property Transactions within the last 3 years¹.
Wick and East Caithness is an area in Lybster, Highland with 493 households², where the most expensive property was sold for £395k.
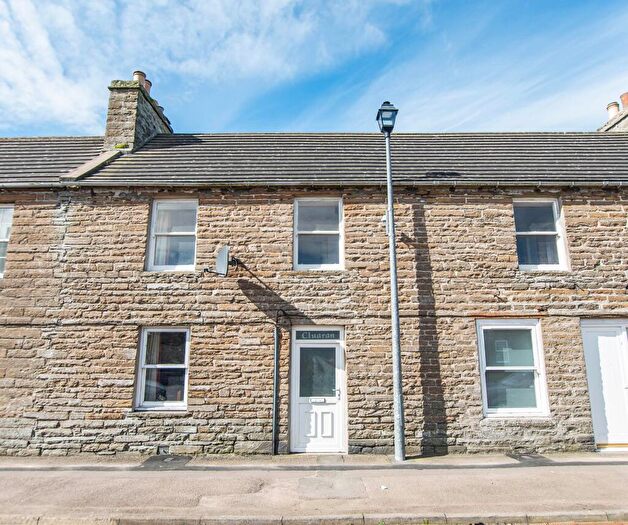
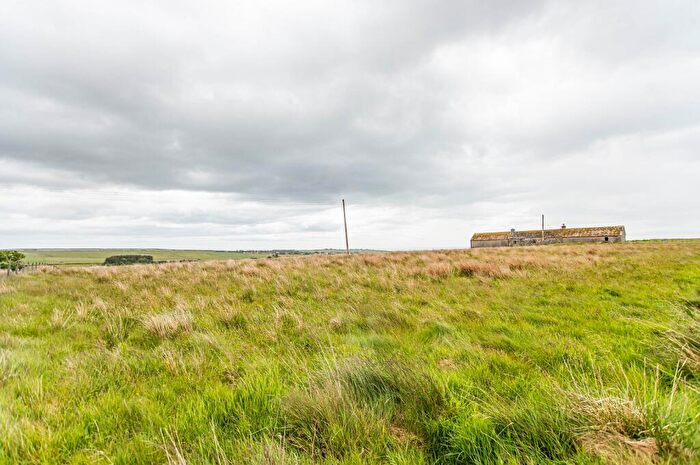
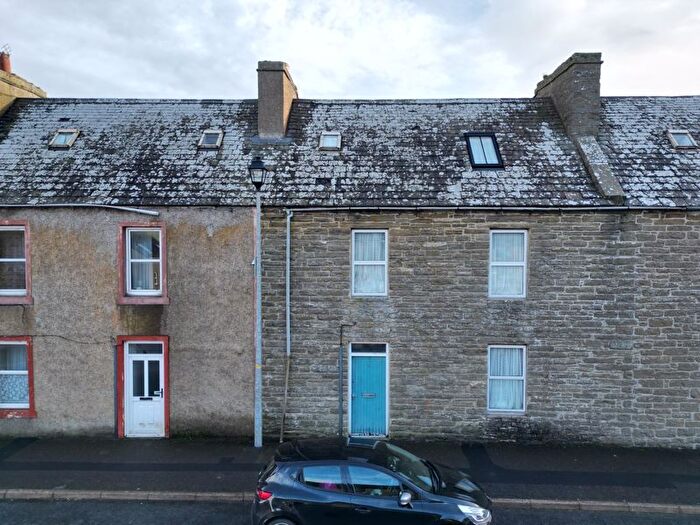
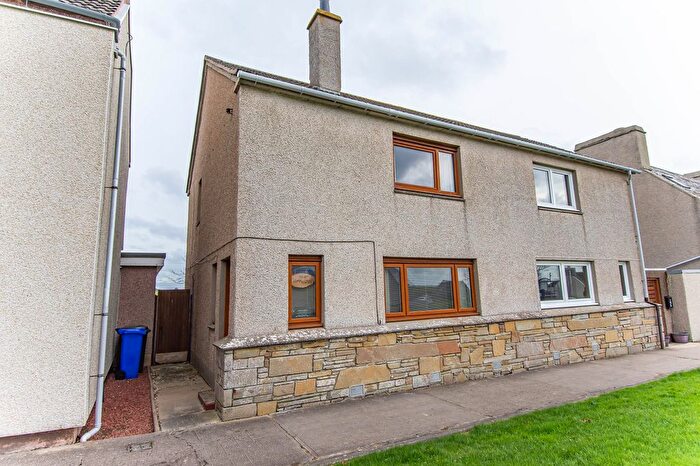
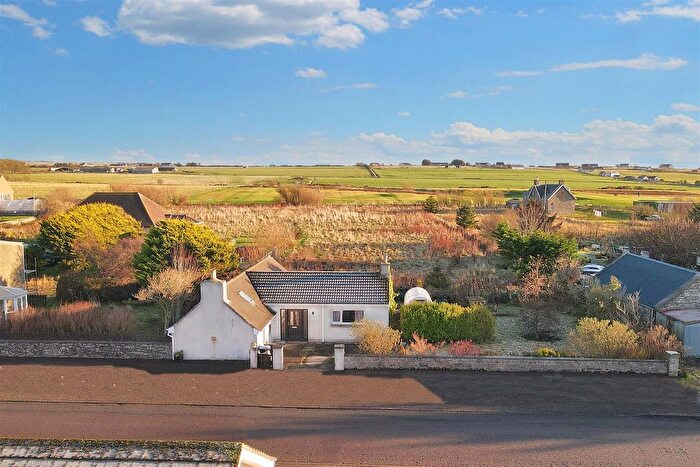
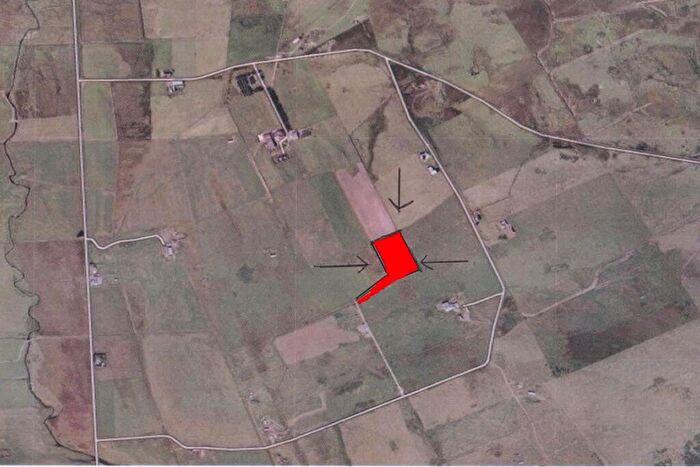
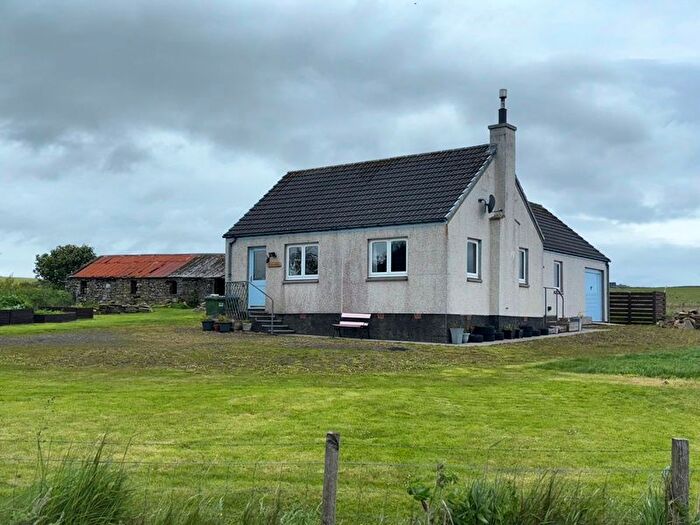
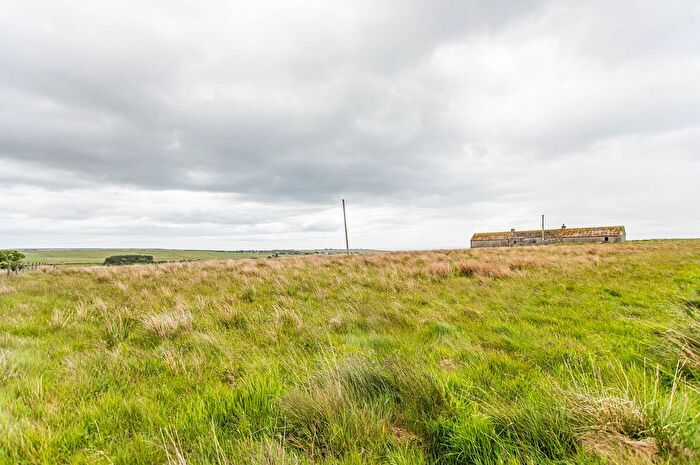
Properties for sale in Wick and East Caithness
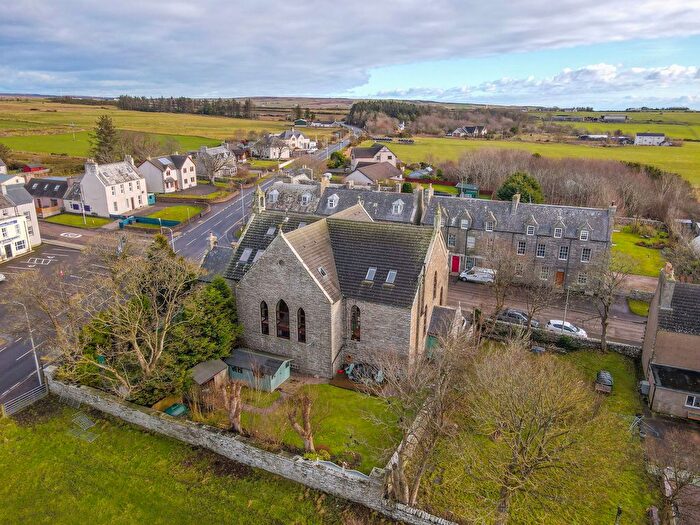

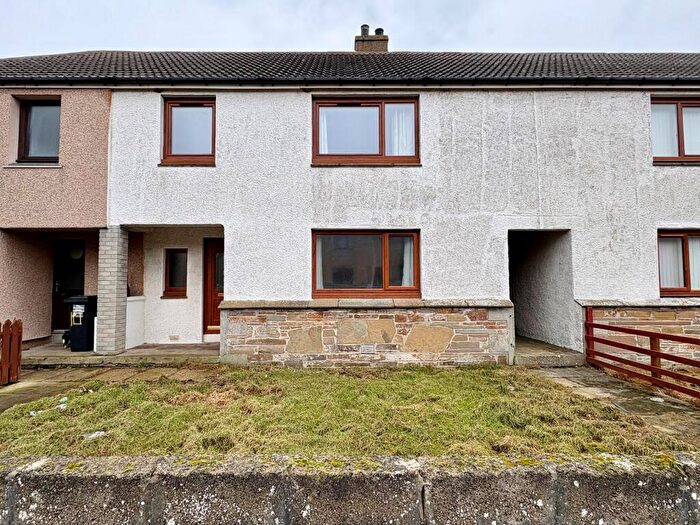

![]()
If you are looking to sell your house, let it out, or receive a property valuation, an expert can help you.
Click the button below to get started.
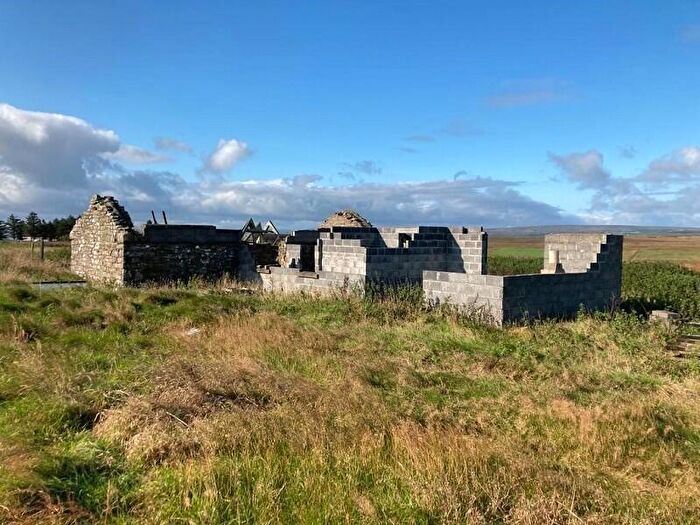
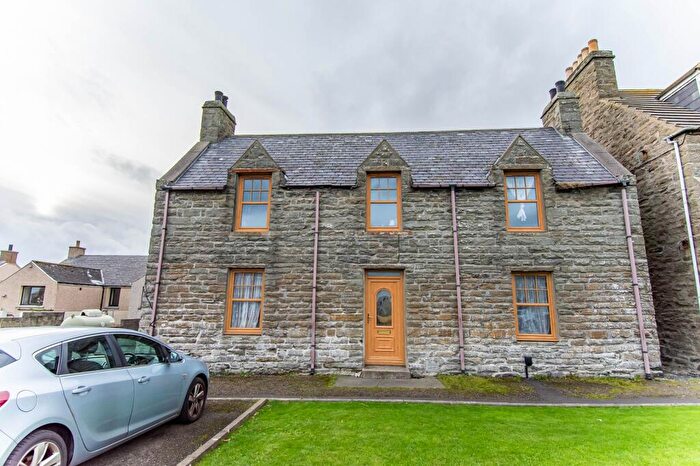
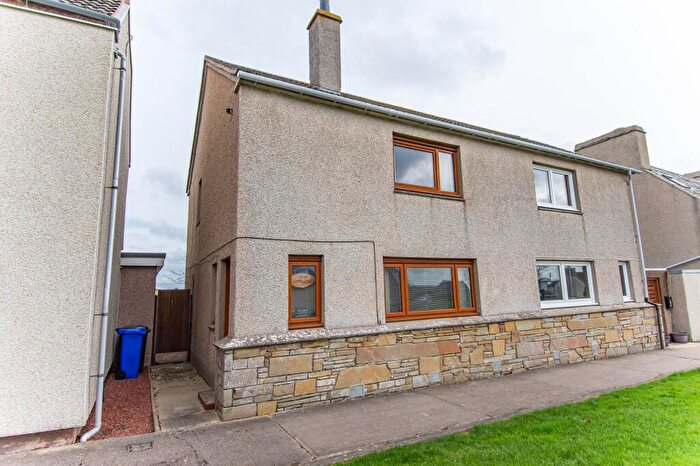
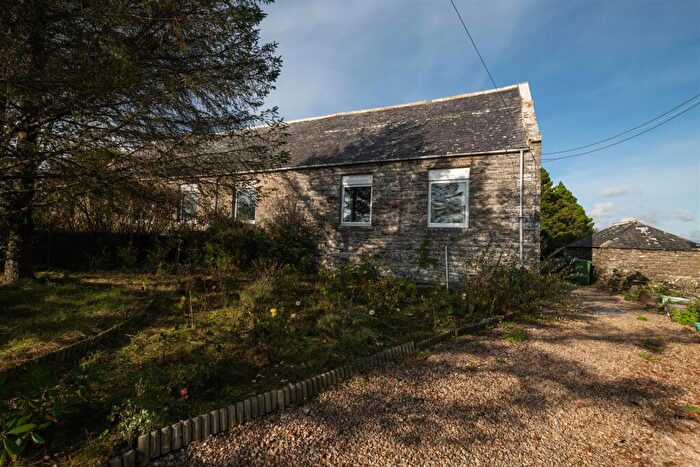
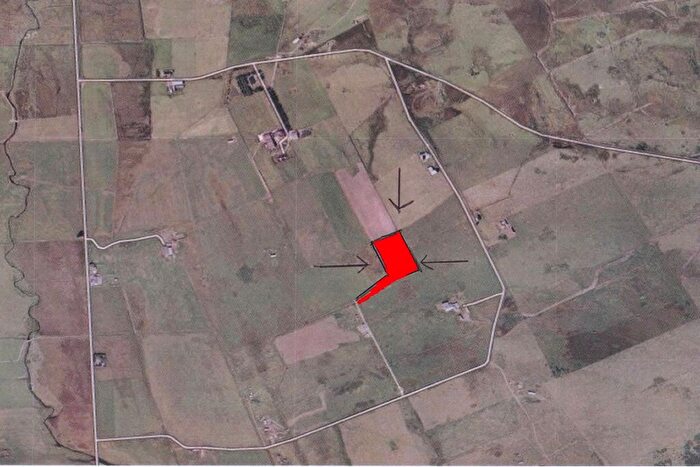
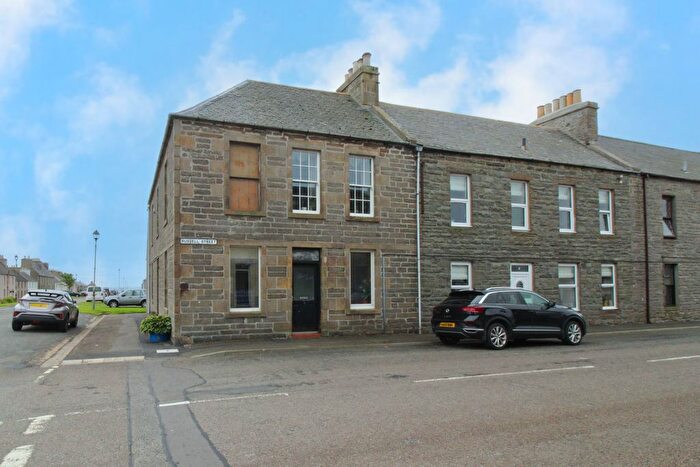
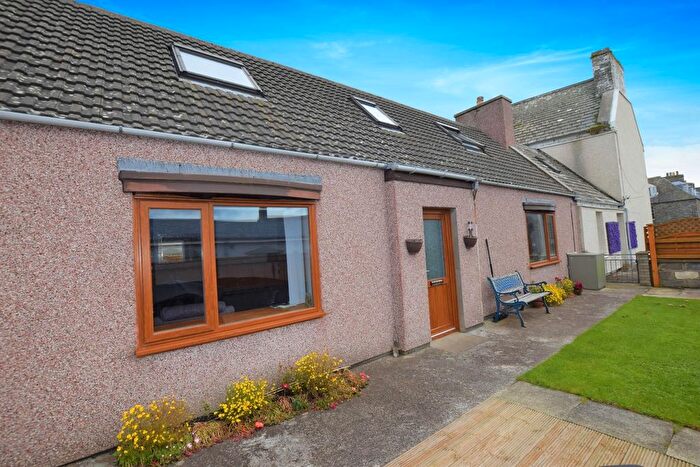
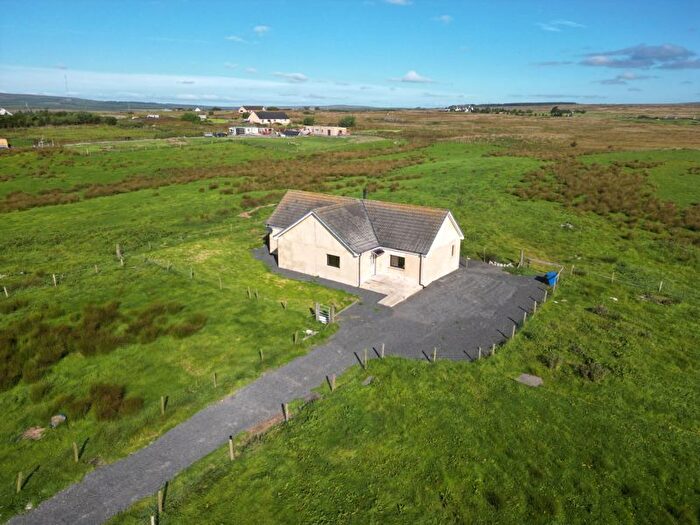
Previously listed properties in Wick and East Caithness
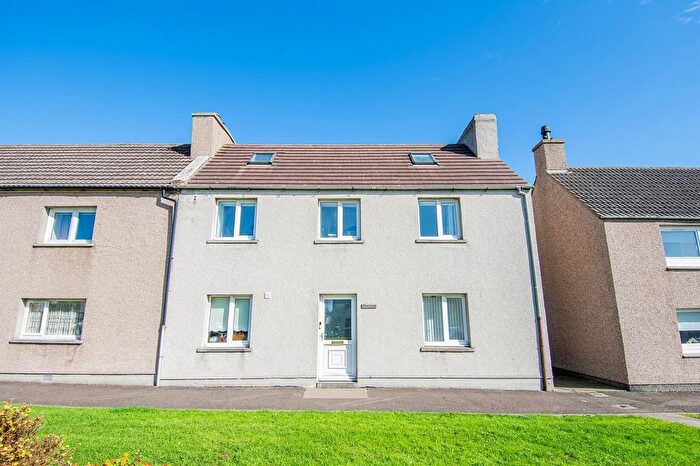


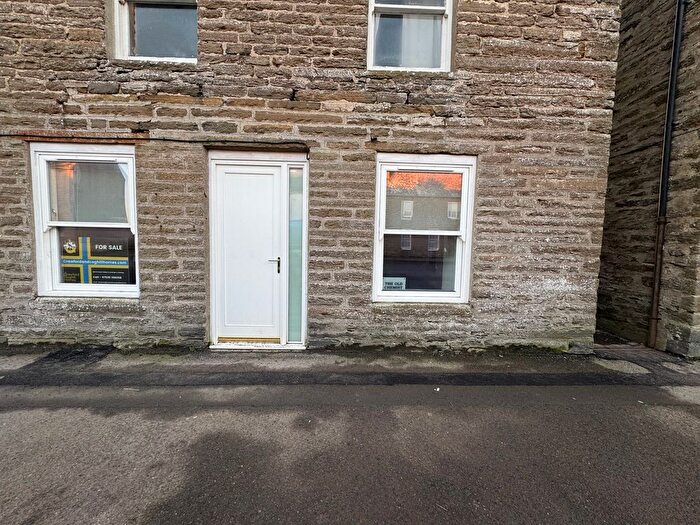
![]()
If you are looking to sell your house, let it out, or receive a property valuation, an expert can help you.
Click the button below to get started.
Roads and Postcodes in Wick and East Caithness
Navigate through our locations to find the location of your next house in Wick and East Caithness, Lybster for sale or to rent.
| Streets | Postcodes |
|---|---|
| Althorpe Street | KW3 6BQ |
| Golf View Drive | KW3 6BG |
| Golfview Place | KW3 6AP |
| Harbour Road | KW3 6AH |
| Jeffrey Street | KW3 6AF |
| Main Street | KW3 6AE KW3 6AQ KW3 6BJ |
| Morayview Terrace | KW3 6AZ |
| Mowat Place | KW3 6AJ |
| Norland Road | KW3 6AD |
| Portland Place | KW3 6BL |
| Russell Street | KW3 6AG |
| Shelligoe Road | KW3 6AW |
| Skaill Avenue | KW3 6AL |
| South Head View | KW3 6DB |
| Southend | KW3 6AN |
| The Crescent | KW3 6BP |
| The Haven | KW2 6AB |
| Young Crescent | KW3 6BH |
| KW2 6AA KW3 6AR KW3 6AS KW3 6AT KW3 6AU KW3 6AX KW3 6AY KW3 6BA KW3 6BB KW3 6BD KW3 6BN KW3 6BS KW3 6BT KW3 6BU KW3 6BW KW3 6BX KW3 6BY KW3 6DA KW3 6YX |
Transport near Wick and East Caithness

- FAQ
- Price Paid By Year
Frequently asked questions about Wick and East Caithness
What is the average price for a property for sale in Wick and East Caithness?
The average price for a property for sale in Wick and East Caithness is £172,000. There are 153 property listings for sale in Wick and East Caithness.
What streets have the most expensive properties for sale in Wick and East Caithness?
The streets with the most expensive properties for sale in Wick and East Caithness are Harbour Road at an average of £200,000 and Main Street at an average of £121,500.
What streets have the most affordable properties for sale in Wick and East Caithness?
The street with the most affordable properties for sale in Wick and East Caithness is Golf View Drive at an average of £85,000.
Which train stations are available in or near Wick and East Caithness?
Some of the train stations available in or near Wick and East Caithness are Wick, Georgemas Junction and Scotscalder.
Property Price Paid in Wick and East Caithness by Year
The average sold property price by year was:
| Year | Average Sold Price | Price Change |
Sold Properties
|
|---|---|---|---|
| 2025 | £160,750 | 47% |
2 Properties |
| 2024 | £85,000 | -145% |
1 Property |
| 2023 | £208,500 | 28% |
3 Properties |
| 2022 | £150,506 | -5% |
24 Properties |
| 2021 | £158,330 | 38% |
23 Properties |
| 2020 | £98,700 | -13% |
10 Properties |
| 2019 | £111,300 | -8% |
17 Properties |
| 2018 | £120,648 | -1% |
18 Properties |
| 2017 | £121,266 | 12% |
15 Properties |
| 2016 | £107,166 | 3% |
18 Properties |
| 2015 | £104,450 | 14% |
10 Properties |
| 2014 | £89,988 | -18% |
17 Properties |
| 2013 | £106,068 | 0,3% |
11 Properties |
| 2012 | £105,745 | -3% |
10 Properties |
| 2011 | £109,002 | 25% |
17 Properties |
| 2010 | £81,590 | 23% |
11 Properties |
| 2009 | £62,443 | -54% |
15 Properties |
| 2008 | £96,100 | -11% |
14 Properties |
| 2007 | £106,600 | 20% |
20 Properties |
| 2006 | £85,626 | -55% |
28 Properties |
| 2005 | £132,793 | 58% |
19 Properties |
| 2004 | £55,500 | 32% |
22 Properties |
| 2003 | £37,720 | 12% |
5 Properties |
| 2002 | £33,166 | -5% |
3 Properties |
| 2001 | £34,850 | -51% |
3 Properties |
| 2000 | £52,750 | - |
2 Properties |