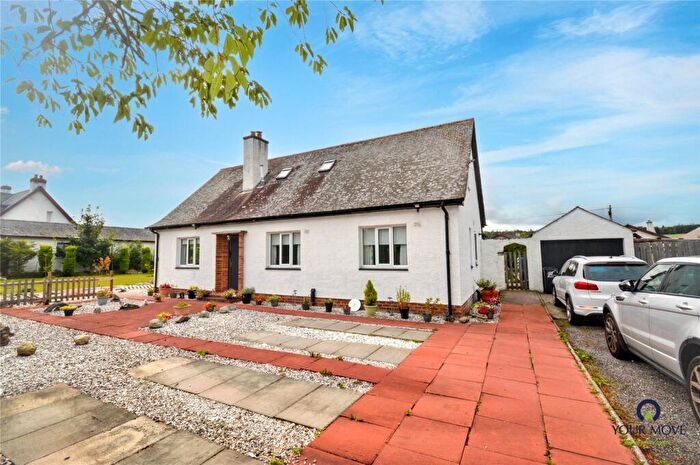
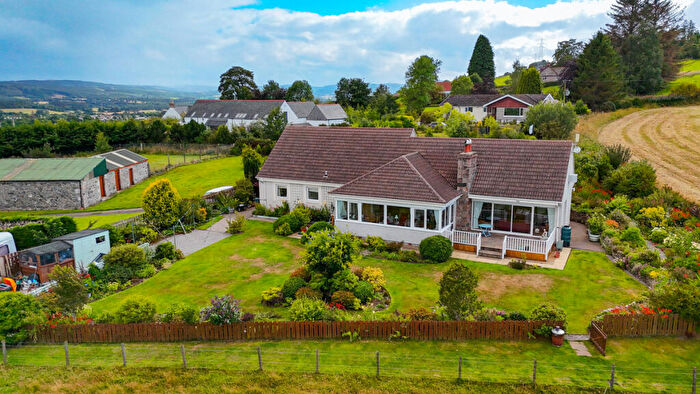
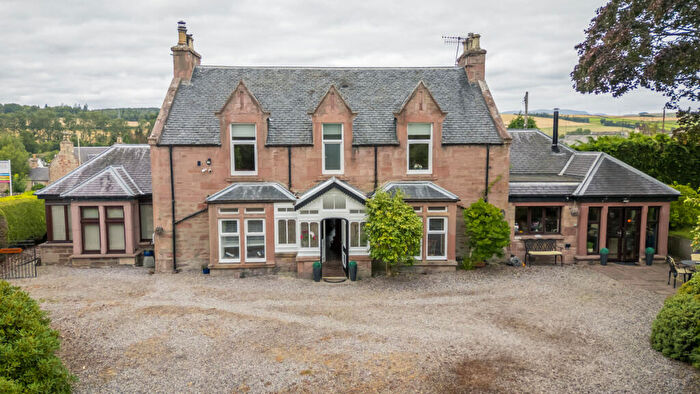
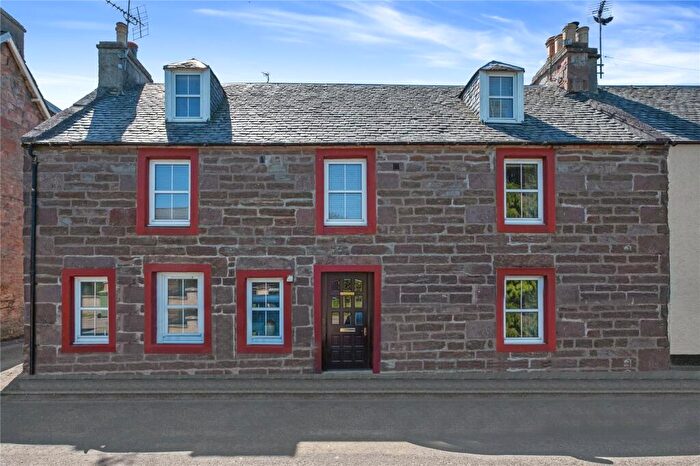
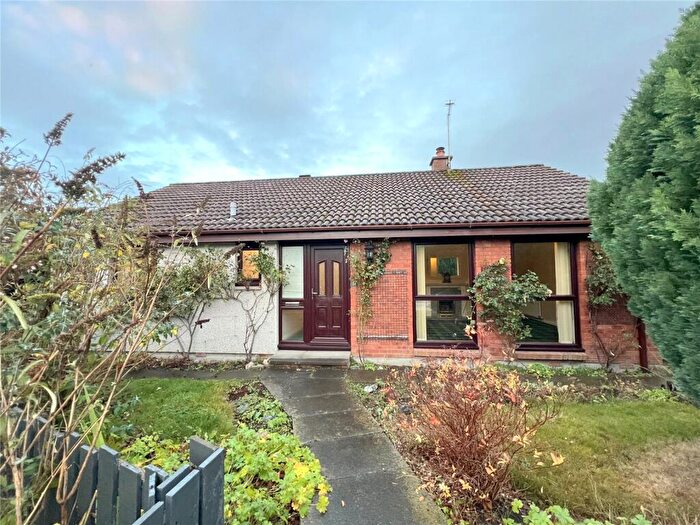
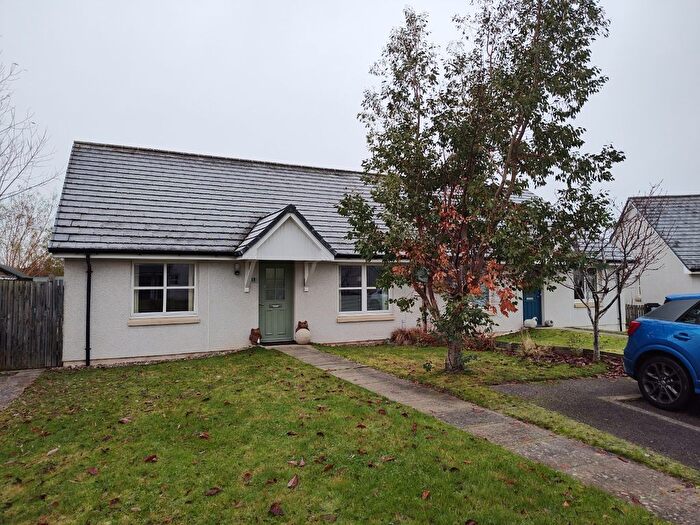
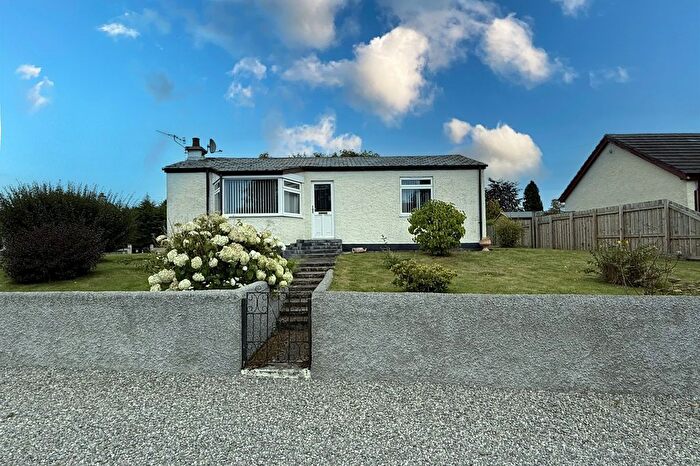
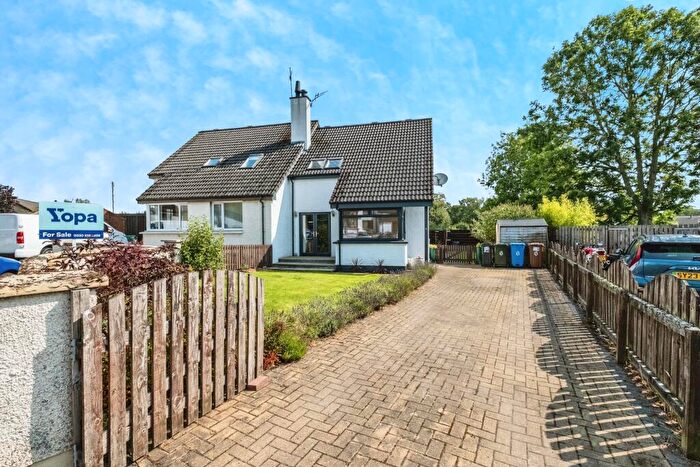
Houses for sale & to rent in Dingwall and Seaforth, Muir Of Ord
House Prices in Dingwall and Seaforth
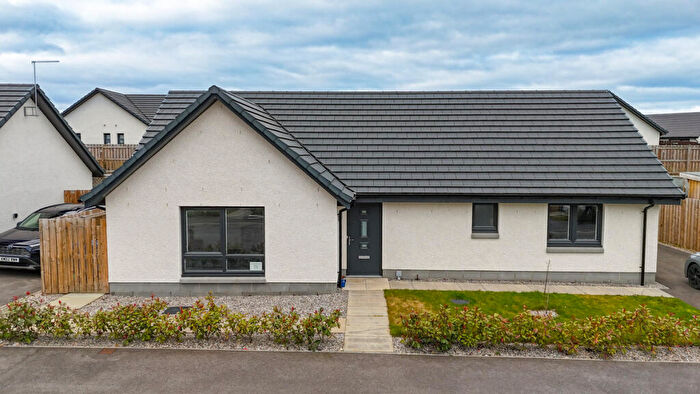
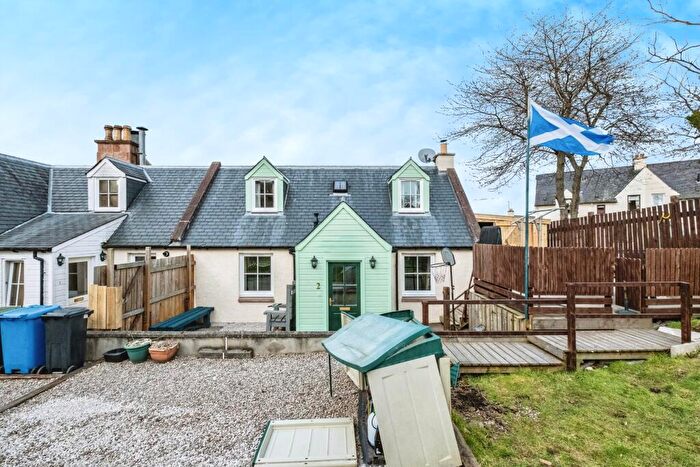
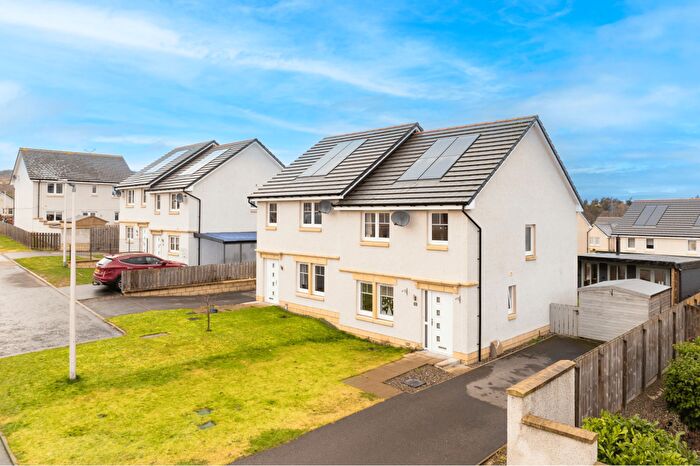
Properties in Dingwall and Seaforth have an average house price of £219,400.00 and had 61 Property Transactions within the last 3 years¹.
Dingwall and Seaforth is an area in Muir Of Ord, Highland with 1,401 households², where the most expensive property was sold for £850,000.00.
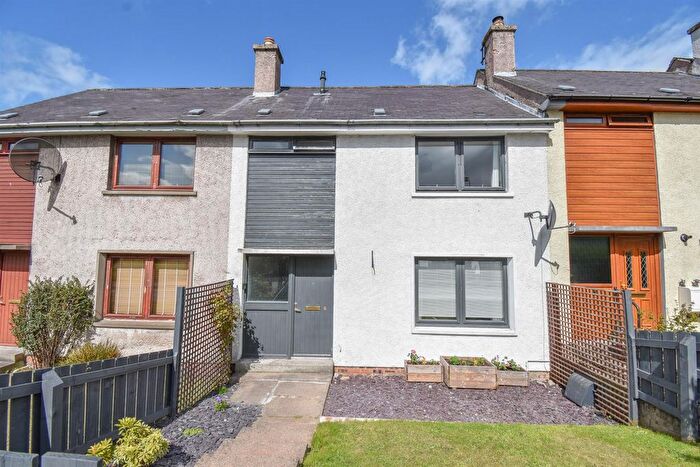
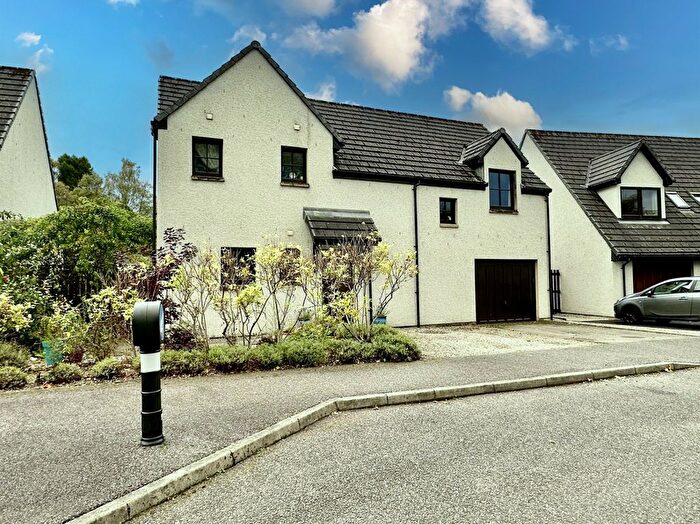
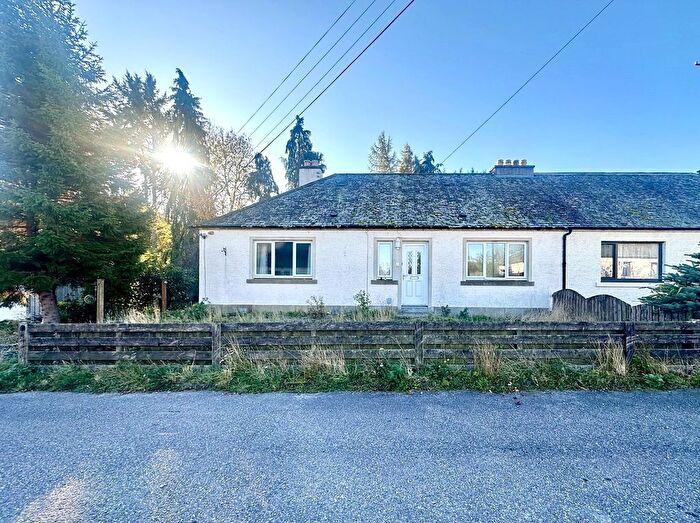
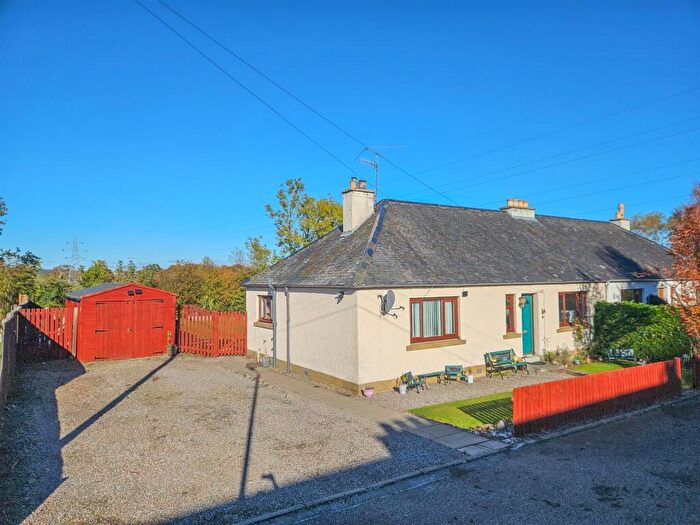
Properties for sale in Dingwall and Seaforth
Previously listed properties in Dingwall and Seaforth
Roads and Postcodes in Dingwall and Seaforth
Navigate through our locations to find the location of your next house in Dingwall and Seaforth, Muir Of Ord for sale or to rent.
| Streets | Postcodes |
|---|---|
| Great North Road | IV6 7XJ IV6 7SU IV6 7SX IV6 7SY IV6 7TP IV6 7XR |
| Balvaird Road | IV6 7QX |
| Balvaird Terrace | IV6 7TR |
| Baxters Industrial Estate | IV6 7UF |
| Beech Avenue | IV6 7PA |
| Black Isle Road | IV6 7RR |
| Broomhill Drive | IV6 7WH |
| Broomhill Place | IV6 7WJ |
| Broomhill Road | IV6 7TT |
| Burns Avenue | IV6 7TH IV6 7TQ |
| Castle Hill | IV6 7ST |
| Chapelton Place | IV6 7TG |
| Chestnut Grove | IV6 7TY |
| Corrie Gardens | IV6 7QP IV6 7QU |
| Corrie Place | IV6 7QS |
| Corrie Road | IV6 7TZ |
| Corrie Terrace | IV6 7QR IV6 7QT |
| Corry Road | IV6 7AB IV6 7TJ IV6 7TL |
| Curling Court | IV6 7QB |
| Drovers Court | IV6 7WN |
| Drynie Park | IV6 7RP |
| Drynie Place | IV6 7RN |
| Fairmuir Road | IV6 7TB |
| Fairways Avenue | IV6 7PZ |
| Finlayson Court | IV6 7XU |
| Golf Terrace | IV6 7SS |
| Hawthorn Park | IV6 7TX |
| Hawthorn Road | IV6 7RL |
| Heather Court | IV6 7PW |
| Highfield Circle | IV6 7TE IV6 7TF |
| Logan Way | IV6 7QJ |
| Macrae Park | IV6 7AF |
| Margaret's Drive | IV6 7RJ |
| Muir Of Ord Industrial Estate | IV6 7UA |
| Nobles Court | IV6 7XE |
| Oak Drive | IV6 7PB |
| Ord Drive | IV6 7UQ |
| Ord Place | IV6 7TS |
| Ord Road | IV6 7XL |
| Seaforth Road | IV6 7TA |
| Shore Road | IV6 7SH |
| Tarradale Gardens | IV6 7SJ |
| Tarradale Terrace | IV6 7SR |
| The Cairns | IV6 7AT |
| The Meadows | IV6 7QL |
| Tomich Industrial Estate | IV6 7WA |
| Wards Croft | IV6 7PU |
| Wards Drive | IV6 7PX |
| West Road | IV6 7QW |
| West Way | IV6 7PD |
| Westfield Gardens | IV6 7AE |
| Wyndhill Industrial Estate | IV6 7WB |
| IV6 7AG IV6 7PY IV6 7QA IV6 7QZ IV6 7RG IV6 7RH IV6 7RQ IV6 7RS IV6 7RT IV6 7RU IV6 7RW IV6 7RX IV6 7RY IV6 7SF IV6 7SG IV6 7SN IV6 7SQ IV6 7SZ IV6 7TD IV6 7TU IV6 7UG IV6 7UH IV6 7UJ IV6 7UY IV6 7XB IV6 7XN IV6 7XP IV6 7XS IV6 7XT IV6 7XW |
Transport near Dingwall and Seaforth
- FAQ
- Price Paid By Year
Frequently asked questions about Dingwall and Seaforth
What is the average price for a property for sale in Dingwall and Seaforth?
The average price for a property for sale in Dingwall and Seaforth is £219,400. This amount is 2% lower than the average price in Muir Of Ord. There are 509 property listings for sale in Dingwall and Seaforth.
Which train stations are available in or near Dingwall and Seaforth?
Some of the train stations available in or near Dingwall and Seaforth are Muir Of Ord, Conon Bridge and Beauly.
Property Price Paid in Dingwall and Seaforth by Year
The average sold property price by year was:
| Year | Average Sold Price | Price Change |
Sold Properties
|
|---|---|---|---|
| 2023 | £222,846 | 2% |
13 Properties |
| 2022 | £218,467 | 8% |
48 Properties |
| 2021 | £201,207 | -4% |
82 Properties |
| 2020 | £209,990 | 14% |
71 Properties |
| 2019 | £181,210 | -3% |
60 Properties |
| 2018 | £186,104 | -8% |
69 Properties |
| 2017 | £201,425 | 19% |
66 Properties |
| 2016 | £162,980 | -6% |
77 Properties |
| 2015 | £172,349 | 3% |
62 Properties |
| 2014 | £167,695 | 2% |
49 Properties |
| 2013 | £164,175 | -30% |
32 Properties |
| 2012 | £214,185 | 21% |
33 Properties |
| 2011 | £168,583 | 16% |
36 Properties |
| 2010 | £141,090 | -1% |
57 Properties |
| 2009 | £142,411 | -9% |
65 Properties |
| 2008 | £155,378 | 10% |
83 Properties |
| 2007 | £139,644 | 8% |
52 Properties |
| 2006 | £128,378 | 16% |
58 Properties |
| 2005 | £107,731 | 11% |
60 Properties |
| 2004 | £96,111 | 11% |
78 Properties |
| 2003 | £85,330 | -12% |
34 Properties |
| 2002 | £95,968 | 42% |
8 Properties |
| 2001 | £55,648 | -30% |
7 Properties |
| 2000 | £72,333 | - |
6 Properties |

