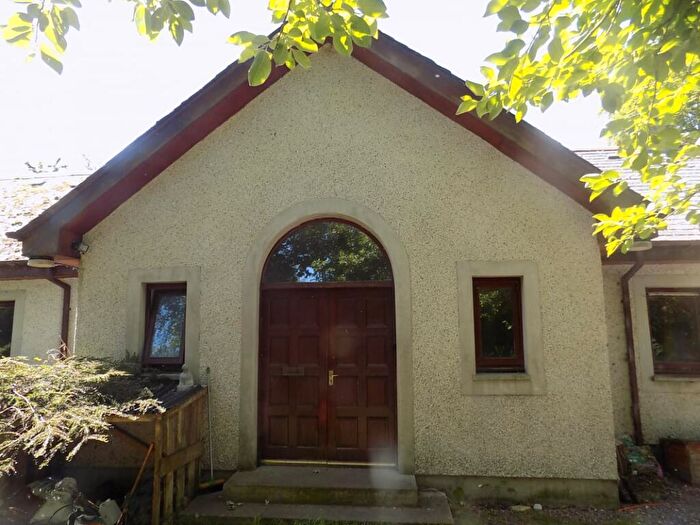
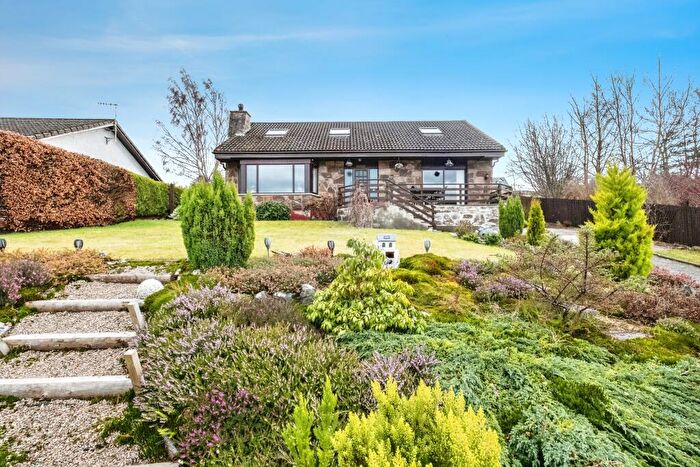
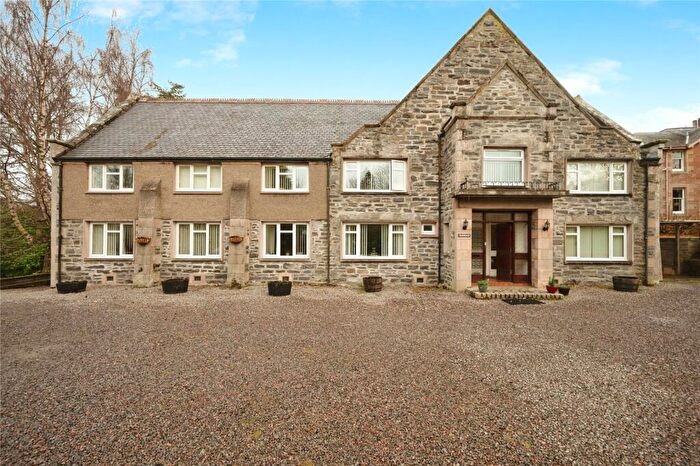
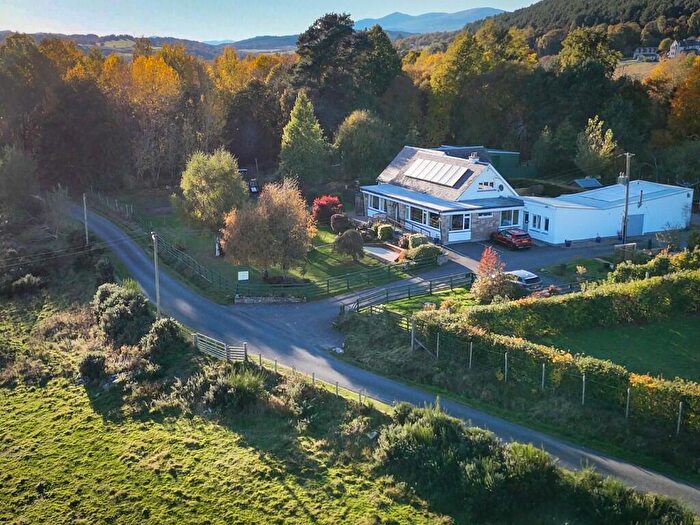
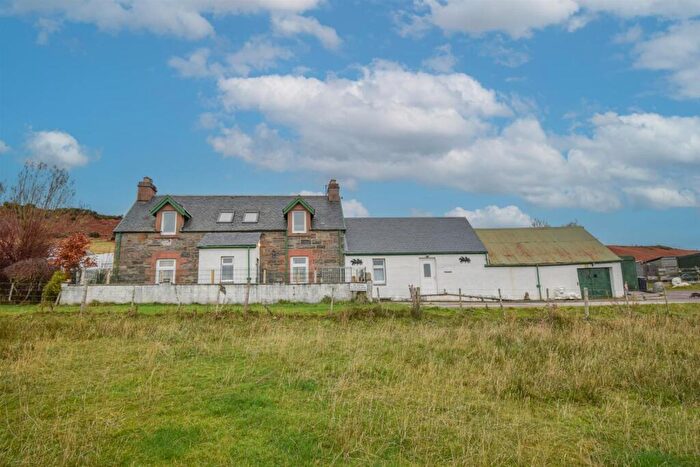
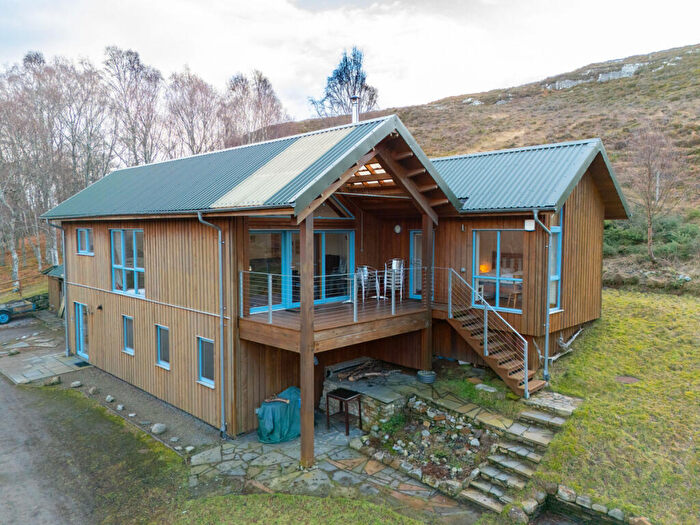
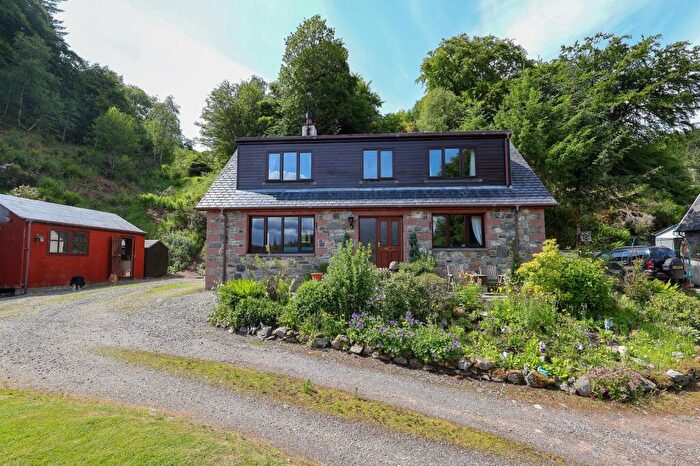
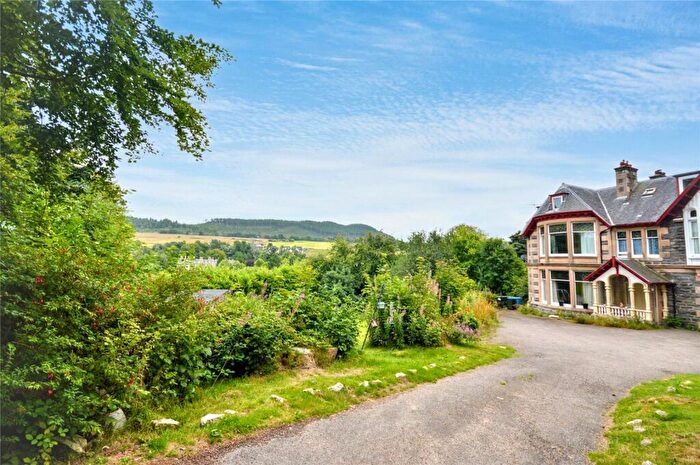
Houses for sale & to rent in Wester Ross, Strathpeffer and Lochalsh, Muir Of Ord
House Prices in Wester Ross, Strathpeffer and Lochalsh
Properties in Wester Ross, Strathpeffer and Lochalsh have an average house price of £243,136.00 and had 12 Property Transactions within the last 3 years¹.
Wester Ross, Strathpeffer and Lochalsh is an area in Muir Of Ord, Highland with 298 households², where the most expensive property was sold for £430,000.00.
Properties for sale in Wester Ross, Strathpeffer and Lochalsh
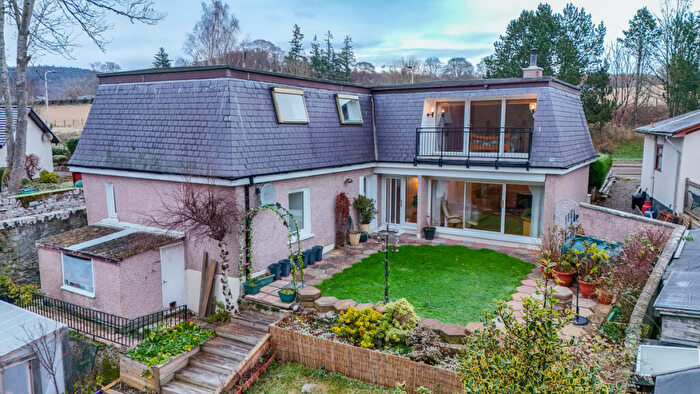
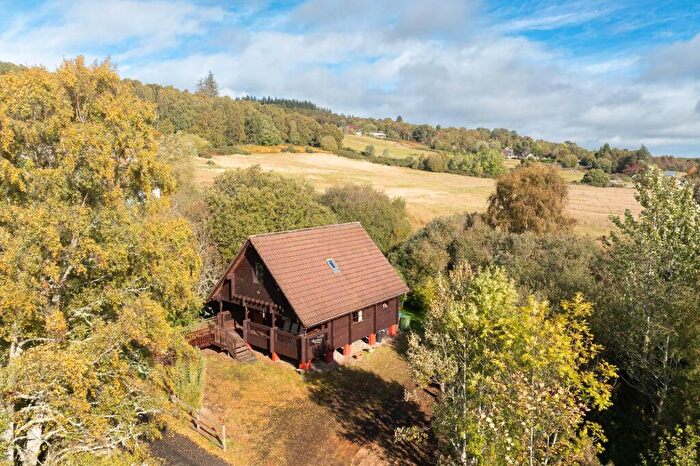
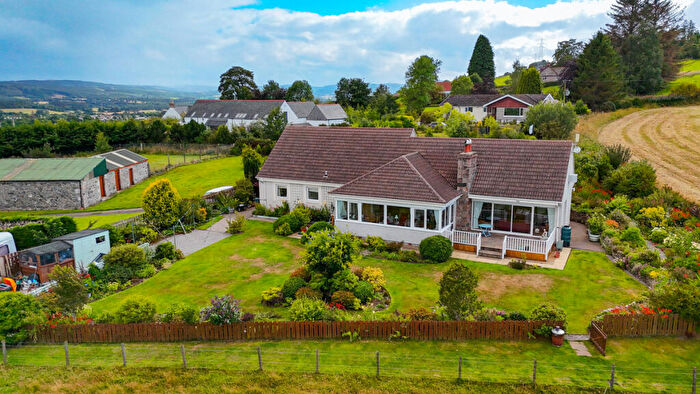
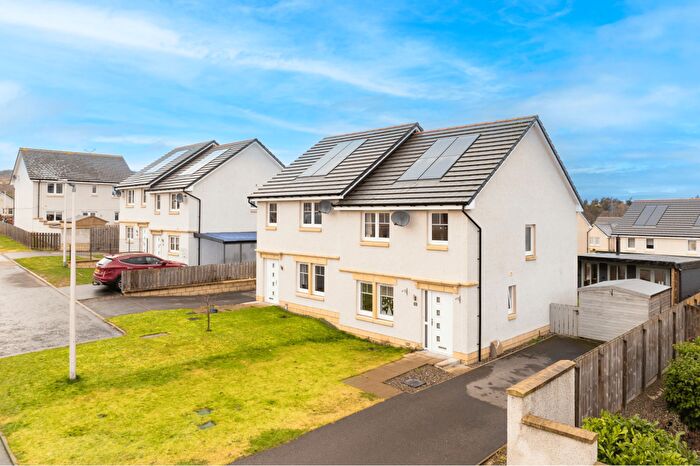
Previously listed properties in Wester Ross, Strathpeffer and Lochalsh
Roads and Postcodes in Wester Ross, Strathpeffer and Lochalsh
Navigate through our locations to find the location of your next house in Wester Ross, Strathpeffer and Lochalsh, Muir Of Ord for sale or to rent.
| Streets | Postcodes |
|---|---|
| Achonachie Road | IV6 7QE |
| Baddon Drive | IV6 7QH |
| Balloan Road | IV6 7XD |
| Black Dyke | IV6 7UZ |
| Ord Road | IV6 7UN |
| The Brae | IV6 7UP |
| Upper Arcan Road | IV6 7UD |
| IV6 7QD IV6 7QF IV6 7QG IV6 7QQ IV6 7UL IV6 7UR IV6 7UT IV6 7UU IV6 7UW IV6 7UX IV6 7XA |
Transport near Wester Ross, Strathpeffer and Lochalsh
- FAQ
- Price Paid By Year
Frequently asked questions about Wester Ross, Strathpeffer and Lochalsh
What is the average price for a property for sale in Wester Ross, Strathpeffer and Lochalsh?
The average price for a property for sale in Wester Ross, Strathpeffer and Lochalsh is £243,136. This amount is 9% higher than the average price in Muir Of Ord. There are 285 property listings for sale in Wester Ross, Strathpeffer and Lochalsh.
Which train stations are available in or near Wester Ross, Strathpeffer and Lochalsh?
Some of the train stations available in or near Wester Ross, Strathpeffer and Lochalsh are Muir Of Ord, Conon Bridge and Beauly.
Property Price Paid in Wester Ross, Strathpeffer and Lochalsh by Year
The average sold property price by year was:
| Year | Average Sold Price | Price Change |
Sold Properties
|
|---|---|---|---|
| 2022 | £243,136 | -9% |
12 Properties |
| 2021 | £266,000 | 5% |
12 Properties |
| 2020 | £252,000 | 8% |
5 Properties |
| 2019 | £230,812 | 25% |
9 Properties |
| 2018 | £172,178 | 17% |
14 Properties |
| 2017 | £142,422 | -70% |
12 Properties |
| 2016 | £242,555 | 13% |
9 Properties |
| 2015 | £210,461 | 19% |
13 Properties |
| 2014 | £171,220 | 4% |
12 Properties |
| 2013 | £163,700 | -10% |
10 Properties |
| 2012 | £179,285 | 19% |
7 Properties |
| 2011 | £146,000 | -107% |
3 Properties |
| 2010 | £302,192 | 32% |
6 Properties |
| 2009 | £207,000 | 15% |
8 Properties |
| 2008 | £176,420 | -18% |
8 Properties |
| 2007 | £208,583 | 21% |
9 Properties |
| 2006 | £164,458 | -1% |
11 Properties |
| 2005 | £165,378 | 24% |
17 Properties |
| 2004 | £125,532 | -61% |
11 Properties |
| 2003 | £201,493 | 73% |
10 Properties |
| 2001 | £54,945 | - |
1 Property |

