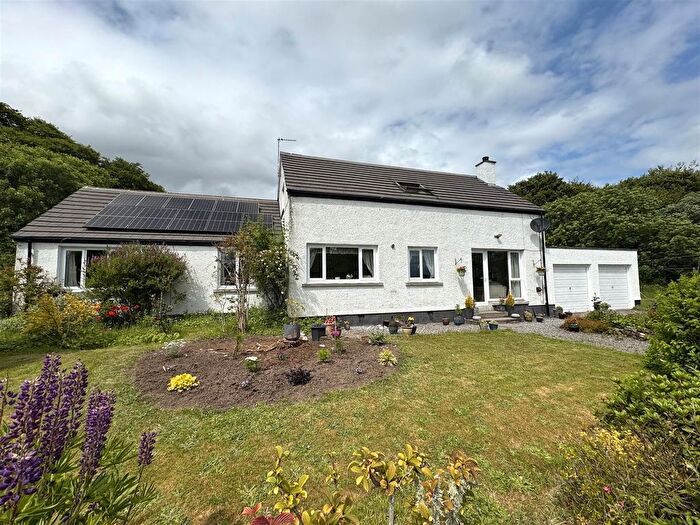
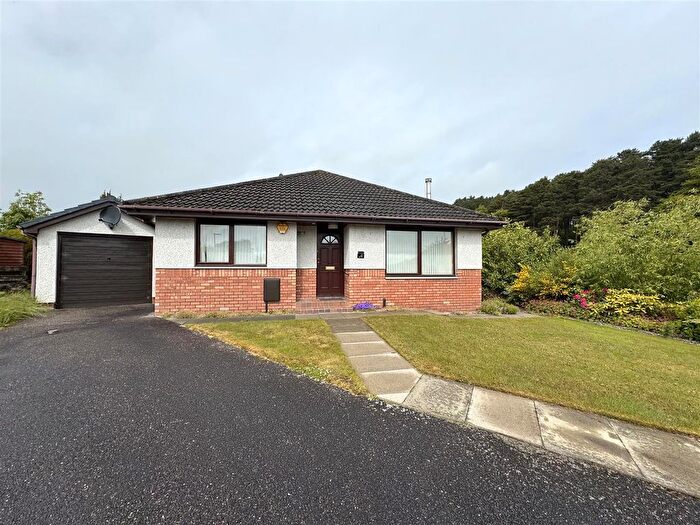
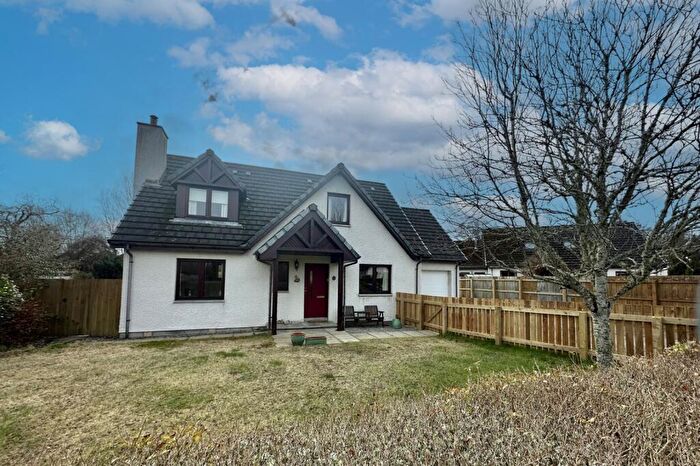
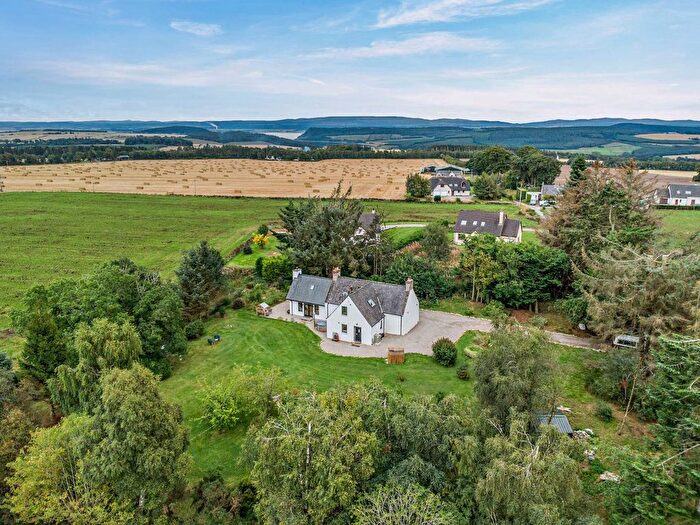
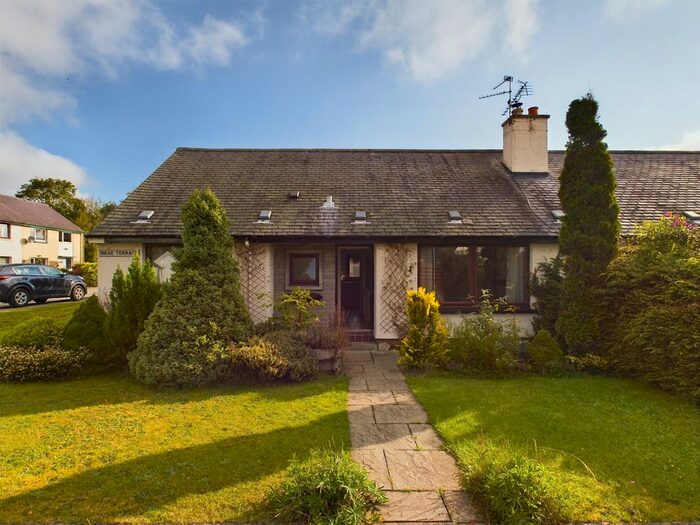
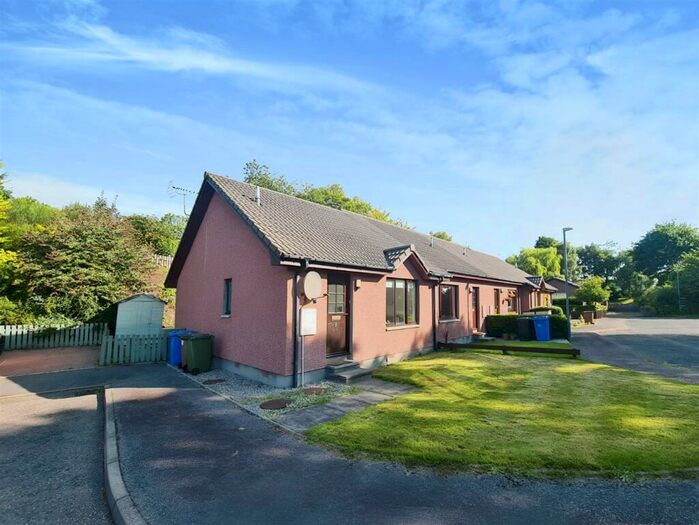
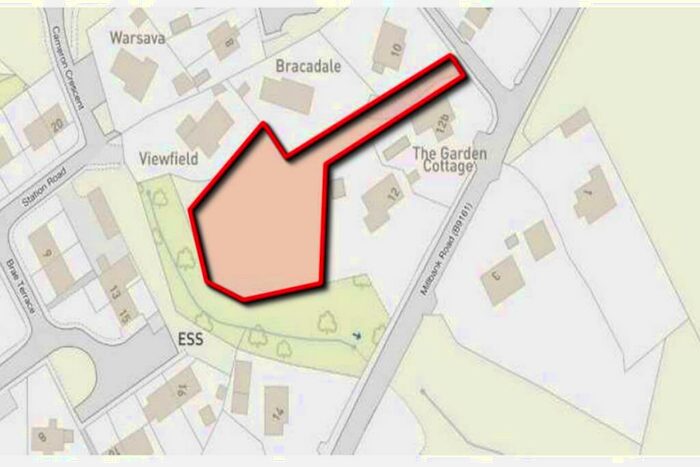
Houses for sale & to rent in Black Isle, Munlochy
House Prices in Black Isle
Properties in Black Isle have an average house price of £211,875.00 and had 8 Property Transactions within the last 3 years¹.
Black Isle is an area in Munlochy, Highland with 354 households², where the most expensive property was sold for £300,000.00.
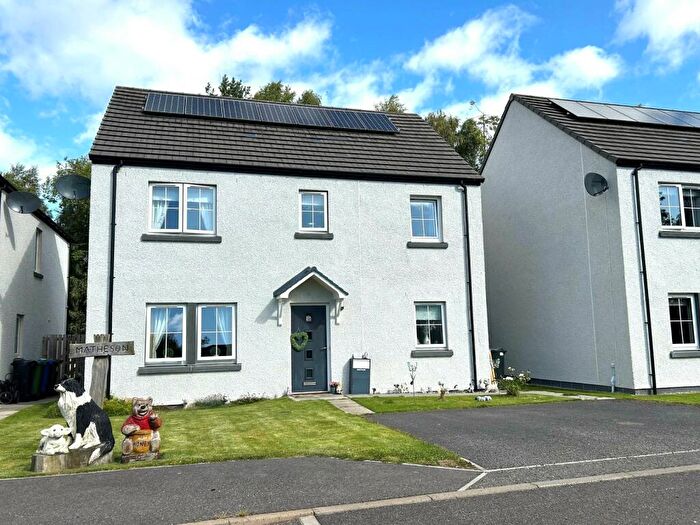
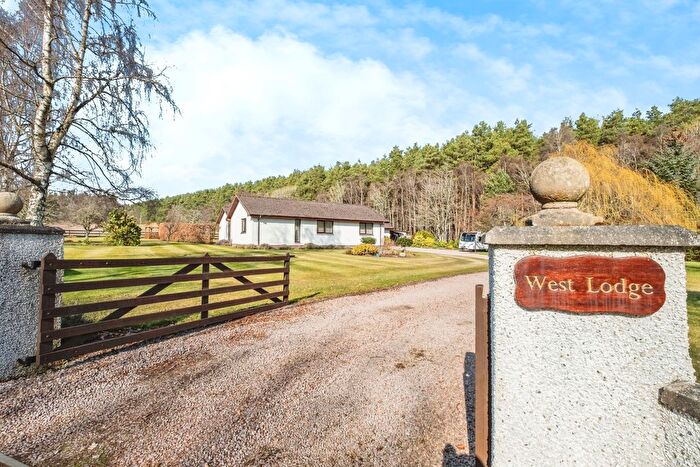
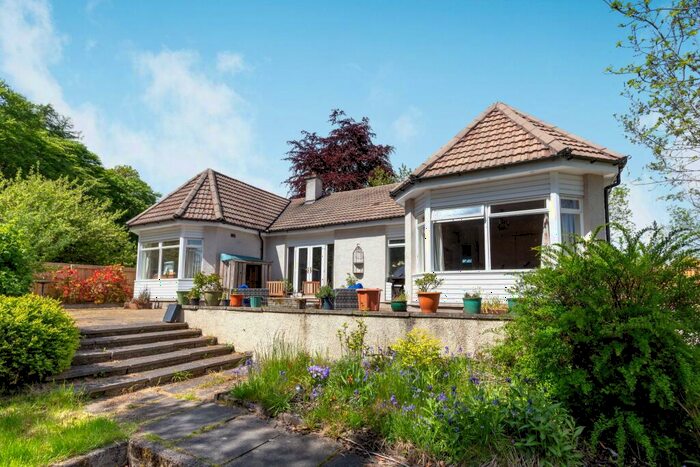
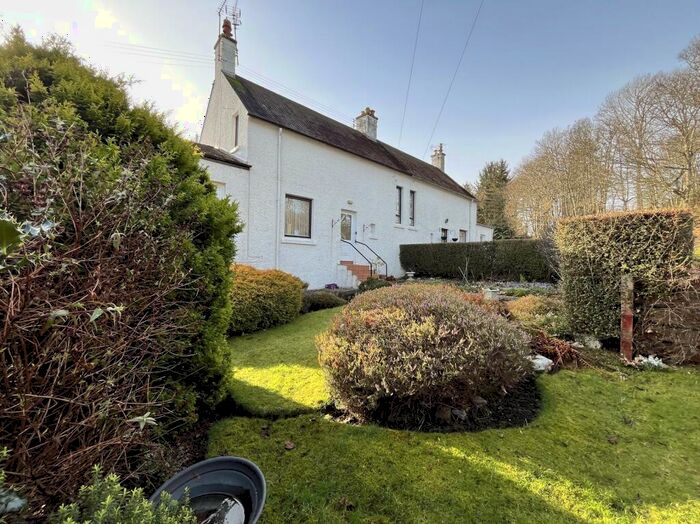
Previously listed properties in Black Isle
Roads and Postcodes in Black Isle
Navigate through our locations to find the location of your next house in Black Isle, Munlochy for sale or to rent.
| Streets | Postcodes |
|---|---|
| Balmore | IV8 8NS |
| Belmaduthy Gardens | IV8 8AD |
| Brae Park | IV8 8PJ |
| Brae Terrace | IV8 8NG |
| Burn Place | IV8 8NJ |
| Cameron Crescent | IV8 8NR |
| Cameron Drive | IV8 8NT |
| Greenfield Road | IV8 8NF |
| Hillpark Brae | IV8 8PL |
| Littleburn Road | IV8 8NN |
| Millbank Park | IV8 8NU |
| Millbank Road | IV8 8ND IV8 8NL |
| Stables Court | IV8 8PN |
| Station Court | IV8 8NA |
| Station Road | IV8 8NQ |
| Wellside Close | IV8 8PP |
| IV8 8AB IV8 8NE IV8 8NH IV8 8NP IV8 8NW IV8 8NY IV8 8NZ IV8 8PA IV8 8PB IV8 8PD IV8 8PE IV8 8PF IV8 8PG IV8 8PH IV8 8PQ |
Transport near Black Isle
-
Inverness Station
-
Dingwall Station
-
Conon Bridge Station
-
Muir Of Ord Station
-
Beauly Station
-
Alness Station
-
Invergordon Station
- FAQ
- Price Paid By Year
Frequently asked questions about Black Isle
What is the average price for a property for sale in Black Isle?
The average price for a property for sale in Black Isle is £211,875. There are 44 property listings for sale in Black Isle.
What streets have the most expensive properties for sale in Black Isle?
The streets with the most expensive properties for sale in Black Isle are Belmaduthy Gardens at an average of £278,333 and Station Court at an average of £150,500.
What streets have the most affordable properties for sale in Black Isle?
The street with the most affordable properties for sale in Black Isle is Brae Terrace at an average of £139,000.
Which train stations are available in or near Black Isle?
Some of the train stations available in or near Black Isle are Inverness, Dingwall and Conon Bridge.
Property Price Paid in Black Isle by Year
The average sold property price by year was:
| Year | Average Sold Price | Price Change |
Sold Properties
|
|---|---|---|---|
| 2025 | £227,500 | -0,2% |
2 Properties |
| 2024 | £228,000 | 19% |
3 Properties |
| 2023 | £185,333 | -82% |
3 Properties |
| 2022 | £337,488 | -3% |
9 Properties |
| 2021 | £347,383 | 39% |
14 Properties |
| 2020 | £211,750 | -9% |
10 Properties |
| 2019 | £231,842 | -5% |
21 Properties |
| 2018 | £244,084 | -7% |
16 Properties |
| 2017 | £260,981 | -4% |
11 Properties |
| 2016 | £271,850 | 24% |
8 Properties |
| 2015 | £205,800 | -1% |
10 Properties |
| 2014 | £207,115 | -2% |
13 Properties |
| 2013 | £211,625 | 7% |
12 Properties |
| 2012 | £196,115 | 6% |
13 Properties |
| 2011 | £184,000 | -38% |
5 Properties |
| 2010 | £253,500 | 12% |
5 Properties |
| 2009 | £223,400 | 11% |
5 Properties |
| 2008 | £199,648 | -110% |
12 Properties |
| 2007 | £418,968 | 52% |
16 Properties |
| 2006 | £199,599 | 24% |
13 Properties |
| 2005 | £152,295 | -13% |
13 Properties |
| 2004 | £171,640 | 31% |
17 Properties |
| 2003 | £117,905 | 32% |
10 Properties |
| 2002 | £79,766 | -70% |
3 Properties |
| 2000 | £135,250 | - |
1 Property |

