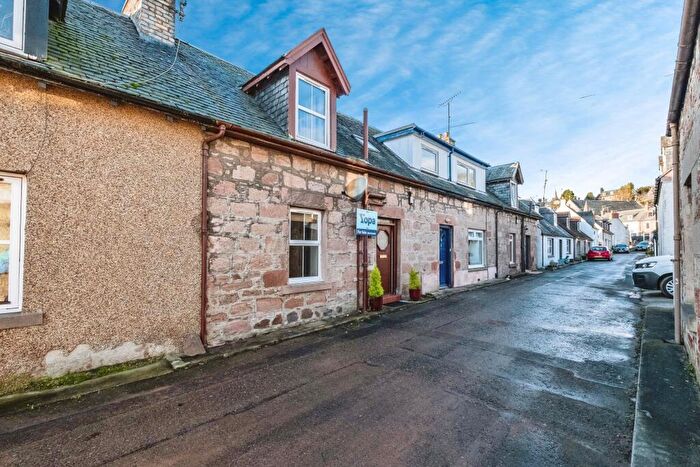
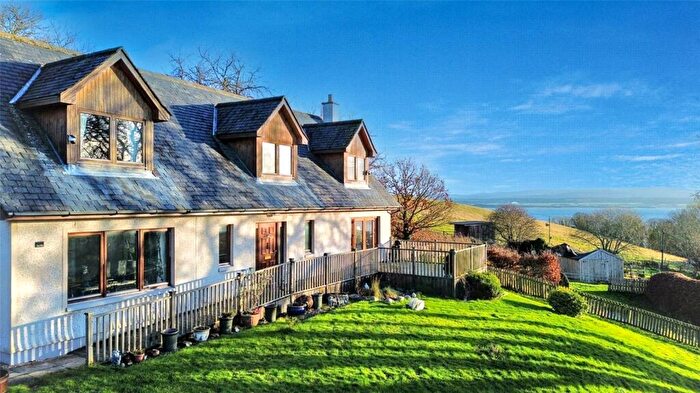
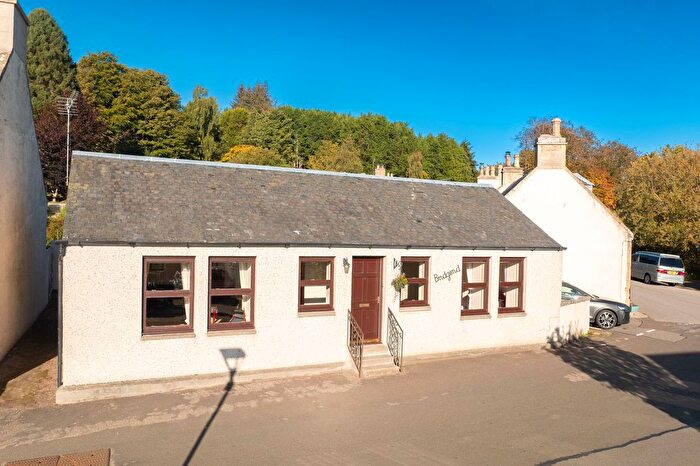
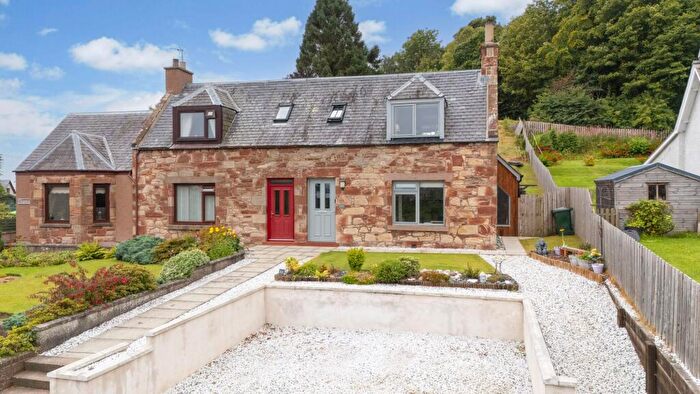
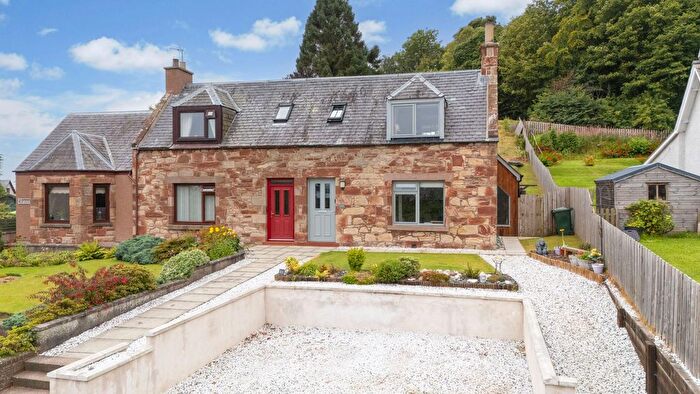
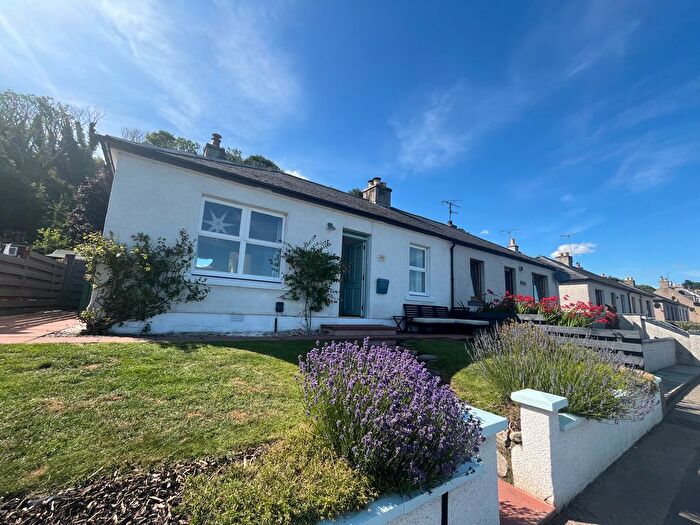
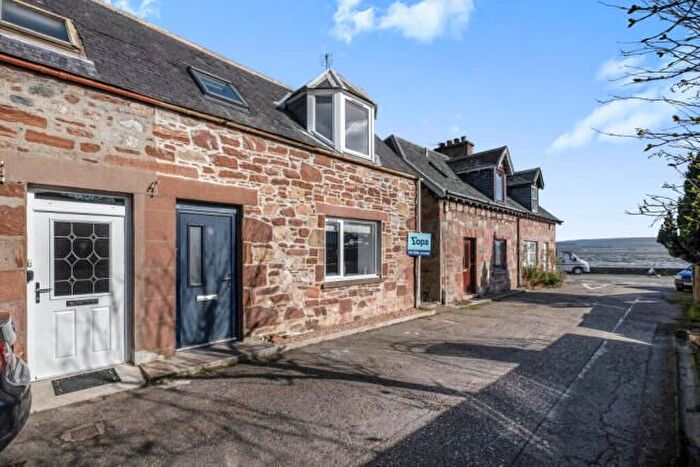
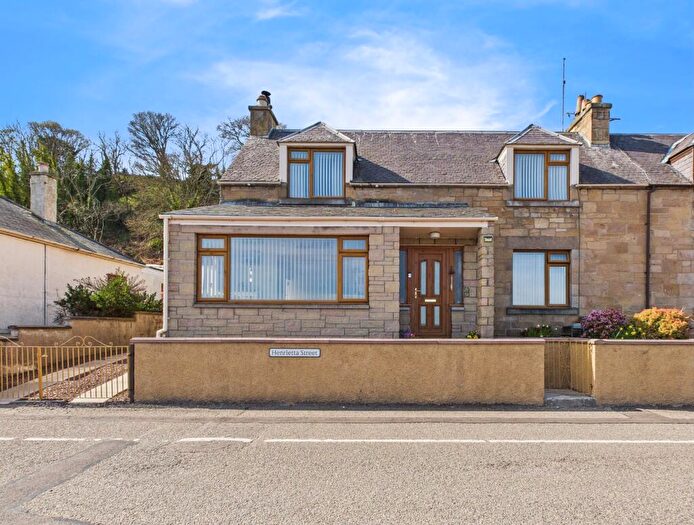
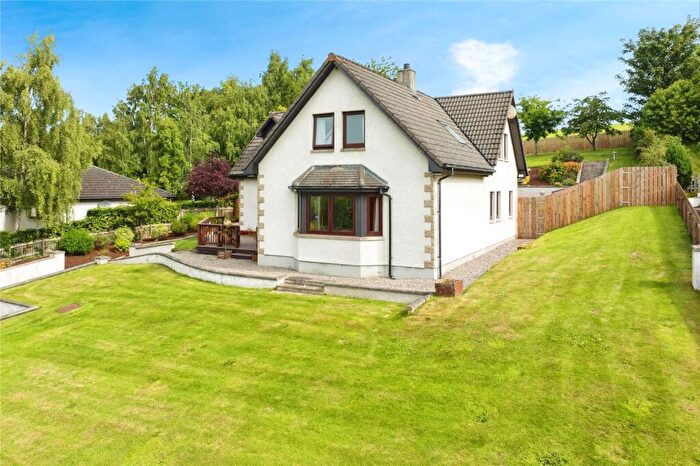
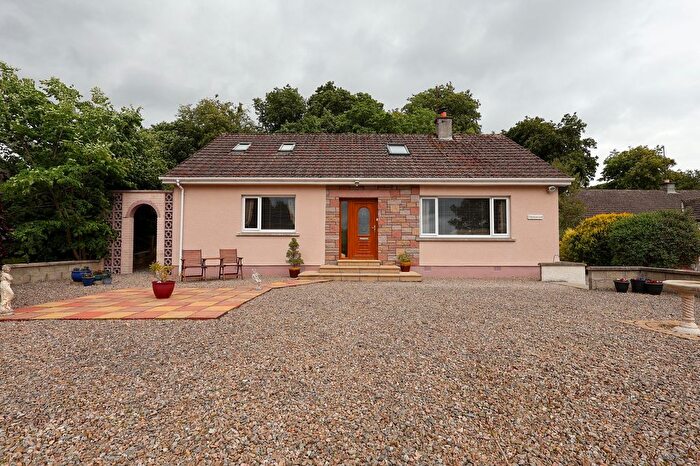
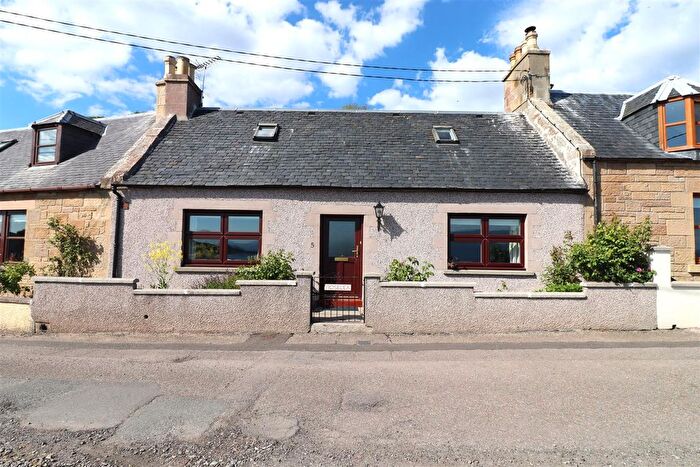
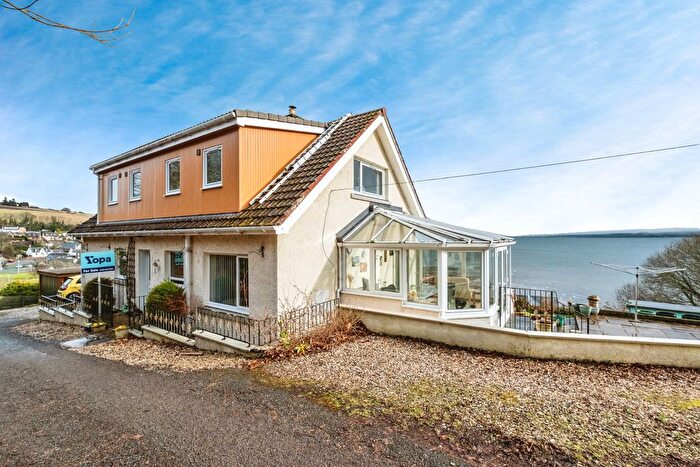
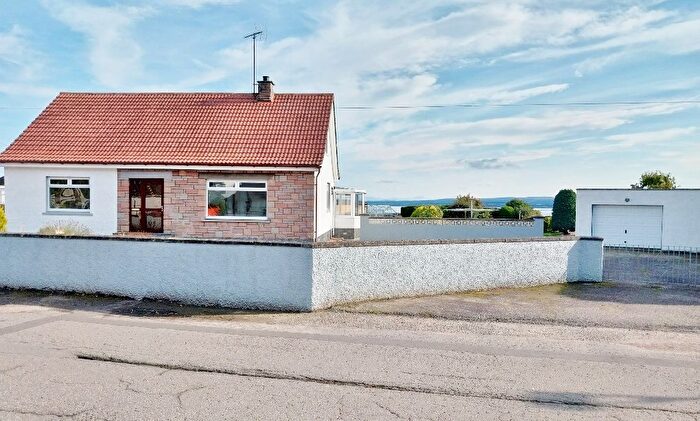
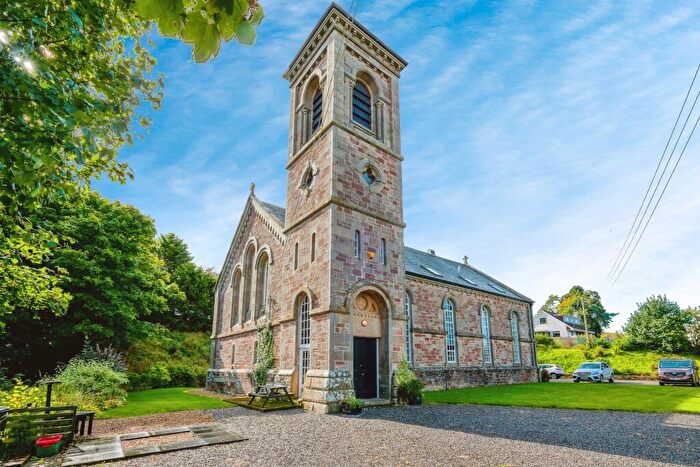
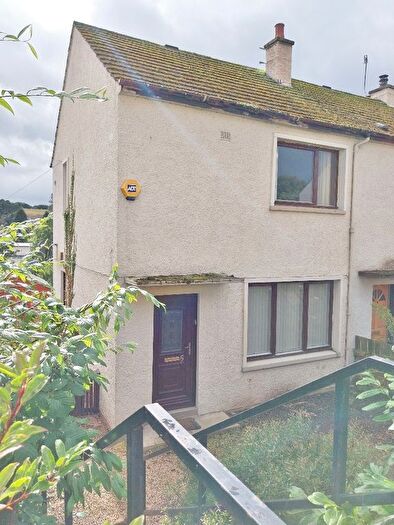
Houses for sale & to rent in Black Isle, Avoch
House Prices in Black Isle
Properties in Black Isle have an average house price of £196,815.00 and had 19 Property Transactions within the last 3 years¹.
Black Isle is an area in Avoch, Highland with 559 households², where the most expensive property was sold for £467,500.00.
Properties for sale in Black Isle
Previously listed properties in Black Isle
Roads and Postcodes in Black Isle
Navigate through our locations to find the location of your next house in Black Isle, Avoch for sale or to rent.
| Streets | Postcodes |
|---|---|
| Alexander Street | IV9 8QA |
| Anderson Drive | IV9 8RH |
| Bridge Street | IV9 8PP |
| Burnfarm Cottages | IV9 8RG |
| Factory Lane | IV9 8QE |
| Fletcher Gardens | IV9 8RA |
| Gallowhill | IV9 8QS |
| George Street | IV9 8PU |
| Gowans Place | IV9 8QZ |
| Henrietta Street | IV9 8QT |
| High Street | IV9 8PT |
| James Street | IV9 8QB |
| John Street | IV9 8PZ |
| Knockmuir View | IV9 8RY |
| Lady Hill View | IV9 8RU |
| Long Road | IV9 8QR |
| Mackay Terrace | IV9 8QY |
| Mackenzie Place | IV9 8QN IV9 8QP IV9 8QW |
| Mannsfield Place | IV9 8AD |
| Manse Drive | IV9 8QX |
| Margaret Street | IV9 8PX |
| Moray Wynd | IV9 8PW |
| Ormonde Terrace | IV9 8QU |
| Park Street | IV9 8QQ |
| Rose Place | IV9 8QH |
| Rose Street | IV9 8QF |
| Rosehaugh Crescent | IV9 8RS |
| Rosehaugh East Drive | IV9 8RE |
| Rosehaugh High Drive | IV9 8RX |
| School Brae | IV9 8QJ |
| Shore Street | IV9 8QD |
| Station Road | IV9 8PS IV9 8RW |
| The Dock | IV9 8QG |
| Toll Road | IV9 8PA IV9 8PR |
| IV9 8AB IV9 8QL IV9 8RD IV9 8RF IV9 8RN IV9 8RP IV9 8RQ IV9 8RT IV9 8YW |
Transport near Black Isle
- FAQ
- Price Paid By Year
Frequently asked questions about Black Isle
What is the average price for a property for sale in Black Isle?
The average price for a property for sale in Black Isle is £196,815. There are 77 property listings for sale in Black Isle.
What streets have the most expensive properties for sale in Black Isle?
The streets with the most expensive properties for sale in Black Isle are Henrietta Street at an average of £197,500, Burnfarm Cottages at an average of £182,000 and Margaret Street at an average of £180,833.
What streets have the most affordable properties for sale in Black Isle?
The streets with the most affordable properties for sale in Black Isle are George Street at an average of £155,000, Mackenzie Place at an average of £155,000 and Ormonde Terrace at an average of £168,000.
Which train stations are available in or near Black Isle?
Some of the train stations available in or near Black Isle are Inverness, Invergordon and Alness.
Property Price Paid in Black Isle by Year
The average sold property price by year was:
| Year | Average Sold Price | Price Change |
Sold Properties
|
|---|---|---|---|
| 2025 | £159,333 | -9% |
3 Properties |
| 2024 | £174,250 | -34% |
8 Properties |
| 2023 | £233,437 | -9% |
8 Properties |
| 2022 | £253,417 | 18% |
24 Properties |
| 2021 | £208,775 | 16% |
22 Properties |
| 2020 | £174,739 | 3% |
23 Properties |
| 2019 | £168,838 | -9% |
30 Properties |
| 2018 | £183,816 | 9% |
23 Properties |
| 2017 | £166,881 | 15% |
27 Properties |
| 2016 | £142,289 | -21% |
23 Properties |
| 2015 | £172,737 | -9% |
19 Properties |
| 2014 | £188,163 | 12% |
25 Properties |
| 2013 | £164,644 | 8% |
18 Properties |
| 2012 | £150,939 | 26% |
15 Properties |
| 2011 | £111,641 | 3% |
6 Properties |
| 2010 | £108,339 | -9% |
14 Properties |
| 2009 | £118,424 | -27% |
15 Properties |
| 2008 | £150,903 | -25% |
18 Properties |
| 2007 | £187,943 | 22% |
30 Properties |
| 2006 | £146,560 | 23% |
19 Properties |
| 2005 | £112,842 | 6% |
38 Properties |
| 2004 | £105,653 | 29% |
32 Properties |
| 2003 | £74,533 | -31% |
9 Properties |
| 2002 | £97,540 | 38% |
7 Properties |
| 2001 | £60,000 | 20% |
1 Property |
| 2000 | £48,000 | - |
1 Property |

