
Houses for sale & to rent in North, West and Central Sutherland, Thurso
House Prices in North, West and Central Sutherland
Properties in North, West and Central Sutherland have an average house price of £94k and had 7 Property Transactions within the last 3 years¹.
North, West and Central Sutherland is an area in Thurso, Highland with 457 households², where the most expensive property was sold for £135k.
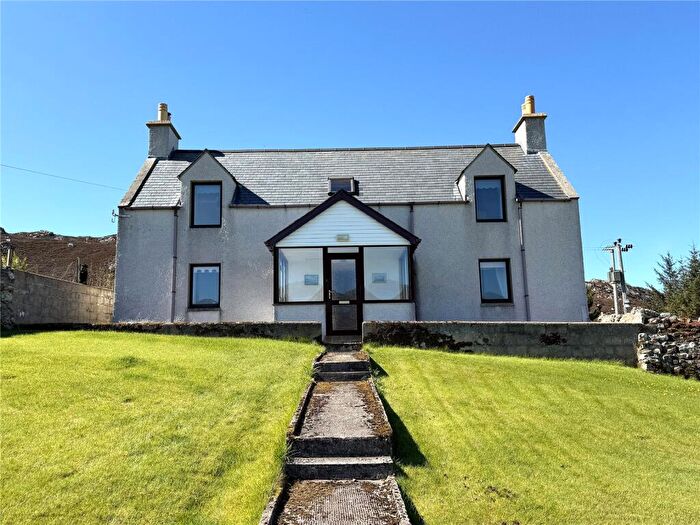
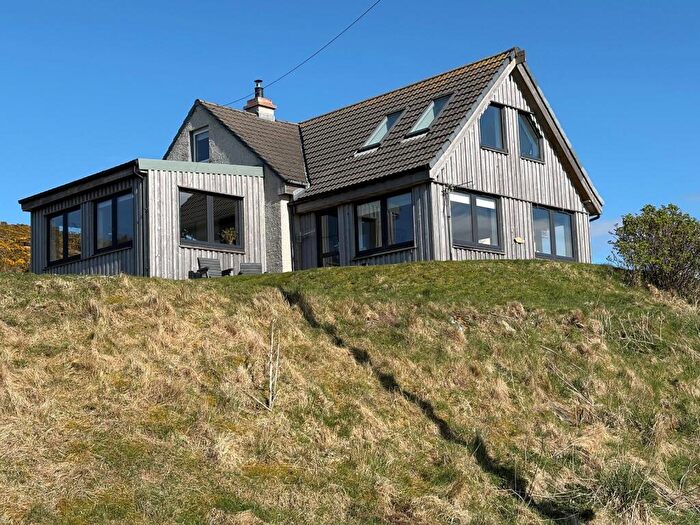
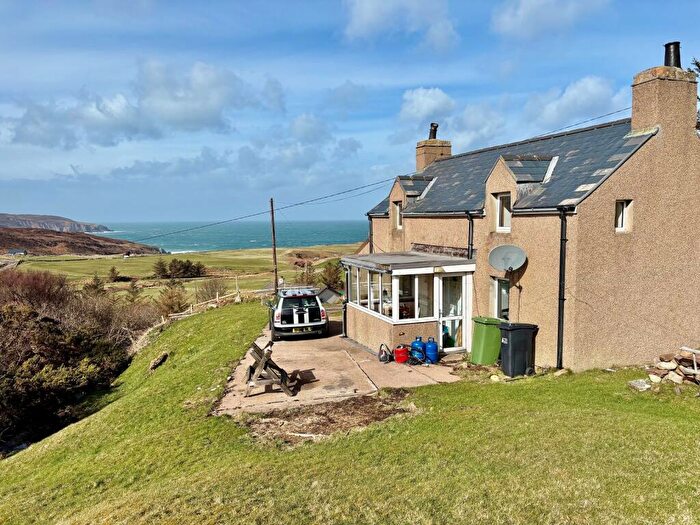
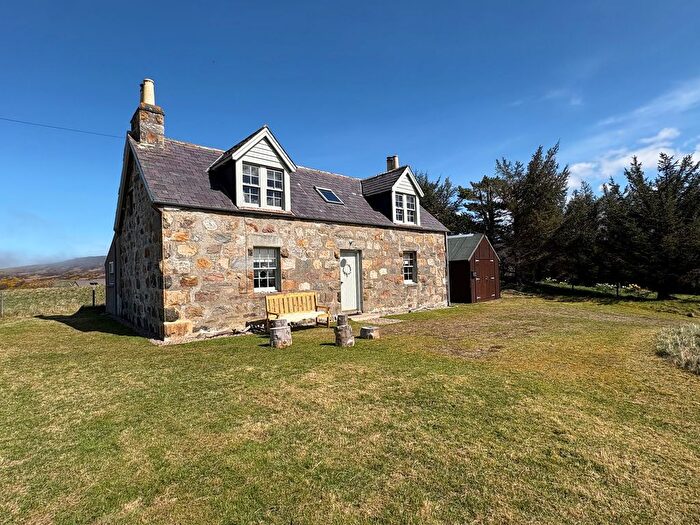
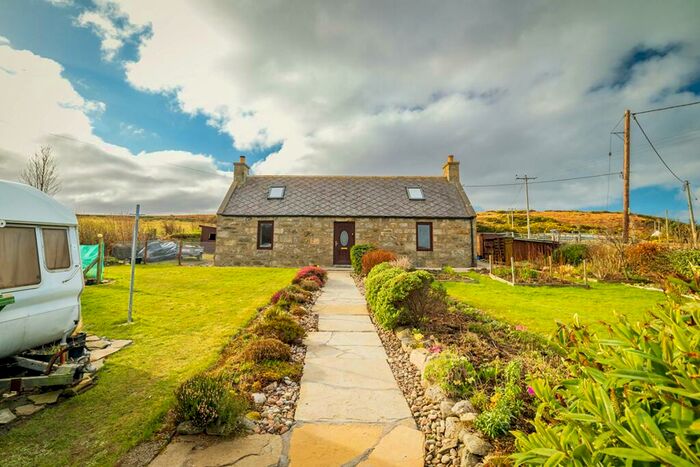
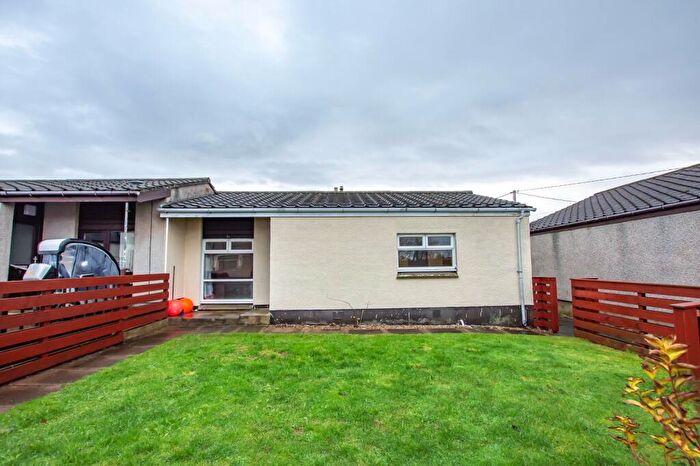
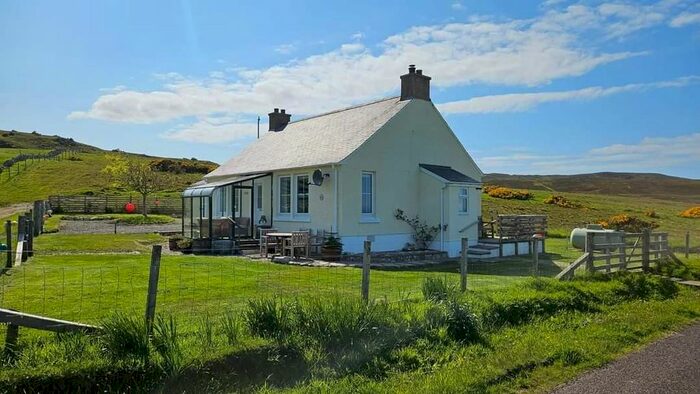
Properties for sale in North, West and Central Sutherland


![]()
If you are looking to sell your house, let it out, or receive a property valuation, an expert can help you.
Click the button below to get started.
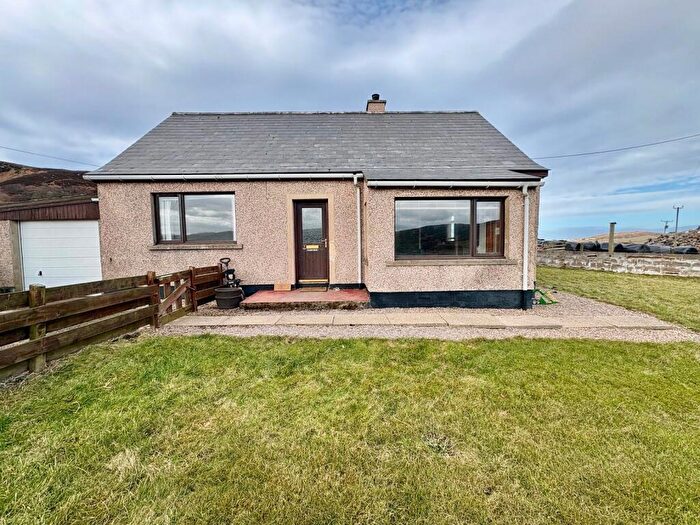
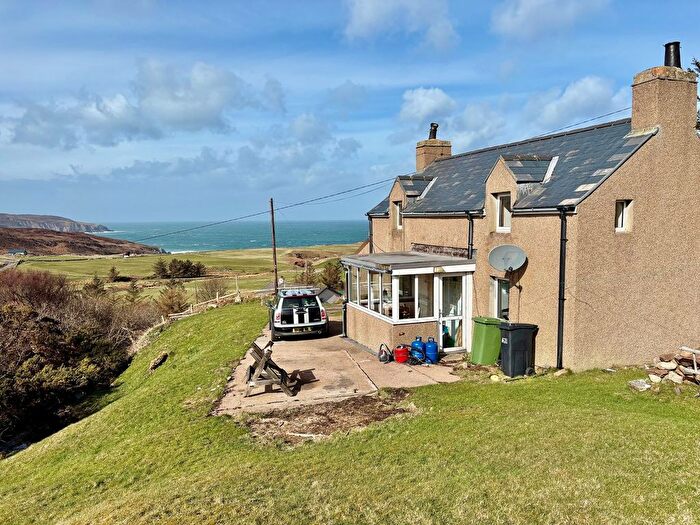
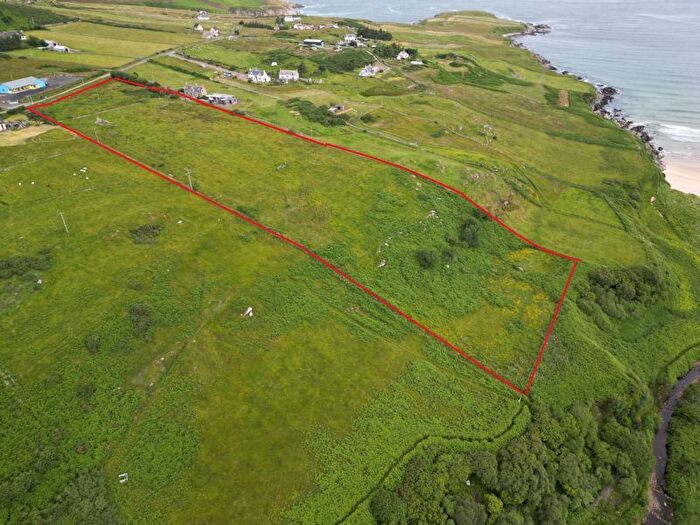
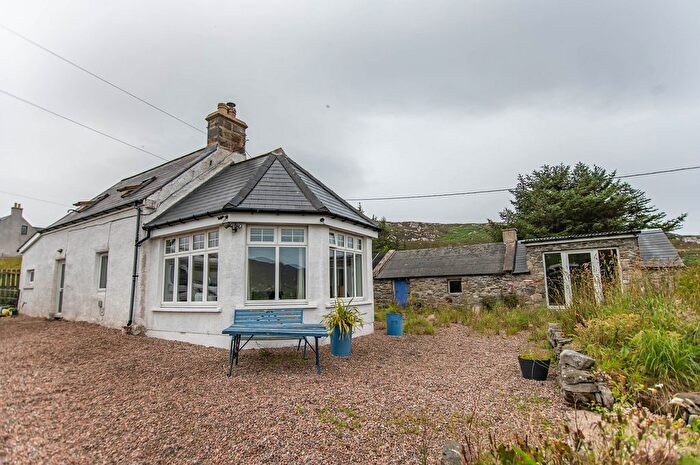
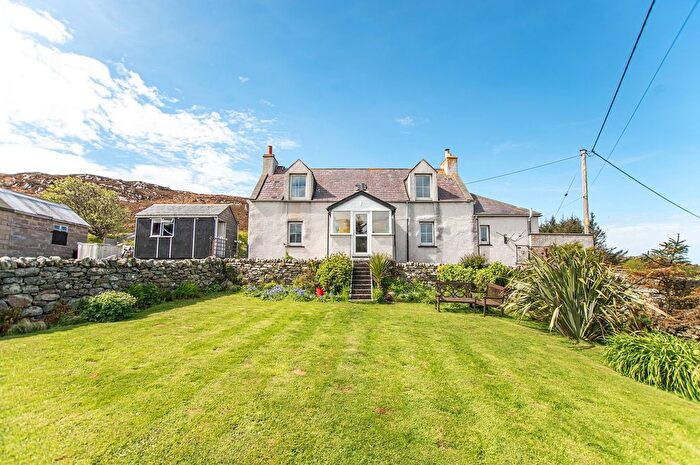
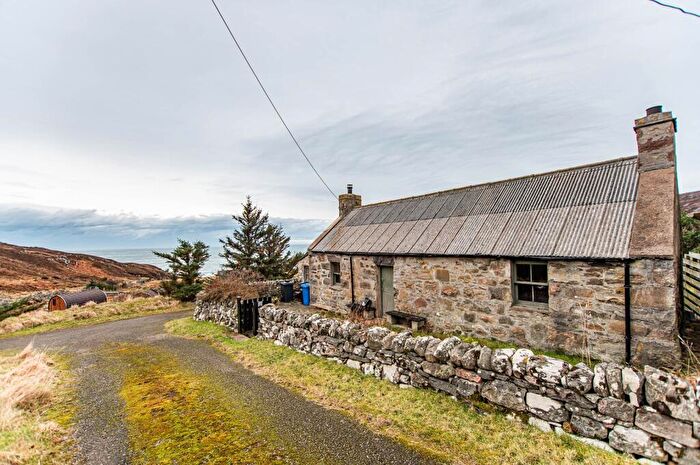
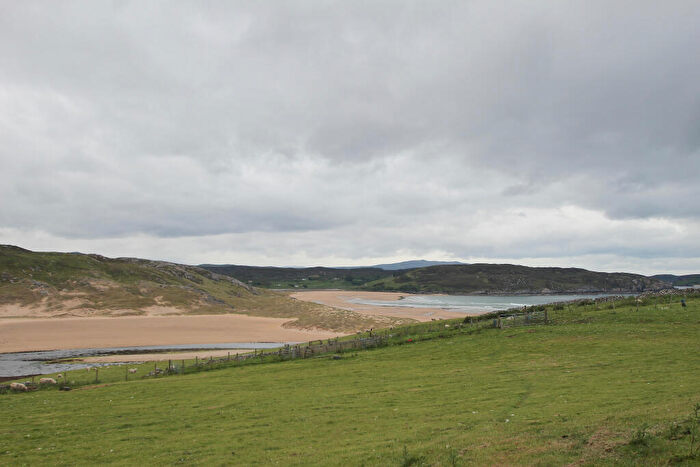
Previously listed properties in North, West and Central Sutherland

![]()
If you are looking to sell your house, let it out, or receive a property valuation, an expert can help you.
Click the button below to get started.


Roads and Postcodes in North, West and Central Sutherland
Navigate through our locations to find the location of your next house in North, West and Central Sutherland, Thurso for sale or to rent.
| Streets | Postcodes |
|---|---|
| Bayview Avenue | KW14 7YW |
| Bayview Terrace | KW14 7YP |
| Bettyhill | KW14 7SG KW14 7SP KW14 7SQ KW14 7SS KW14 7SZ KW14 7TA KW14 7TB |
| Gordon Terrace | KW14 7SX |
| Mackay Terrace | KW14 7YR |
| Mackenzie Crescent | KW14 7SY |
| Melvich Industrial Estate | KW14 7YQ |
| Melvich Terrace | KW14 7YT |
| Munro Place | KW14 7TD |
| Newlands | KW14 7SR |
| Park Drive | KW14 7SU |
| Pentland Terrace | KW14 7YS |
| Rossal Place | KW14 7ST |
| Shore Street | KW14 7YN |
| Sinclair Court | KW14 7YU |
| Sinclair Gardens | KW14 7YX |
| Steven Terrace | KW14 7SB |
| KW14 7RY KW14 7RZ KW14 7SA KW14 7TH KW14 7TJ KW14 7YJ KW14 7YL |
Transport near North, West and Central Sutherland

- FAQ
- Price Paid By Year
Frequently asked questions about North, West and Central Sutherland
What is the average price for a property for sale in North, West and Central Sutherland?
The average price for a property for sale in North, West and Central Sutherland is £94,285. This amount is 30% lower than the average price in Thurso. There are 46 property listings for sale in North, West and Central Sutherland.
What streets have the most expensive properties for sale in North, West and Central Sutherland?
The street with the most expensive properties for sale in North, West and Central Sutherland is Mackenzie Crescent at an average of £111,000.
What streets have the most affordable properties for sale in North, West and Central Sutherland?
The street with the most affordable properties for sale in North, West and Central Sutherland is Bayview Terrace at an average of £105,000.
Which train stations are available in or near North, West and Central Sutherland?
Some of the train stations available in or near North, West and Central Sutherland are Forsinard, Altnabreac and Scotscalder.
Property Price Paid in North, West and Central Sutherland by Year
The average sold property price by year was:
| Year | Average Sold Price | Price Change |
Sold Properties
|
|---|---|---|---|
| 2025 | £95,000 | -12% |
1 Property |
| 2024 | £106,500 | 17% |
2 Properties |
| 2023 | £88,000 | -113% |
4 Properties |
| 2022 | £187,611 | 20% |
18 Properties |
| 2021 | £149,157 | 14% |
19 Properties |
| 2020 | £128,181 | 10% |
11 Properties |
| 2019 | £115,909 | 11% |
8 Properties |
| 2018 | £103,605 | 3% |
19 Properties |
| 2017 | £100,453 | 5% |
13 Properties |
| 2016 | £95,491 | -1% |
12 Properties |
| 2015 | £96,470 | -17% |
17 Properties |
| 2014 | £112,615 | 19% |
13 Properties |
| 2013 | £91,302 | -31% |
11 Properties |
| 2012 | £119,500 | -2% |
8 Properties |
| 2011 | £122,285 | 70% |
14 Properties |
| 2010 | £36,858 | -149% |
7 Properties |
| 2009 | £91,687 | 19% |
8 Properties |
| 2008 | £74,200 | -16% |
10 Properties |
| 2007 | £86,114 | 49% |
17 Properties |
| 2006 | £43,706 | -23% |
13 Properties |
| 2005 | £53,731 | -42% |
15 Properties |
| 2004 | £76,062 | 47% |
13 Properties |
| 2003 | £40,462 | 6% |
19 Properties |
| 2002 | £38,000 | 2% |
2 Properties |
| 2001 | £37,139 | -37% |
2 Properties |
| 2000 | £51,000 | - |
1 Property |