
Houses for sale & to rent in Thurso and Northwest Caithness, Wick
House Prices in Thurso and Northwest Caithness
Properties in Thurso and Northwest Caithness have an average house price of £120k and had 1 Property Transaction within the last 3 years¹.
Thurso and Northwest Caithness is an area in Wick, Highland with 195 households², where the most expensive property was sold for £120k.
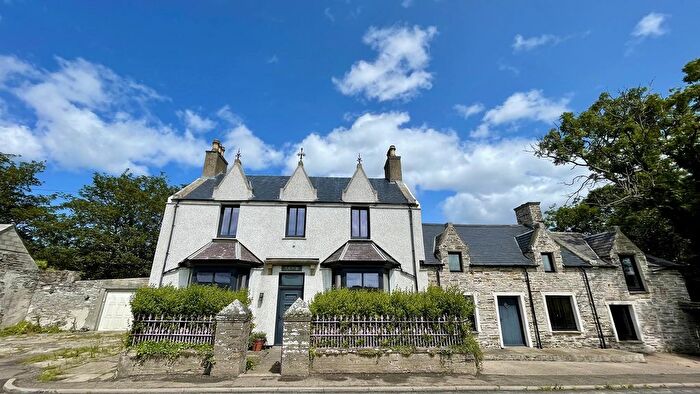
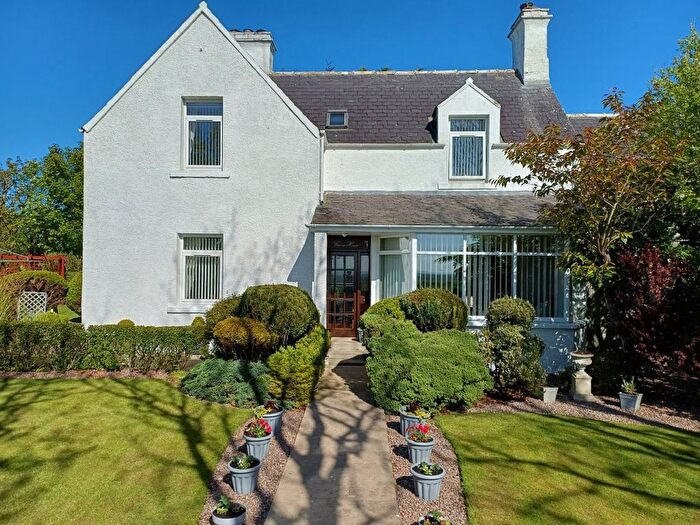
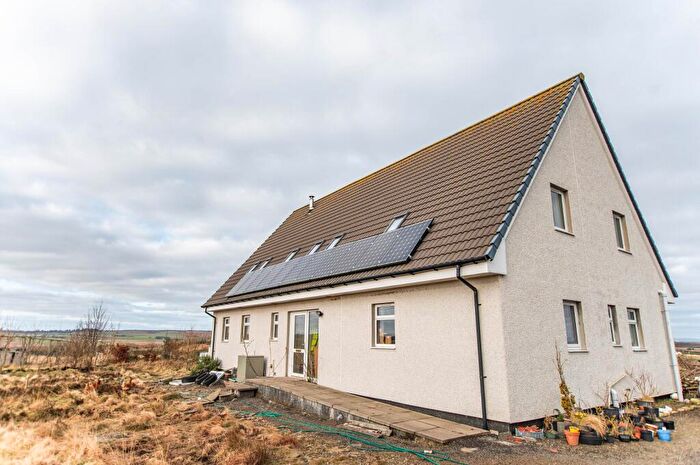
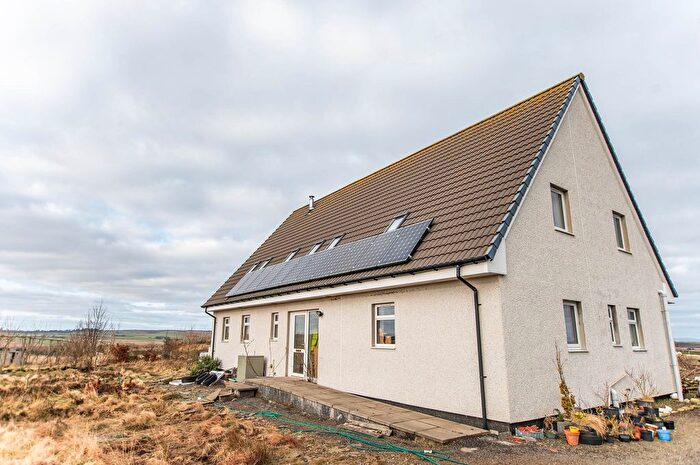
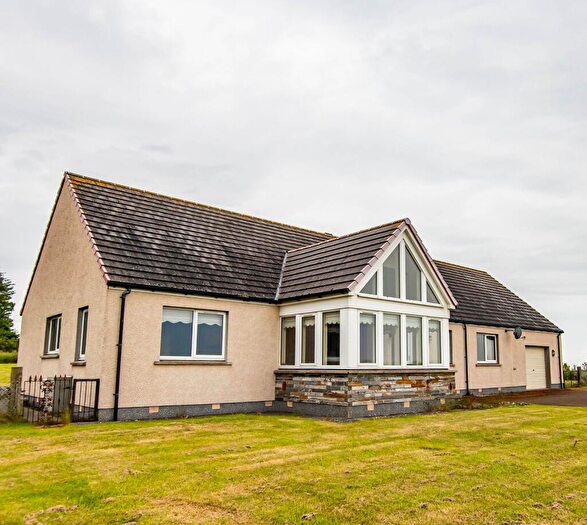
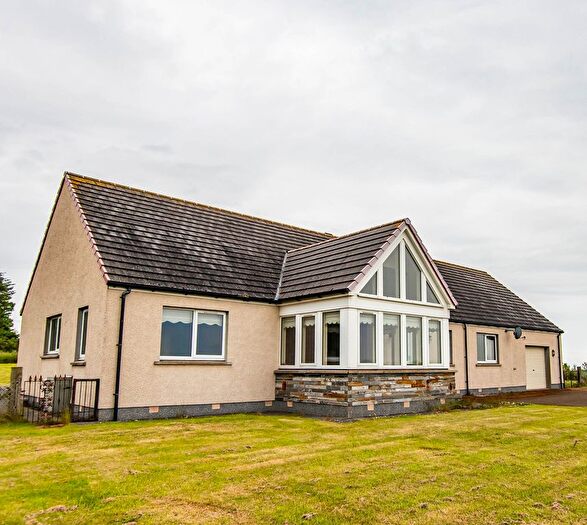
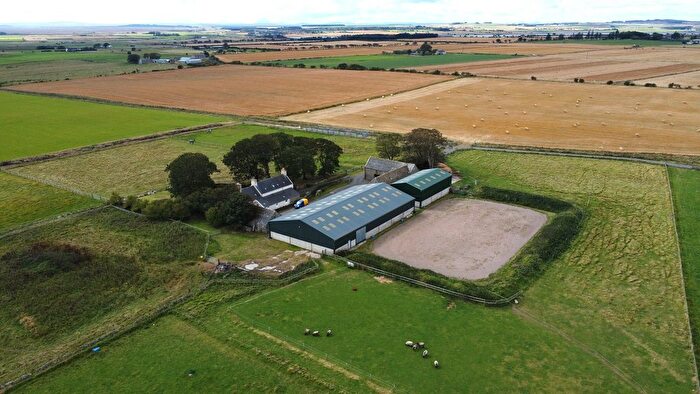
Properties for sale in Thurso and Northwest Caithness
Previously listed properties in Thurso and Northwest Caithness


![]()
If you are looking to sell your house, let it out, or receive a property valuation, an expert can help you.
Click the button below to get started.


Roads and Postcodes in Thurso and Northwest Caithness
Navigate through our locations to find the location of your next house in Thurso and Northwest Caithness, Wick for sale or to rent.
| Streets | Postcodes |
|---|---|
| Auchorn Square | KW1 4TN |
| Bridgend | KW1 5UT |
| Thura Place | KW1 4TS |
| KW1 4TL KW1 4TP KW1 4TR KW1 4TT KW1 4TW KW1 4UE KW1 4UF KW1 4UG KW1 5BU KW1 5UP KW1 5UR KW1 5UU |
Transport near Thurso and Northwest Caithness

- FAQ
- Price Paid By Year
Frequently asked questions about Thurso and Northwest Caithness
What is the average price for a property for sale in Thurso and Northwest Caithness?
The average price for a property for sale in Thurso and Northwest Caithness is £120,000. This amount is 1% lower than the average price in Wick. There are 67 property listings for sale in Thurso and Northwest Caithness.
Which train stations are available in or near Thurso and Northwest Caithness?
Some of the train stations available in or near Thurso and Northwest Caithness are Georgemas Junction, Thurso and Scotscalder.
Property Price Paid in Thurso and Northwest Caithness by Year
The average sold property price by year was:
| Year | Average Sold Price | Price Change |
Sold Properties
|
|---|---|---|---|
| 2024 | £120,000 | -66% |
1 Property |
| 2022 | £199,500 | 32% |
9 Properties |
| 2021 | £135,106 | -37% |
10 Properties |
| 2020 | £185,000 | 31% |
2 Properties |
| 2019 | £127,300 | -84% |
5 Properties |
| 2018 | £234,000 | 51% |
2 Properties |
| 2017 | £114,200 | -27% |
5 Properties |
| 2016 | £145,000 | 20% |
7 Properties |
| 2015 | £115,875 | 9% |
4 Properties |
| 2014 | £106,000 | -31% |
3 Properties |
| 2013 | £138,349 | 11% |
5 Properties |
| 2012 | £123,440 | 46% |
5 Properties |
| 2011 | £66,416 | -111% |
6 Properties |
| 2010 | £140,250 | 17% |
4 Properties |
| 2009 | £116,250 | 6% |
4 Properties |
| 2008 | £109,321 | 31% |
14 Properties |
| 2007 | £74,909 | -1% |
11 Properties |
| 2006 | £75,481 | -32% |
11 Properties |
| 2005 | £99,624 | 45% |
8 Properties |
| 2004 | £54,485 | 61% |
10 Properties |
| 2003 | £21,340 | -247% |
5 Properties |
| 2002 | £74,000 | -5% |
1 Property |
| 2001 | £77,400 | - |
3 Properties |