
Houses for sale & to rent in KW14 7EX, Balimore Place, Thurso and Northwest Caithness, Thurso
House Prices in KW14 7EX, Balimore Place, Thurso and Northwest Caithness
Properties in KW14 7EX have an average house price of £89k and had 2 Property Transactions within the last 3 years.¹ KW14 7EX is a postcode in Balimore Place located in Thurso and Northwest Caithness, an area in Thurso, Highland, with 6 households², where the most expensive property was sold for £95k.
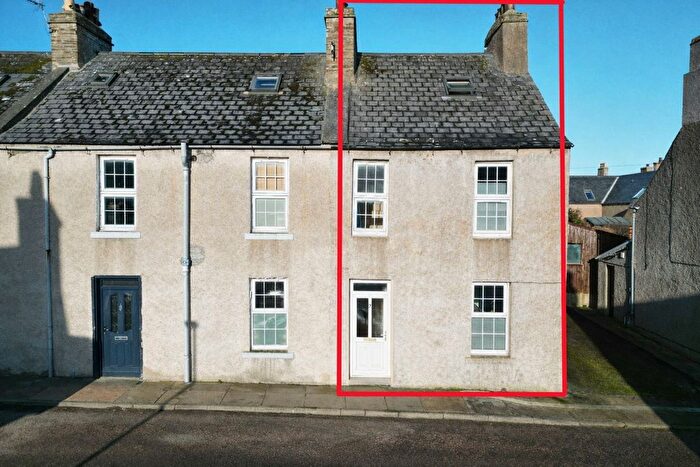
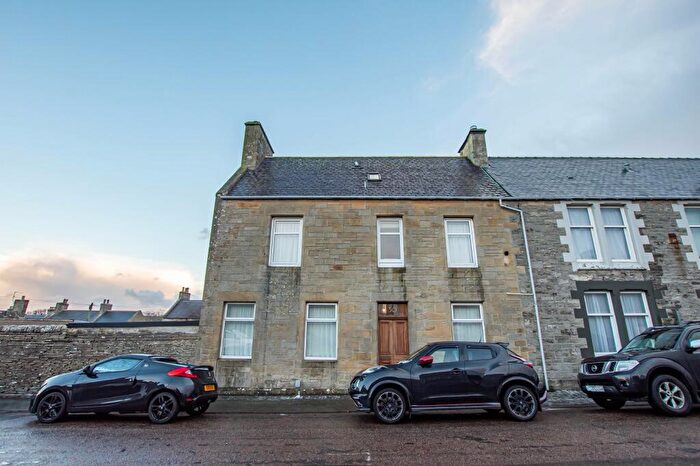
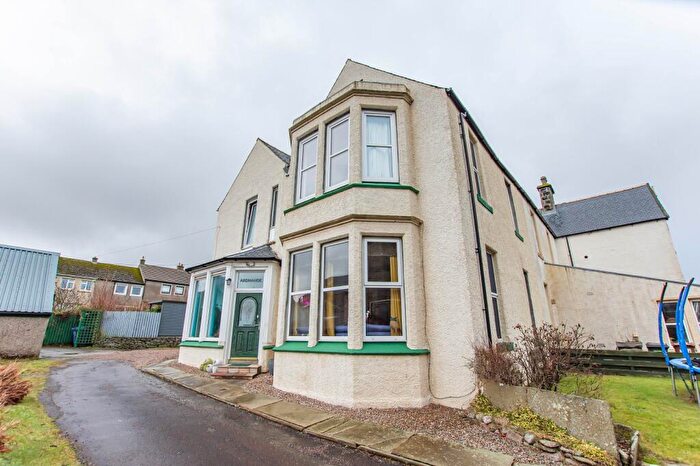
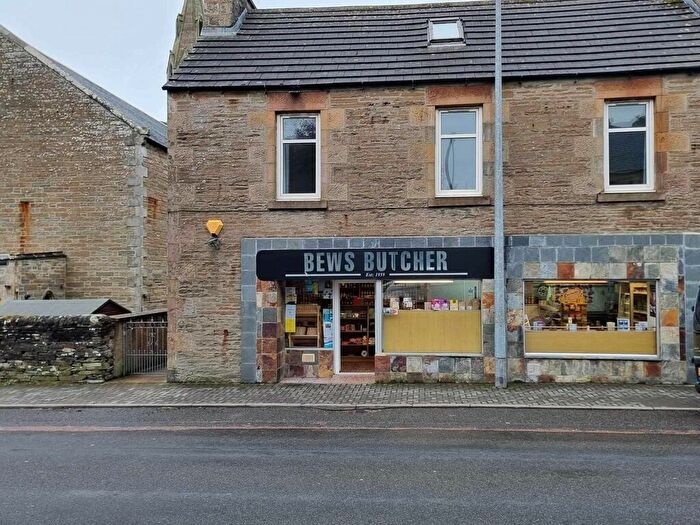
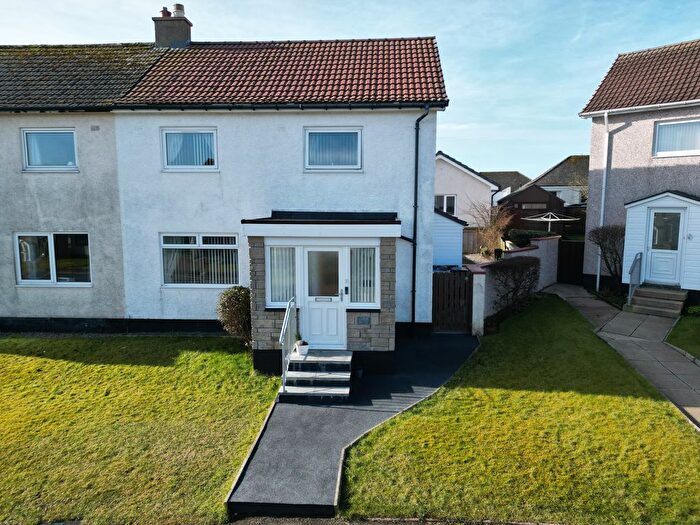
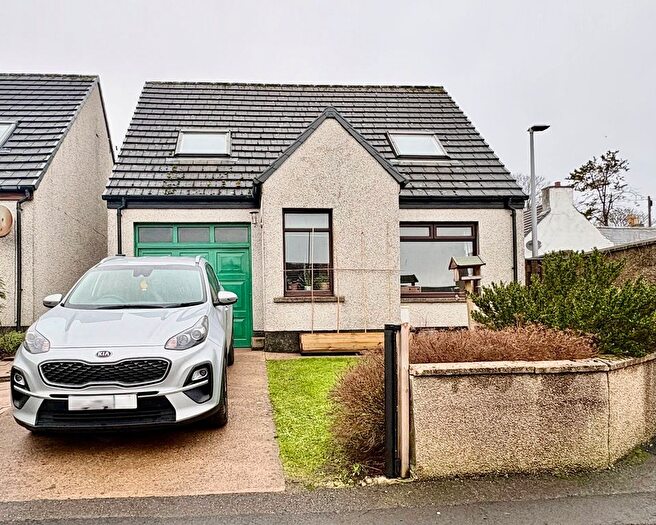
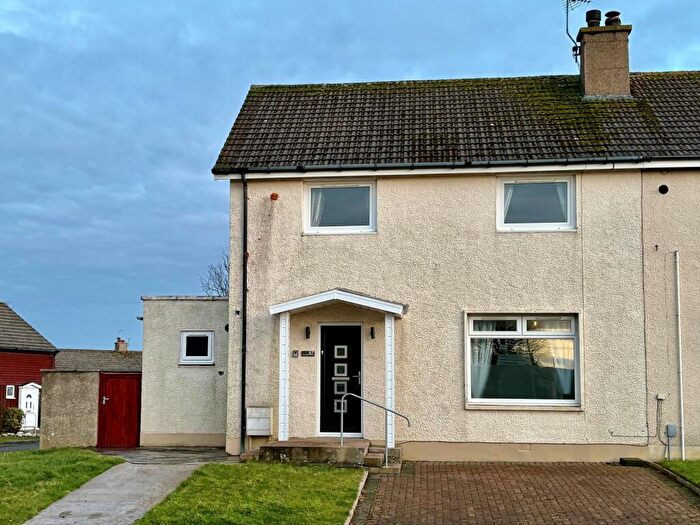
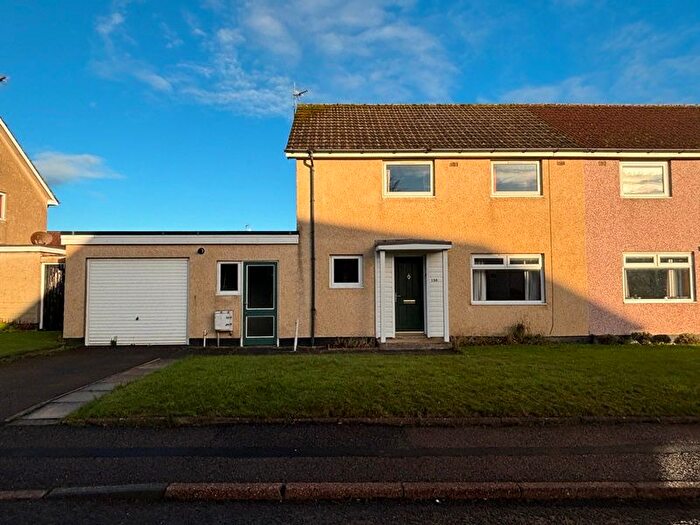
Properties for sale near KW14 7EX, Balimore Place
![]()
If you are looking to sell your house, let it out, or receive a property valuation, an expert can help you.
Click the button below to get started.
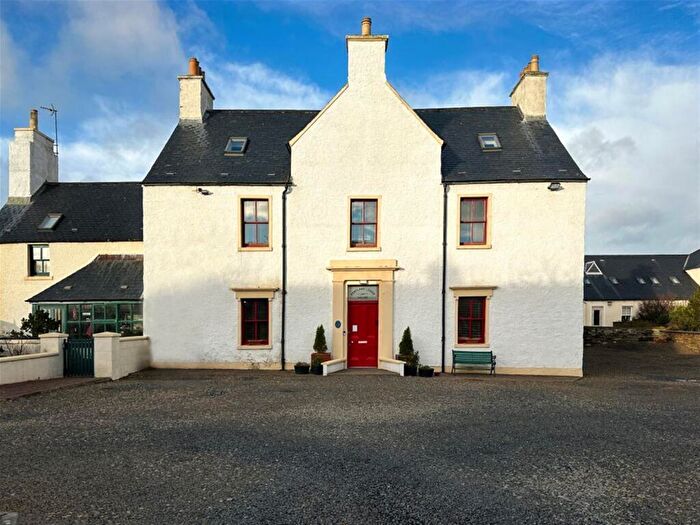
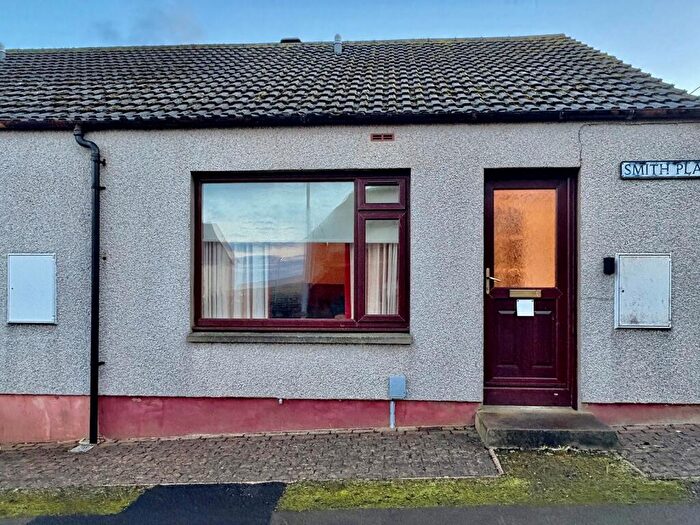
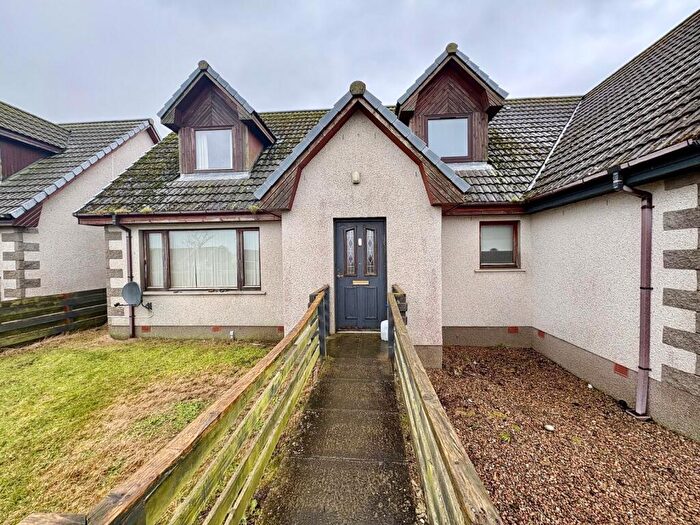
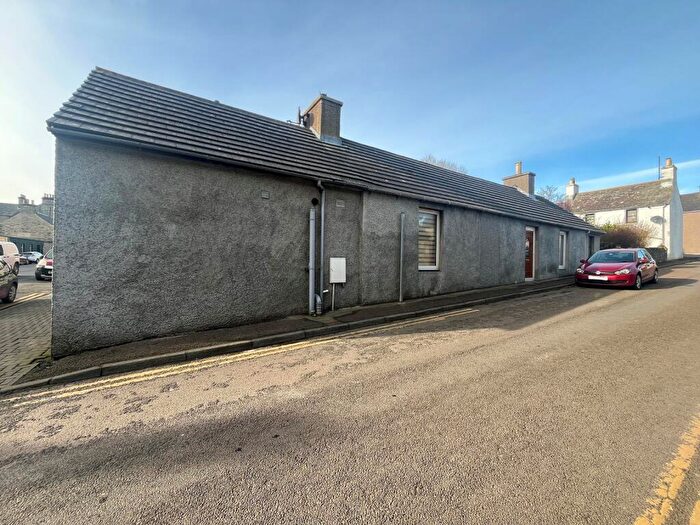
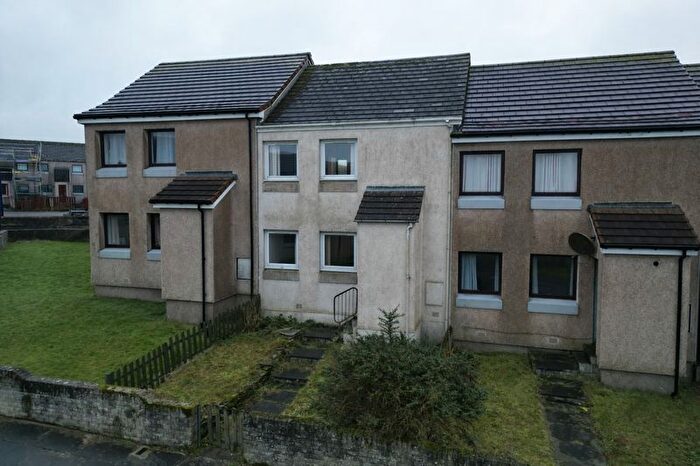
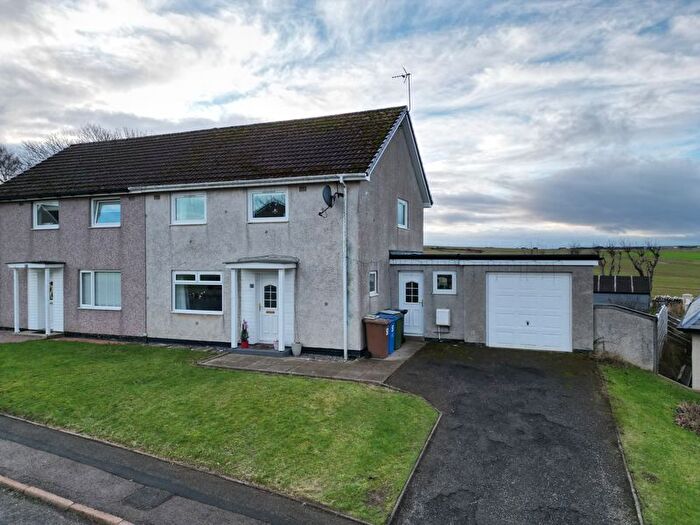
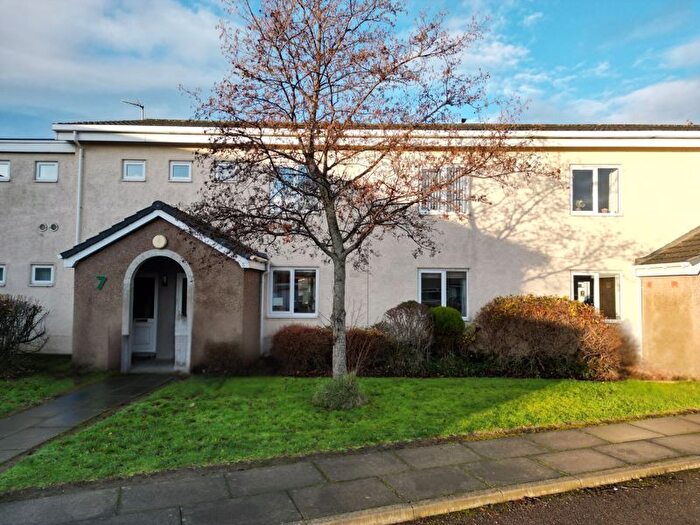
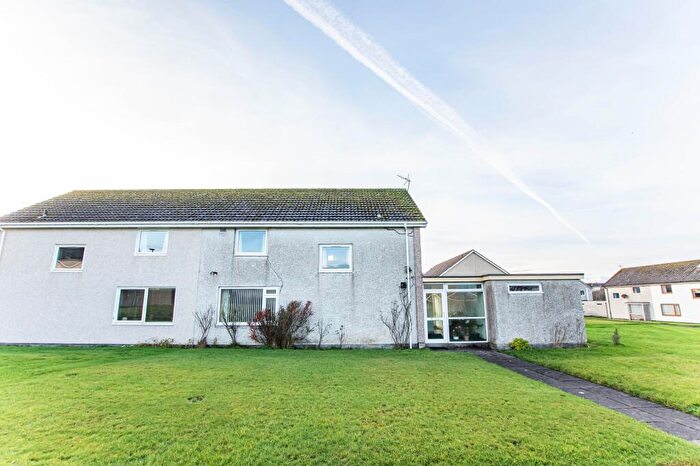
Previously listed properties near KW14 7EX, Balimore Place


![]()
If you are looking to sell your house, let it out, or receive a property valuation, an expert can help you.
Click the button below to get started.


Price Paid in Balimore Place, KW14 7EX, Thurso and Northwest Caithness
3 Balimore Place, KW14 7EX, Thurso and Northwest Caithness Thurso
Property 3 has been sold 2 times. The last time it was sold was in 21/07/2025 and the sold price was £95,000.00.
This is a Property which was sold as a New Build in 21/07/2025
| Date | Price | Classification |
|---|---|---|
| 21/07/2025 | £95,000.00 | New Build |
| 16/06/2003 | £55,000.00 | Established Building |
1 Balimore Place, KW14 7EX, Thurso and Northwest Caithness Thurso
Property 1 has been sold 3 times. The last time it was sold was in 14/08/2023 and the sold price was £82,000.00.
This is a Property which was sold as a New Build in 14/08/2023
| Date | Price | Classification |
|---|---|---|
| 14/08/2023 | £82,000.00 | New Build |
| 09/02/2006 | £300.00 | Established Building |
| 25/03/2005 | £28,000.00 | Established Building |
6 Balimore Place, KW14 7EX, Thurso and Northwest Caithness Thurso
Property 6 has been sold 1 time. The last time it was sold was in 27/01/2020 and the sold price was £80,000.00.
This is a Property which was sold as an Established Building in 27/01/2020
| Date | Price | Classification |
|---|---|---|
| 27/01/2020 | £80,000.00 | Established Building |
Transport near KW14 7EX, Balimore Place

House price paid reports for KW14 7EX, Balimore Place
Click on the buttons below to see price paid reports by year or property price:
- Price Paid By Year
Property Price Paid in KW14 7EX, Balimore Place by Year
The average sold property price by year was:
| Year | Average Sold Price | Price Change |
Sold Properties
|
|---|---|---|---|
| 2025 | £95,000 | 14% |
1 Property |
| 2023 | £82,000 | 2% |
1 Property |
| 2020 | £80,000 | 100% |
1 Property |
| 2006 | £300 | -9233,3% |
1 Property |
| 2005 | £28,000 | -96% |
1 Property |
| 2003 | £55,000 | - |
1 Property |