
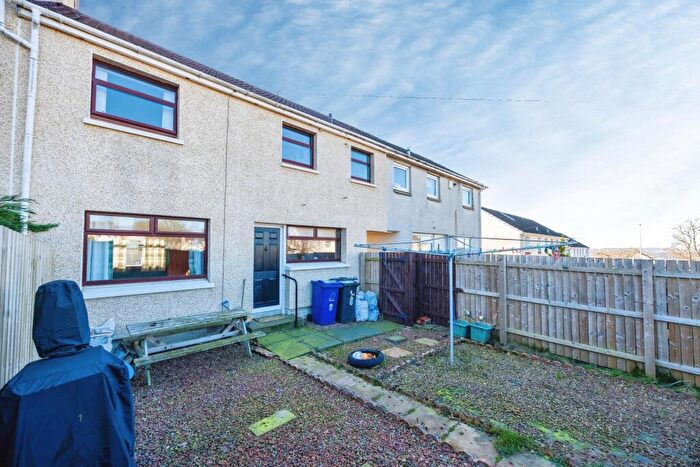
Houses for sale & to rent in EH22 5BE, Myrtle Grove, Midlothian East, Dalkeith
House Prices in EH22 5BE, Myrtle Grove, Midlothian East
Properties in EH22 5BE have an average house price of £148k and had 2 Property Transactions within the last 3 years.¹ EH22 5BE is a postcode in Myrtle Grove located in Midlothian East, an area in Dalkeith, Midlothian, with 7 households², where the most expensive property was sold for £150k.
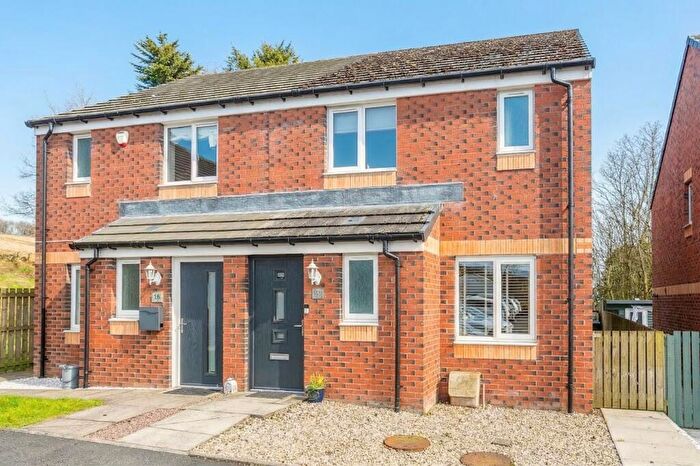
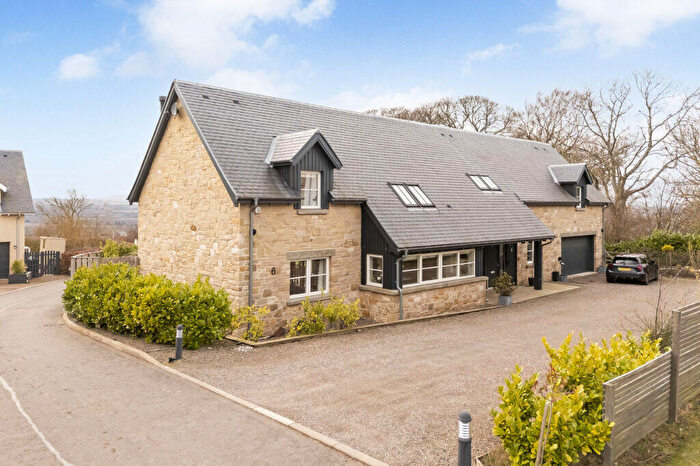
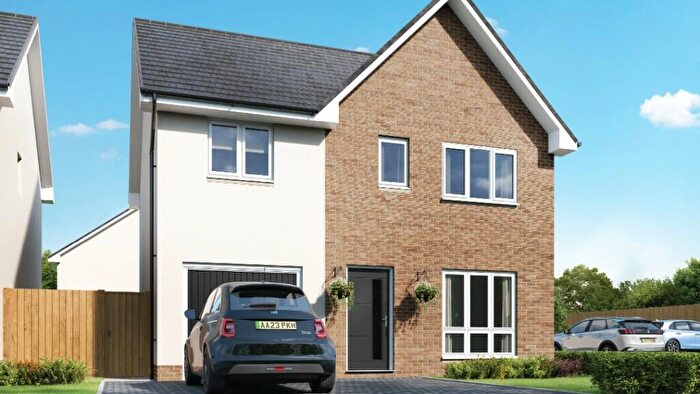
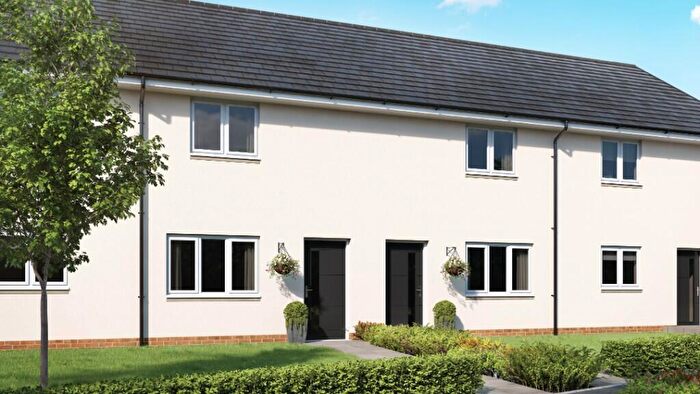
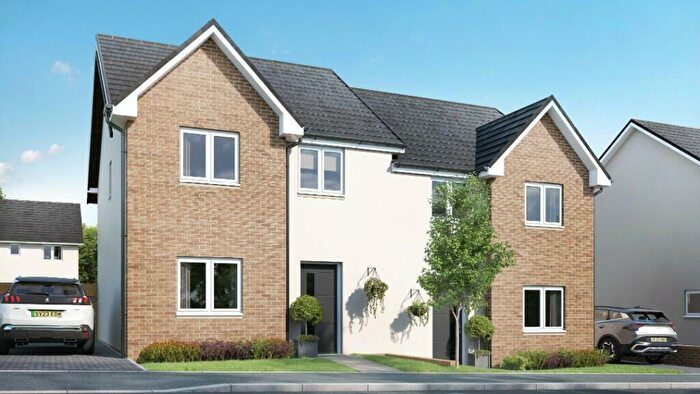
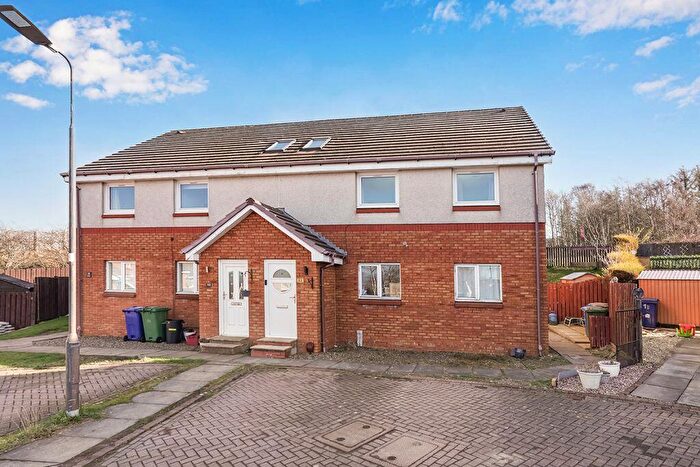
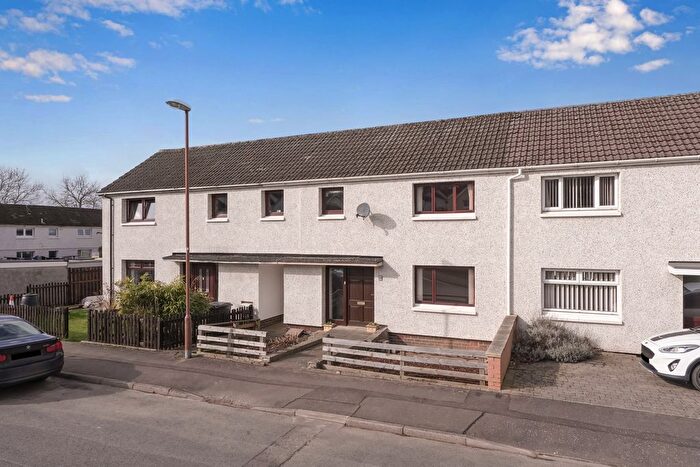
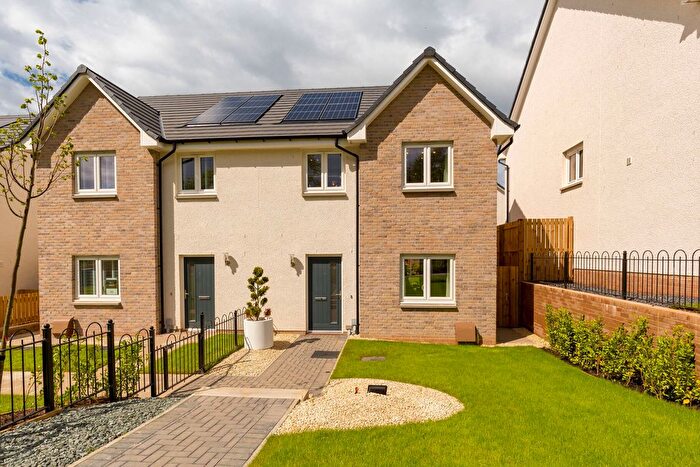
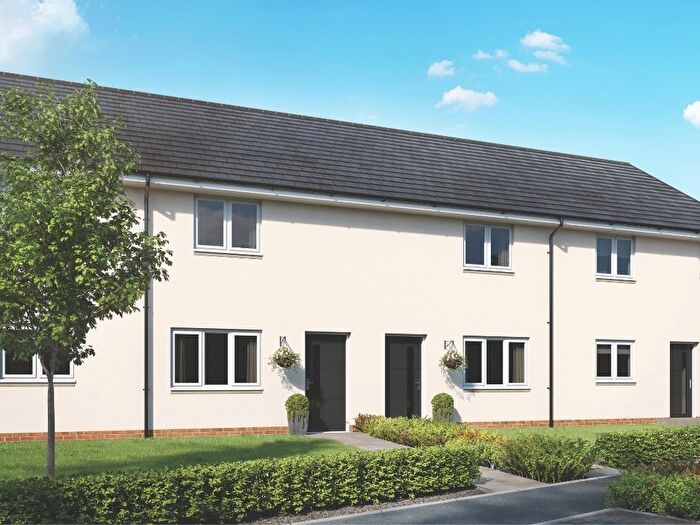
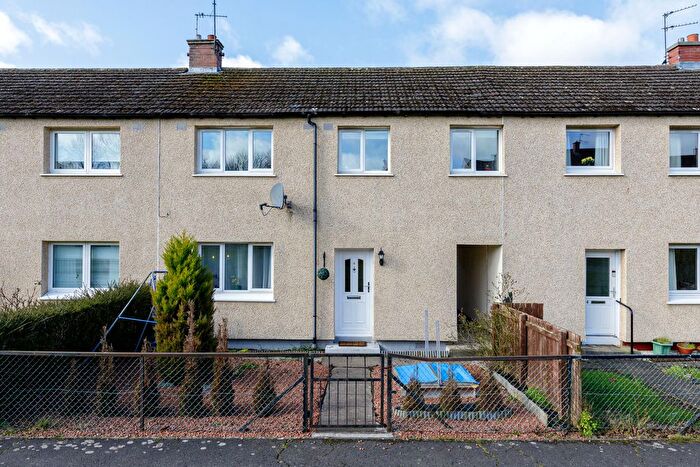
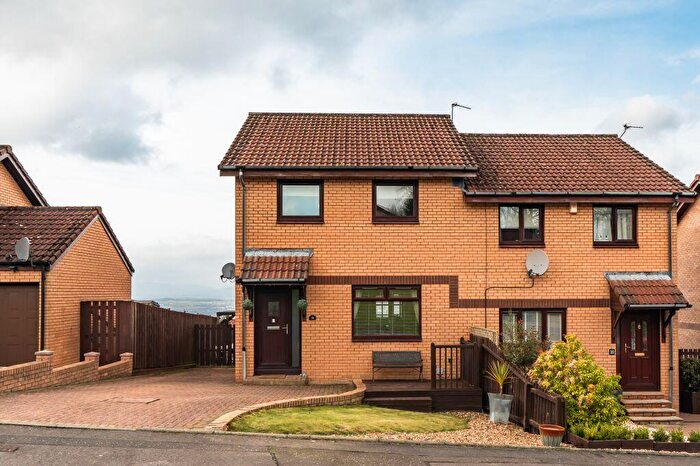
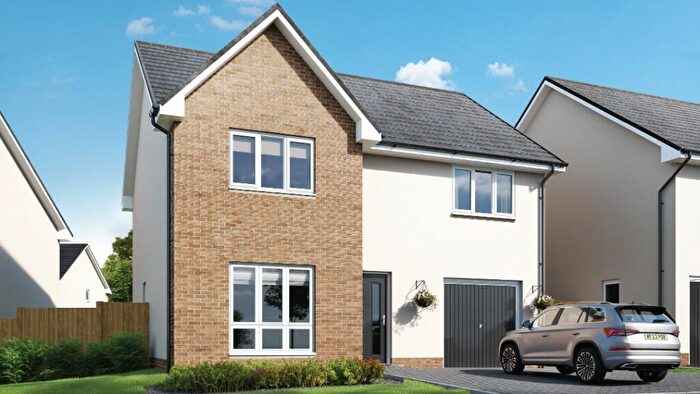
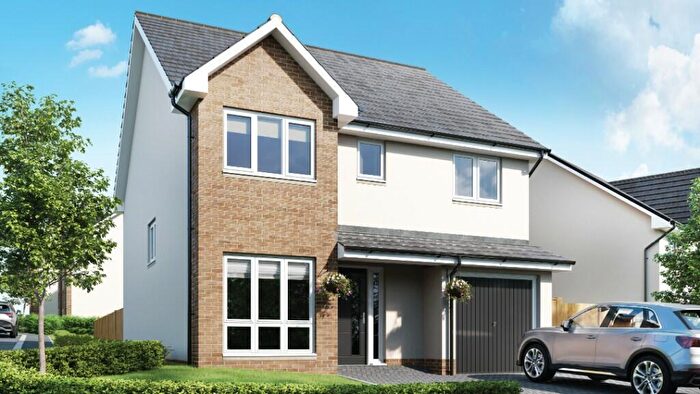
Properties for sale near EH22 5BE, Myrtle Grove


![]()
If you are looking to sell your house, let it out, or receive a property valuation, an expert can help you.
Click the button below to get started.


Price Paid in Myrtle Grove, EH22 5BE, Midlothian East
7 Myrtle Grove, EH22 5BE, Midlothian East Dalkeith
Property 7 has been sold 3 times. The last time it was sold was in 19/05/2025 and the sold price was £150,000.00.
This is a Property which was sold as a New Build in 19/05/2025
| Date | Price | Classification |
|---|---|---|
| 19/05/2025 | £150,000.00 | New Build |
| 30/05/2007 | £99,995.00 | New Build |
| 09/02/2007 | £95,000.00 | Established Building |
2 Myrtle Grove, EH22 5BE, Midlothian East Dalkeith
Property 2 has been sold 3 times. The last time it was sold was in 09/05/2023 and the sold price was £145,000.00.
This is a Property which was sold as a New Build in 09/05/2023
| Date | Price | Classification |
|---|---|---|
| 09/05/2023 | £145,000.00 | New Build |
| 19/03/2014 | £25,000.00 | Established Building |
| 07/10/2005 | £37,720.00 | Established Building |
5 Myrtle Grove, EH22 5BE, Midlothian East Dalkeith
Property 5 has been sold 2 times. The last time it was sold was in 15/04/2010 and the sold price was £94,019.00.
This is a Property which was sold as an Established Building in 15/04/2010
| Date | Price | Classification |
|---|---|---|
| 15/04/2010 | £94,019.00 | Established Building |
| 09/09/2002 | £14,600.00 | Established Building |
Transport near EH22 5BE, Myrtle Grove

House price paid reports for EH22 5BE, Myrtle Grove
Click on the buttons below to see price paid reports by year or property price:
- Price Paid By Year
Property Price Paid in EH22 5BE, Myrtle Grove by Year
The average sold property price by year was:
| Year | Average Sold Price | Price Change |
Sold Properties
|
|---|---|---|---|
| 2025 | £150,000 | 3% |
1 Property |
| 2023 | £145,000 | 83% |
1 Property |
| 2014 | £25,000 | -276% |
1 Property |
| 2010 | £94,019 | -4% |
1 Property |
| 2007 | £97,497 | 61% |
2 Properties |
| 2005 | £37,720 | 61% |
1 Property |
| 2002 | £14,600 | - |
1 Property |