
Houses for sale in Midlothian, Scotland
House Prices in Midlothian
Properties in Midlothian have
an average house price of
£238k
and had 2,523 Property Transactions
within the last 3 years.¹
Midlothian is a location in
Scotland with
34,896 households², where the most expensive property was sold for £1.88M.
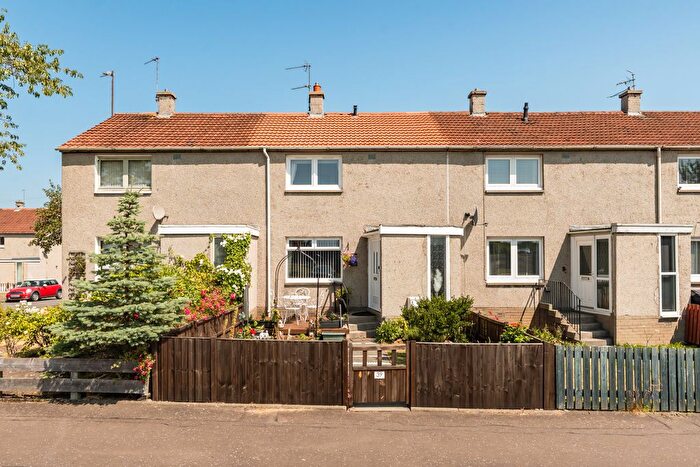
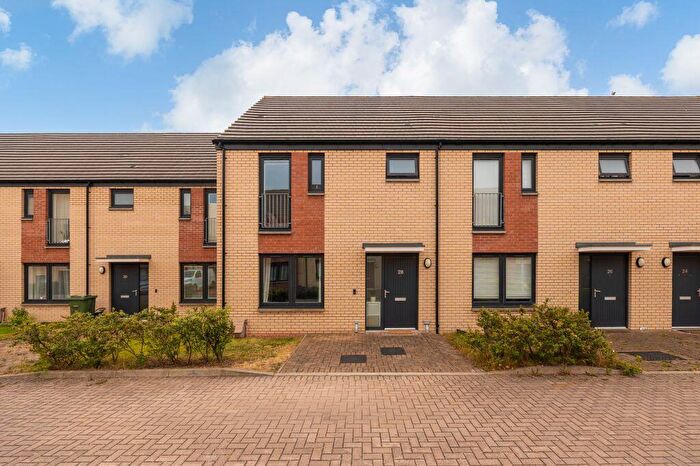
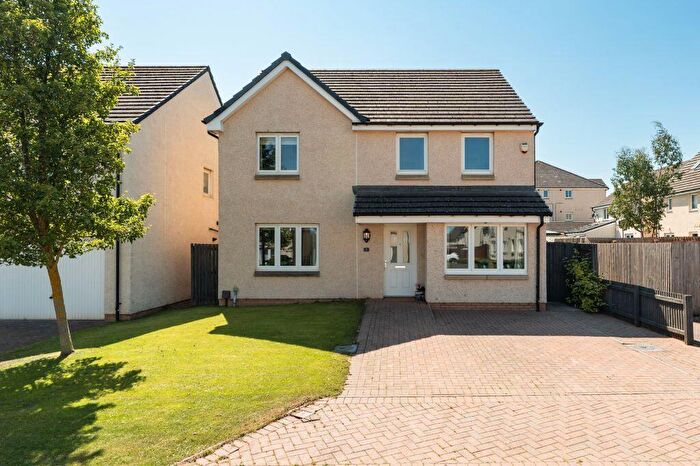
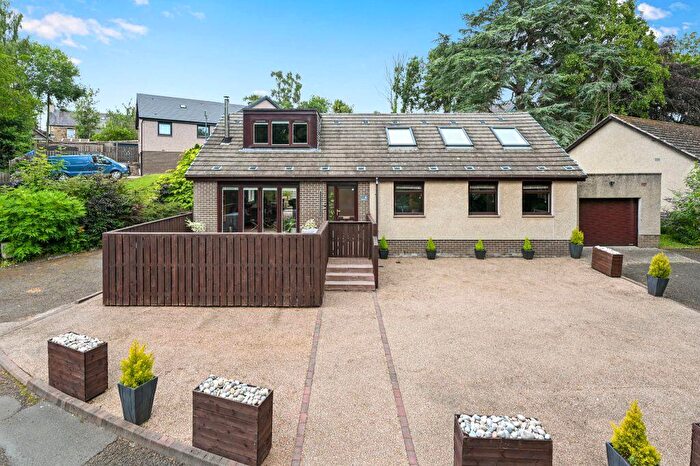
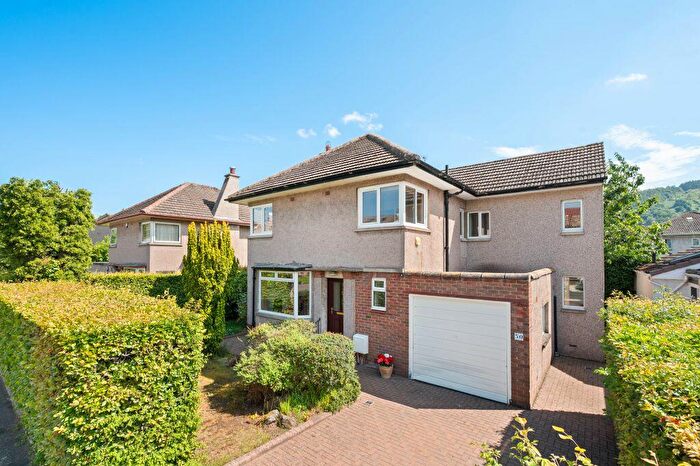
Properties for sale in Midlothian
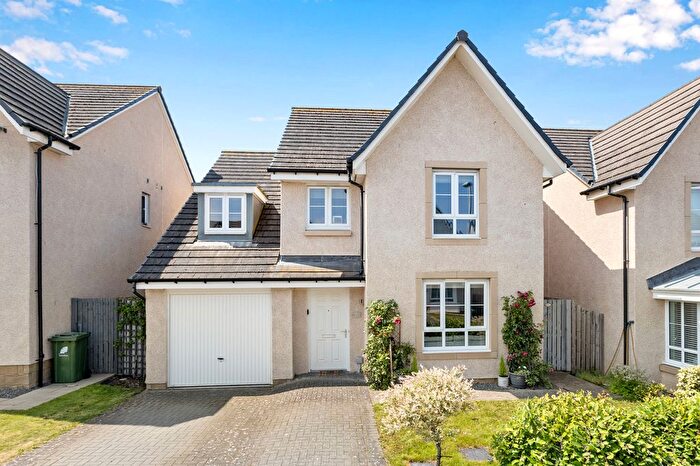

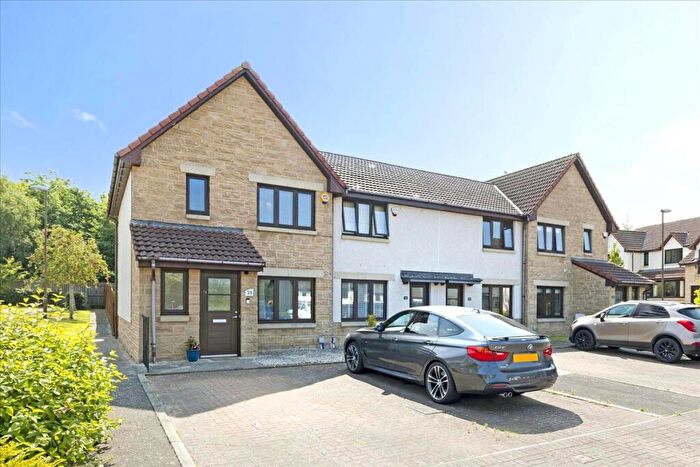
![]()
If you are looking to sell your house, let it out, or receive a property valuation, an expert can help you.
Click the button below to get started.


Towns in Midlothian
Navigate through our locations to find the location of your next house in Midlothian, Scotland for sale or to rent.
Property price trends in Midlothian
According to the latest Registers of Scotland data, the average home in Midlothian sold for £224,178 in 2026. That figure comes from a substantial record of 36,319 sales logged over the past 26 years.
Prices have fallen back over the last three years. Compared with 2023, when the typical sale came in around £242,263, that's a fall of roughly 7.5%.
Looking back five years, average prices are down about 9.3% since 2021, a drop of around £23,004 in cash terms.
Zoom out to the past decade for the fuller picture. Back in 2016, homes here averaged £192,704, so the typical sold price has climbed about 16.3% since then, roughly 1.5% a year. Stretch the view to fifteen years and that annual pace edges up closer to 2.2%.
Frequently asked questions about Midlothian
What is the average price for a property for sale in Midlothian?
The average price for a property for sale in Midlothian is £238,235. This amount is 18% higher than the average price in Scotland. There are more than 10,000 property listings for sale in Midlothian.
What locations have the most expensive properties for sale in Midlothian?
The locations with the most expensive properties for sale in Midlothian are Edinburgh at an average of £586,333, Lasswade at an average of £411,740 and Roslin at an average of £313,294.
What locations have the most affordable properties for sale in Midlothian?
The locations with the most affordable properties for sale in Midlothian are Gorebridge at an average of £211,503, Penicuik at an average of £216,502 and Bonnyrigg at an average of £235,351.
Which train stations are available in or near Midlothian?
Some of the train stations available in or near Midlothian are Eskbank, Newtongrange and Gorebridge.
Property Price Paid in Midlothian by Year
The average sold property price by year was:
| Year | Average Sold Price | Price Change |
Sold Properties
|
|---|---|---|---|
| 2026 | £224,178 | -3% |
147 Properties |
| 2025 | £231,676 | -5% |
795 Properties |
| 2024 | £243,407 | 0,5% |
797 Properties |
| 2023 | £242,263 | -7% |
784 Properties |
| 2022 | £260,373 | 5% |
1,576 Properties |
| 2021 | £247,182 | 4% |
2,001 Properties |
| 2020 | £236,238 | 4% |
1,605 Properties |
| 2019 | £225,737 | 4% |
1,873 Properties |
| 2018 | £215,824 | 7% |
1,796 Properties |
| 2017 | £200,325 | 4% |
1,896 Properties |
Transport in Midlothian
Please see below transportation links in this area:
