
Houses for sale & to rent in Gorebridge, Midlothian
House Prices in Gorebridge
Properties in Gorebridge have an average house price of £212k and had 240 Property Transactions within the last 3 years.¹
Gorebridge is an area in Midlothian with 3,274 households², where the most expensive property was sold for £575k.
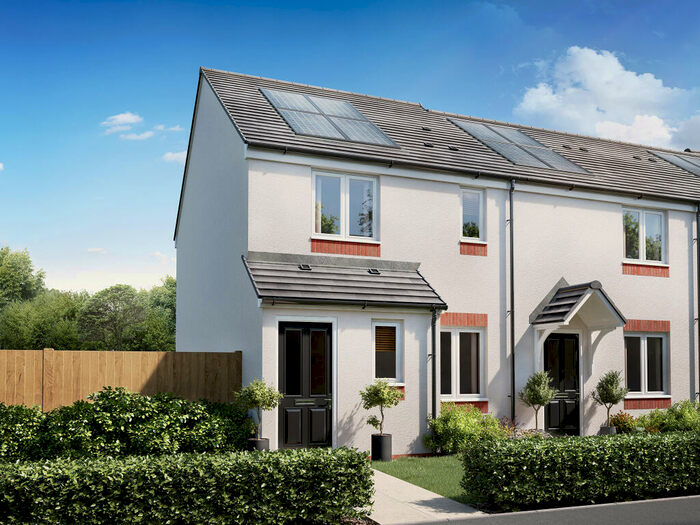
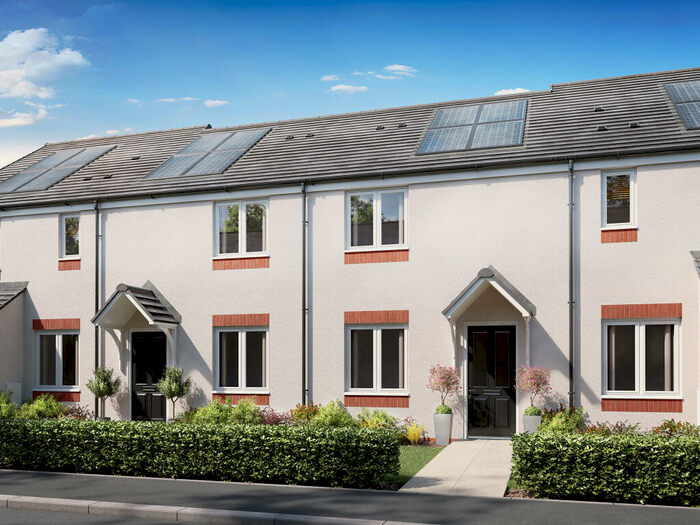
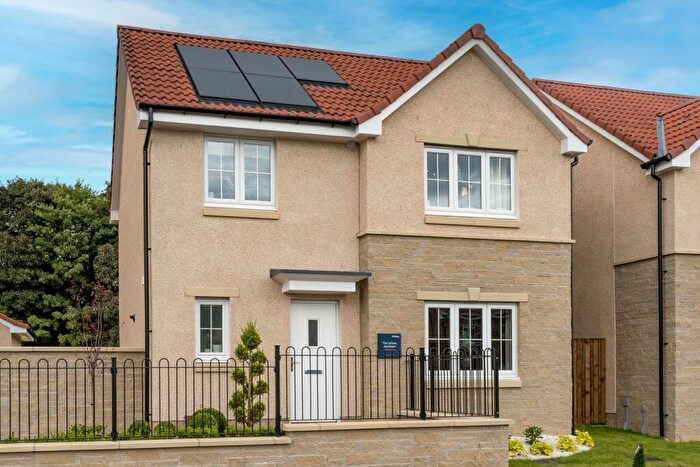
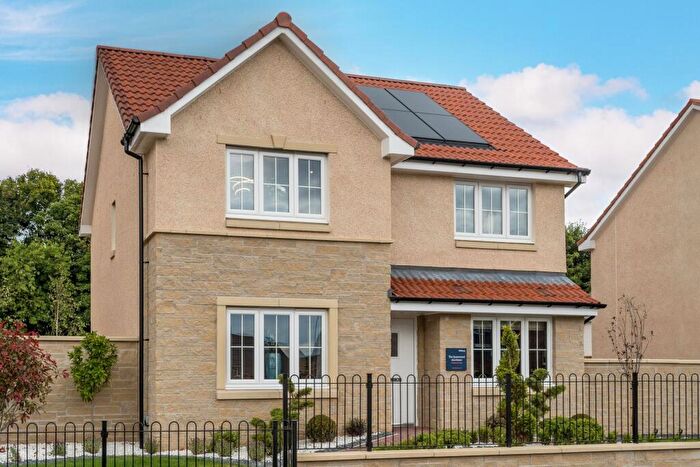
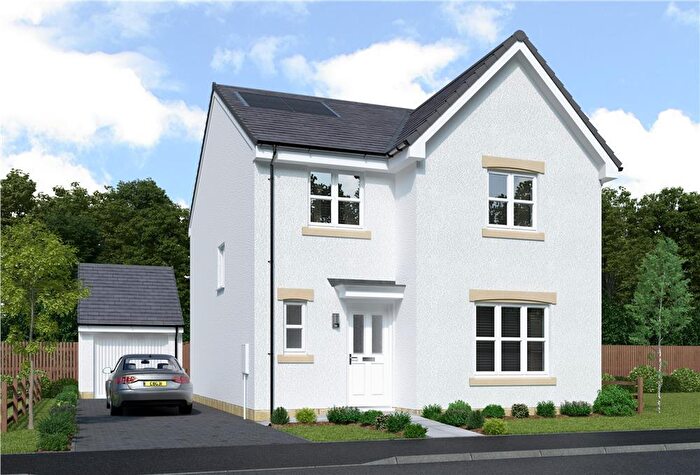
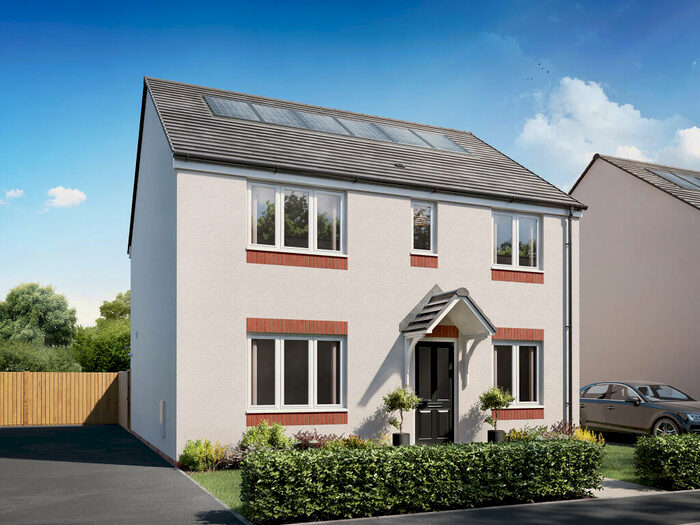
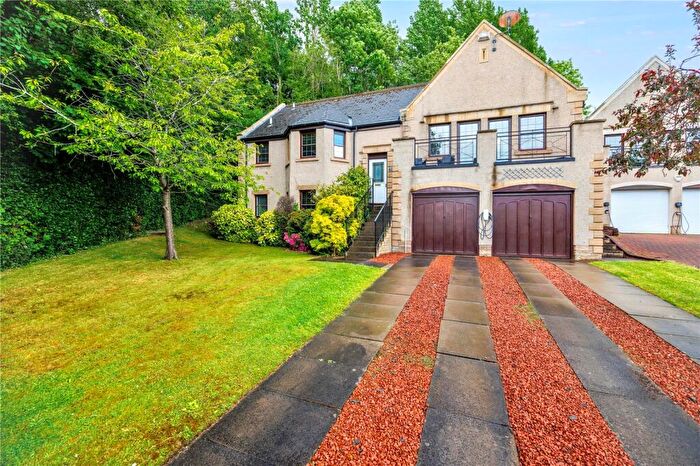
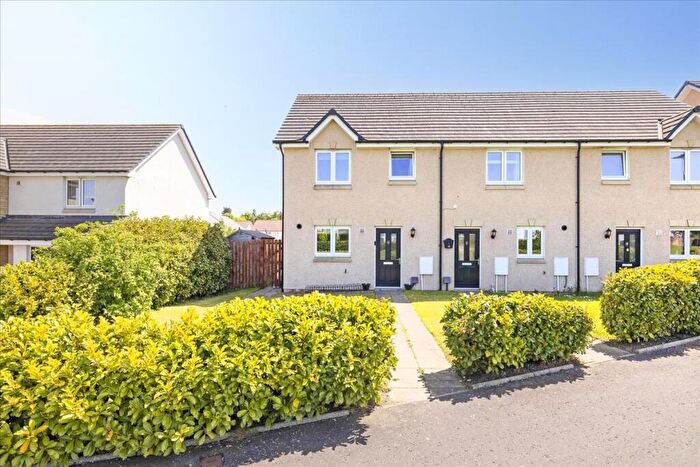
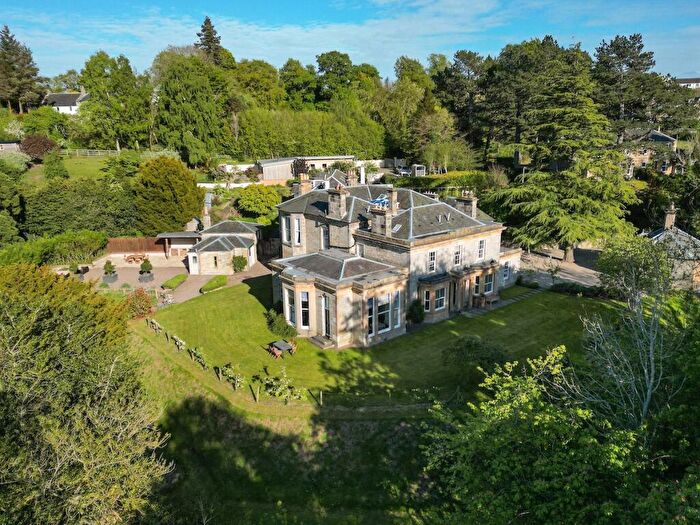
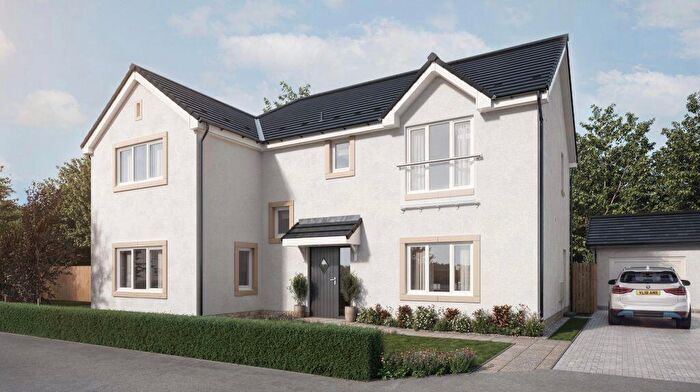
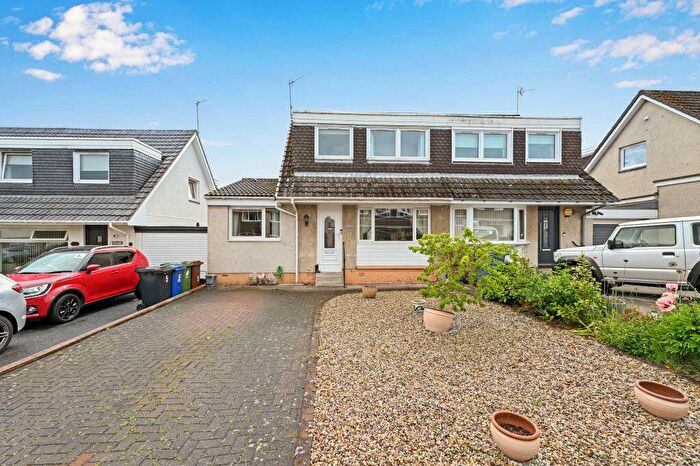
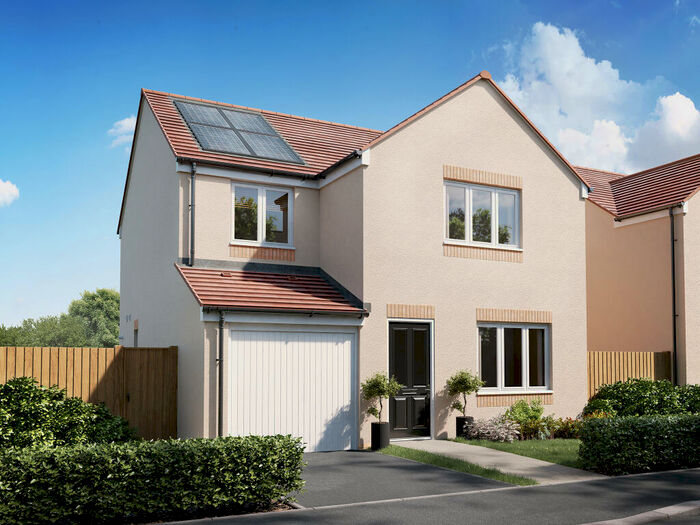
Properties for sale in Gorebridge
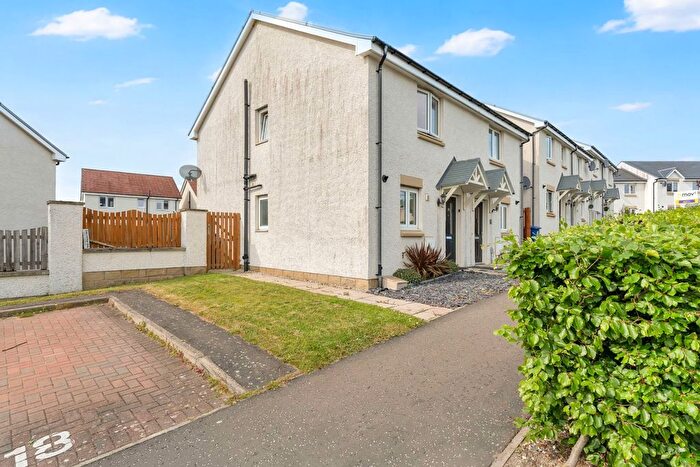
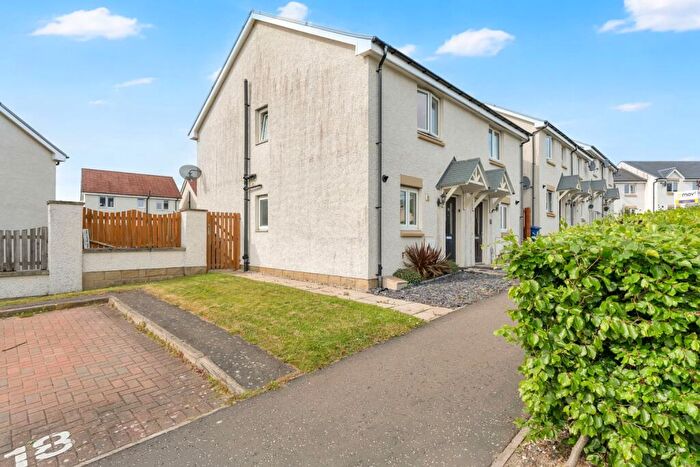
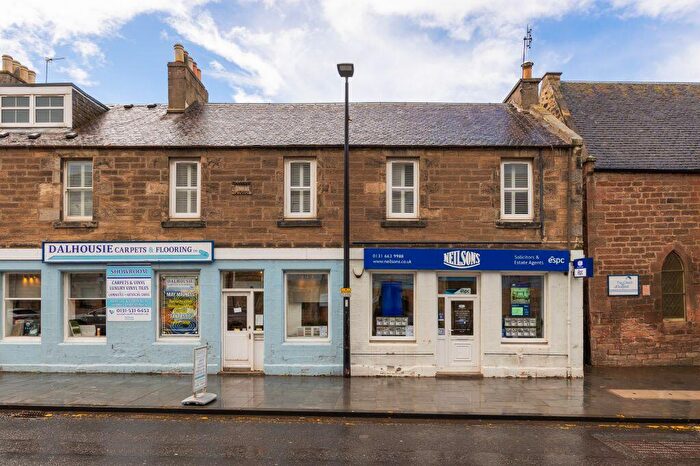
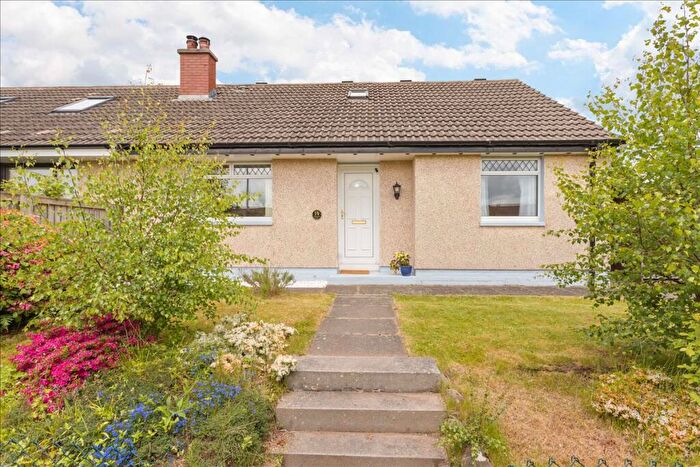
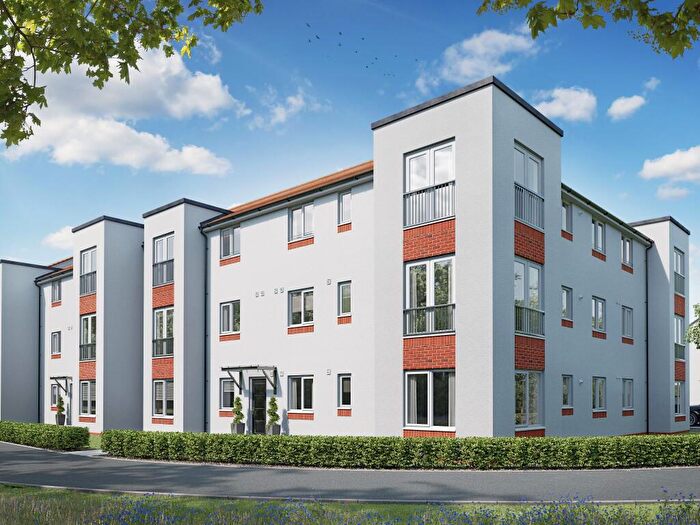
![]()
If you are looking to sell your house, let it out, or receive a property valuation, an expert can help you.
Click the button below to get started.

Neighbourhoods in Gorebridge
Navigate through our locations to find the location of your next house in Gorebridge, Midlothian for sale or to rent.
Transport in Gorebridge
Please see below transportation links in this area:

- FAQ
- Price Paid By Year
Frequently asked questions about Gorebridge
What is the average price for a property for sale in Gorebridge?
The average price for a property for sale in Gorebridge is £211,503. This amount is 11% lower than the average price in Midlothian. There are 5,695 property listings for sale in Gorebridge.
What locations have the most expensive properties for sale in Gorebridge?
The location with the most expensive properties for sale in Gorebridge is Midlothian East at an average of £390,833.
What locations have the most affordable properties for sale in Gorebridge?
The location with the most affordable properties for sale in Gorebridge is Midlothian South at an average of £206,904.
Which train stations are available in or near Gorebridge?
Some of the train stations available in or near Gorebridge are Gorebridge, Newtongrange and Eskbank.
Property Price Paid in Gorebridge by Year
The average sold property price by year was:
| Year | Average Sold Price | Price Change |
Sold Properties
|
|---|---|---|---|
| 2025 | £202,509 | -4% |
84 Properties |
| 2024 | £209,954 | -7% |
86 Properties |
| 2023 | £224,197 | -12% |
70 Properties |
| 2022 | £250,941 | 11% |
201 Properties |
| 2021 | £222,354 | 4% |
251 Properties |
| 2020 | £213,917 | - |
248 Properties |
| 2019 | £213,995 | 12% |
248 Properties |
| 2018 | £188,161 | 11% |
249 Properties |
| 2017 | £168,169 | 2% |
213 Properties |
| 2016 | £164,385 | -8% |
248 Properties |
| 2015 | £177,328 | 2% |
192 Properties |
| 2014 | £173,825 | - |
240 Properties |
| 2013 | £173,779 | 10% |
202 Properties |
| 2012 | £156,832 | 7% |
100 Properties |
| 2011 | £146,450 | 8% |
100 Properties |
| 2010 | £134,454 | 0,3% |
84 Properties |
| 2009 | £134,096 | 3% |
109 Properties |
| 2008 | £129,908 | -11% |
133 Properties |
| 2007 | £144,151 | 20% |
184 Properties |
| 2006 | £114,689 | 4% |
180 Properties |
| 2005 | £109,533 | 17% |
157 Properties |
| 2004 | £90,745 | -14% |
190 Properties |
| 2003 | £103,461 | 24% |
192 Properties |
| 2002 | £79,090 | 29% |
166 Properties |
| 2001 | £56,534 | -58% |
20 Properties |
| 2000 | £89,100 | - |
7 Properties |