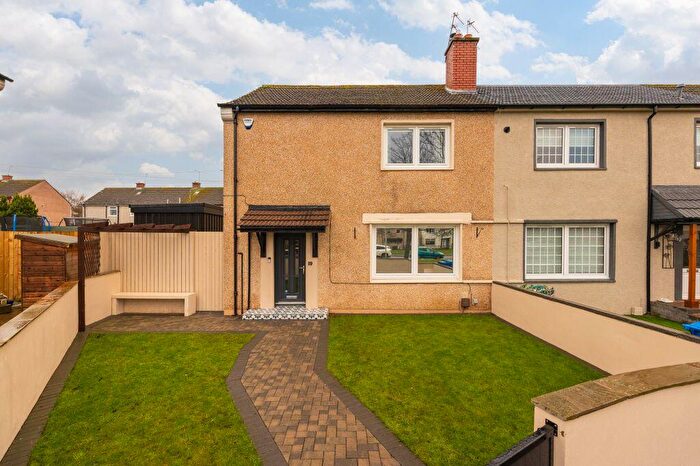
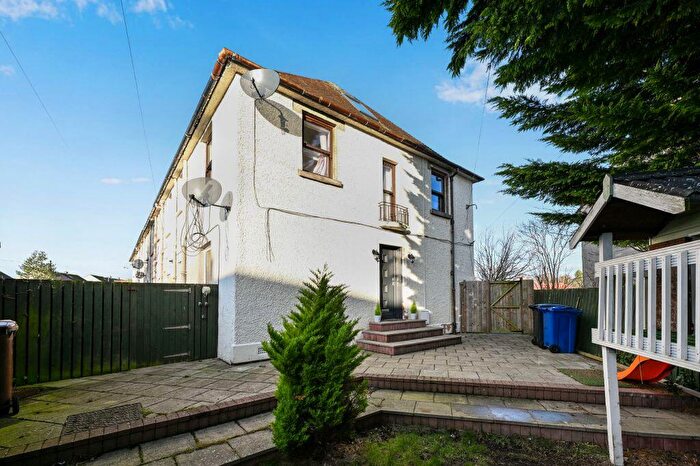
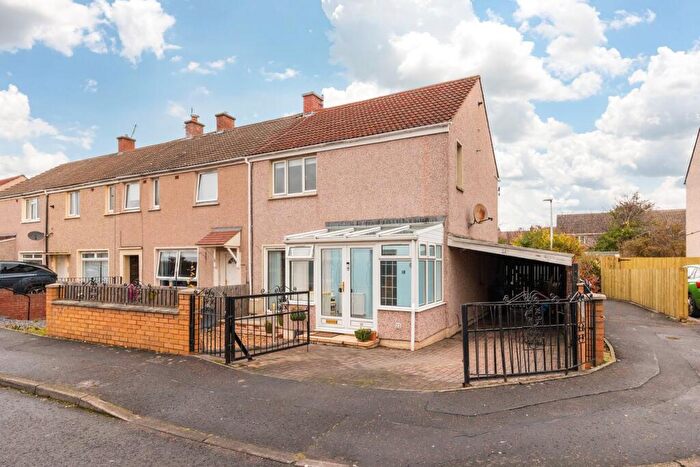
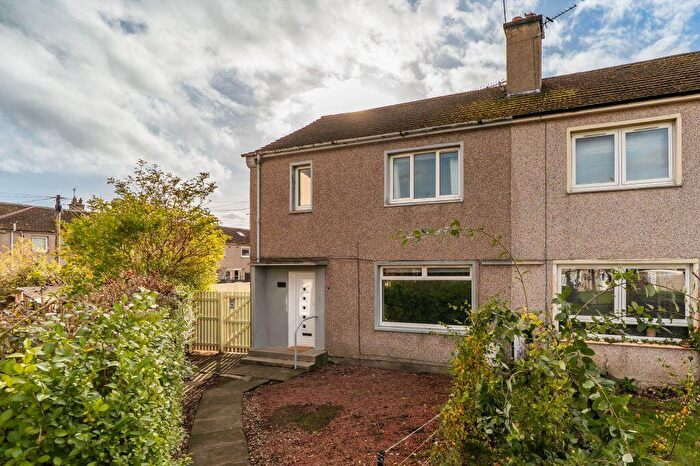
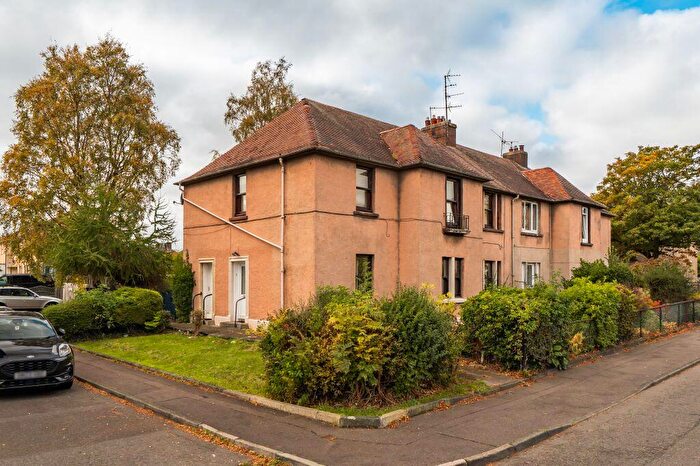
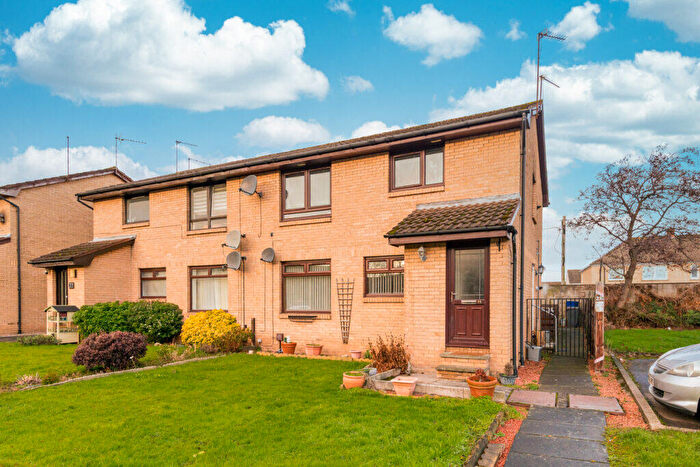
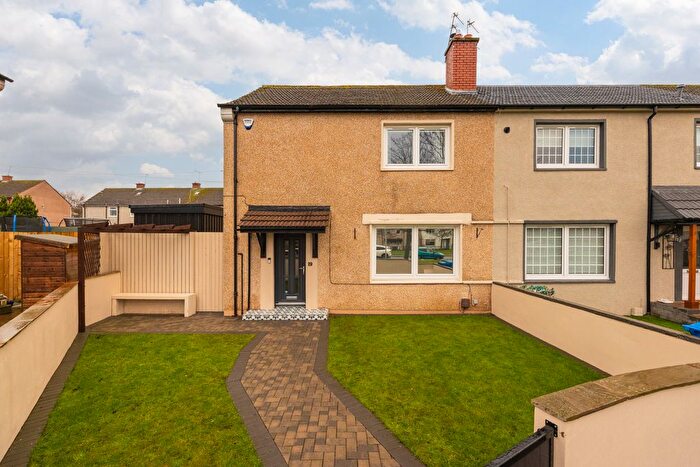
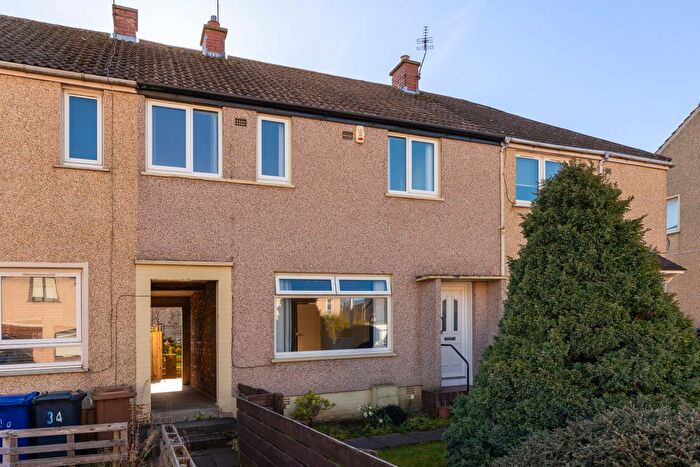
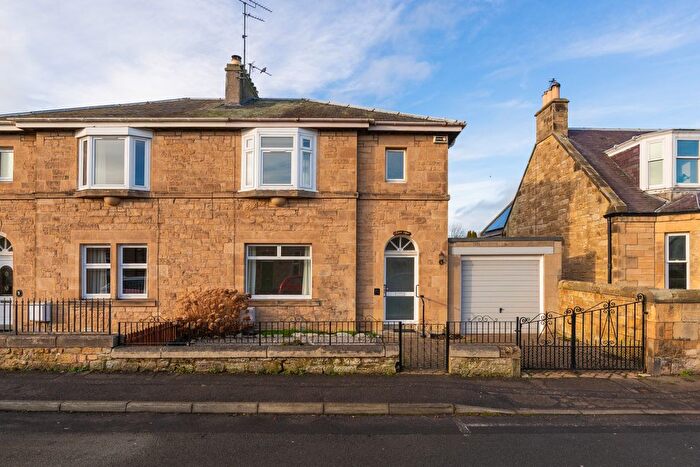
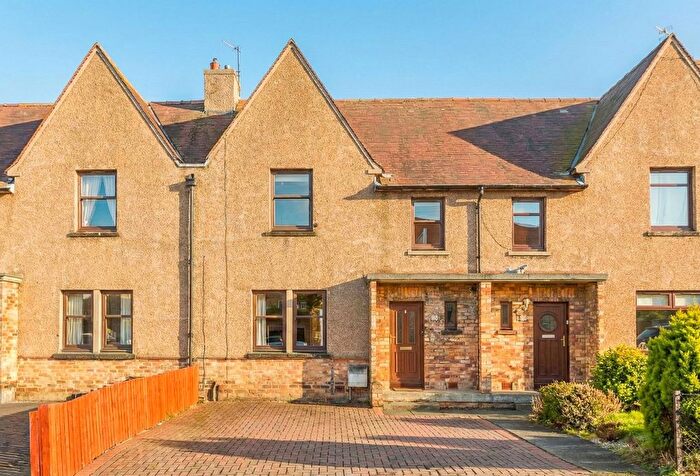
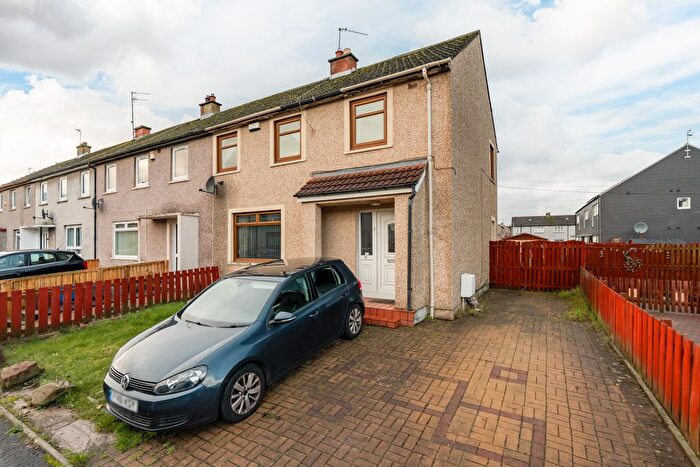
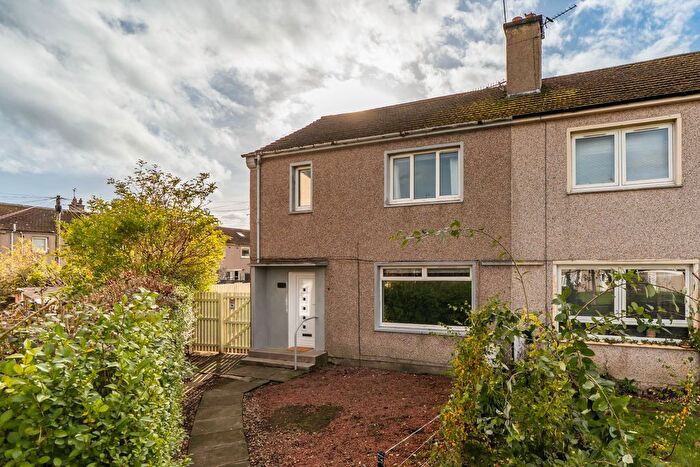
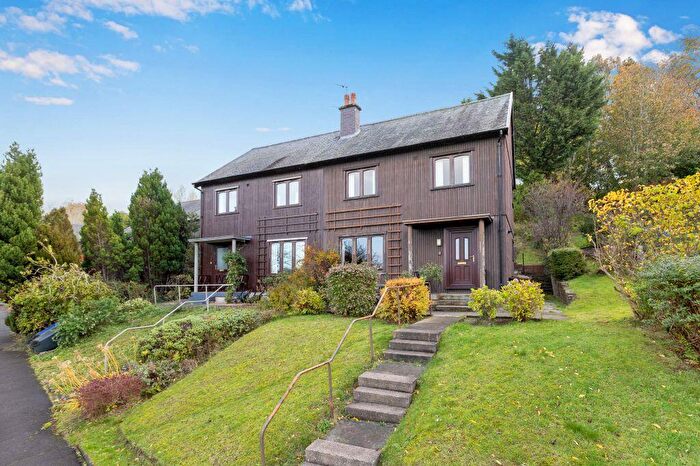
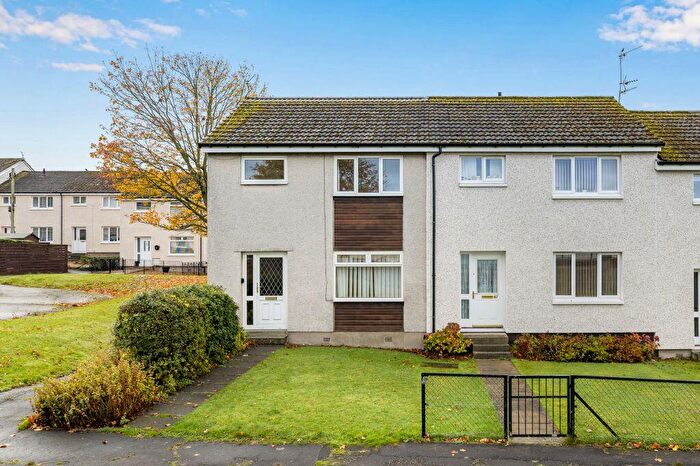
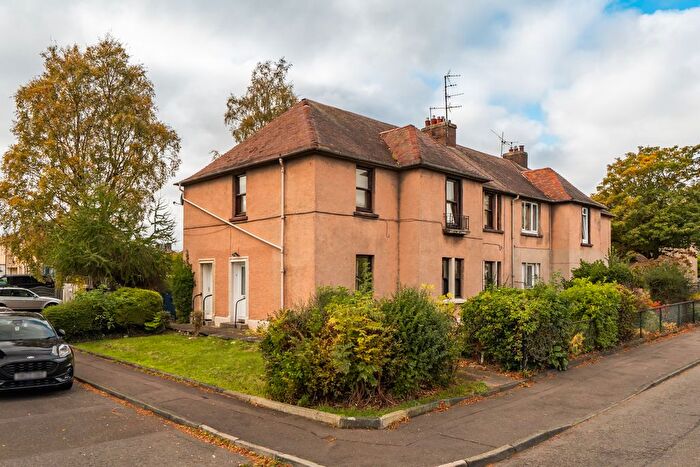
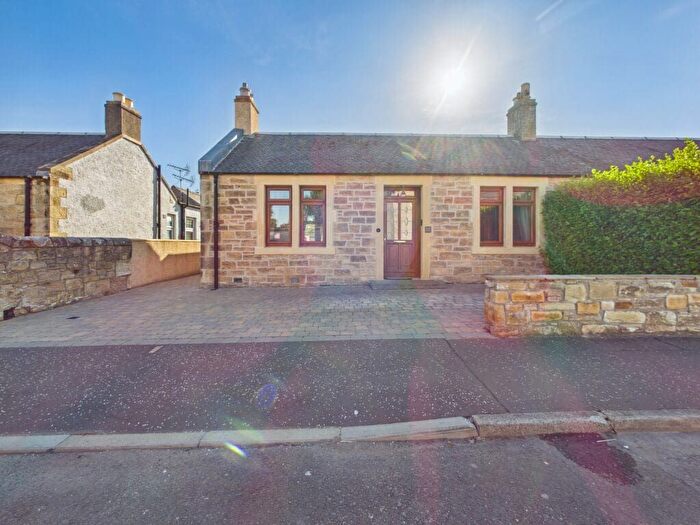
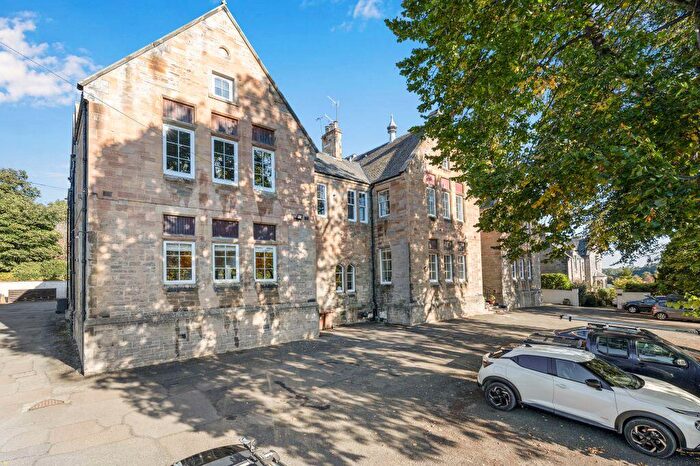
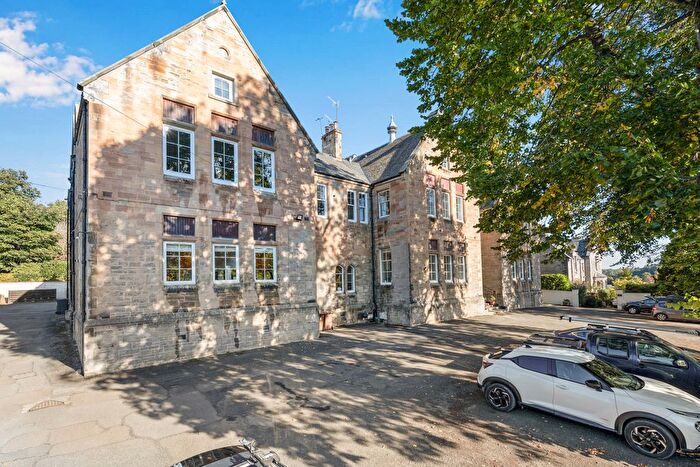
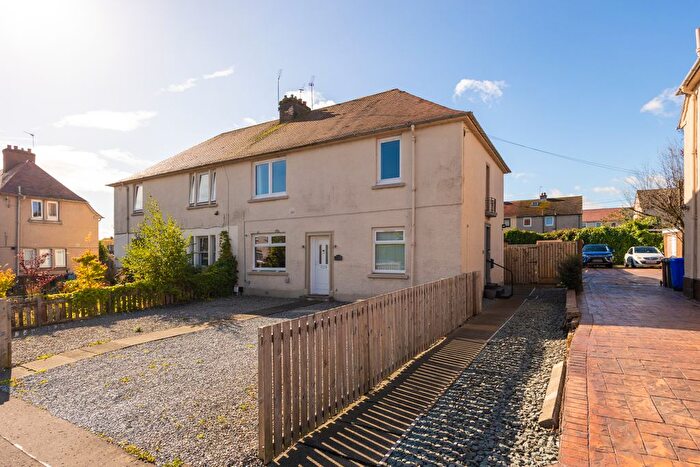
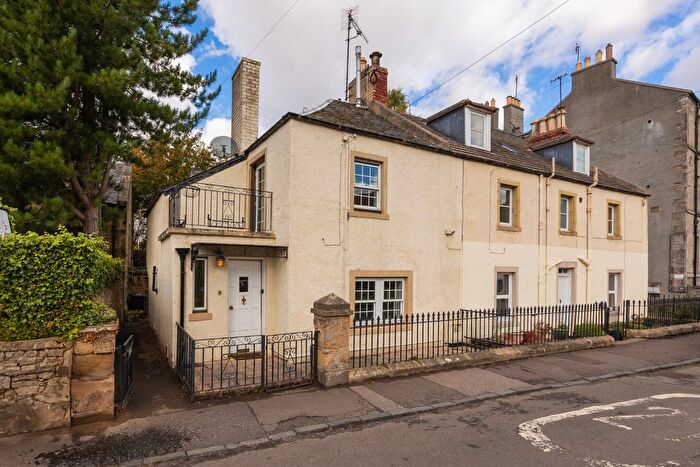
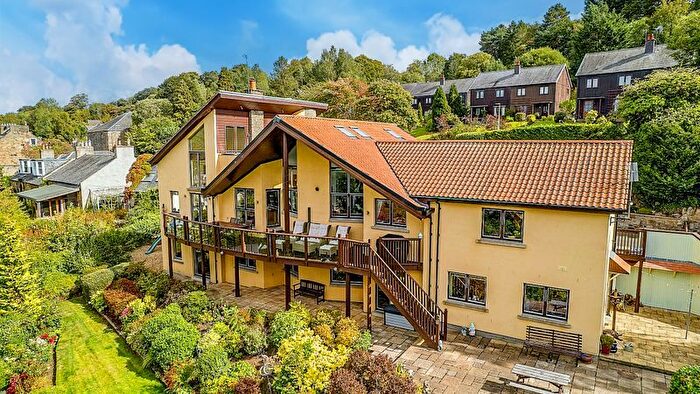
Houses for sale & to rent in Bonnyrigg, Lasswade
House Prices in Bonnyrigg
Properties in Bonnyrigg have an average house price of £365,465.00 and had 32 Property Transactions within the last 3 years¹.
Bonnyrigg is an area in Lasswade, Midlothian with 806 households², where the most expensive property was sold for £1,200,000.00.
Properties for sale in Bonnyrigg
Previously listed properties in Bonnyrigg
Roads and Postcodes in Bonnyrigg
Navigate through our locations to find the location of your next house in Bonnyrigg, Lasswade for sale or to rent.
| Streets | Postcodes |
|---|---|
| Church Road | EH18 1HB |
| Cuguen Place | EH18 1AD |
| De Quincey Path | EH18 1DN |
| De Quincey Road | EH18 1DF EH18 1DG EH18 1DH EH18 1DP EH18 1DW |
| Dobbie's Road | EH18 1BJ |
| Elm Row | EH18 1AG EH18 1AQ EH18 1NE |
| Farm Avenue | EH18 1BU EH18 1BX |
| Glebe Place | EH18 1HH EH18 1HJ |
| Green Lane | EH18 1HE |
| Grove End | EH18 1LJ |
| High Street | EH18 1NA EH18 1ND |
| Kevock Road | EH18 1HT EH18 1HX |
| Kevock Vale Park | EH18 1LY |
| Maclean Place | EH18 1DJ |
| Mason Place | EH18 1BY |
| Mavisbank Place | EH18 1DQ |
| Melville View | EH18 1AE |
| Methven Terrace | EH18 1DE |
| Polton Bank | EH18 1DA EH18 1DB EH18 1DD EH18 1JH EH18 1JJ EH18 1JN EH18 1JP EH18 1JR EH18 1JU EH18 1JW EH18 1JX |
| Polton Bank Terrace | EH18 1JL |
| Polton Drive | EH18 1BP EH18 1BT |
| Polton Gardens | EH18 1BL |
| Polton Road | EH18 1AA EH18 1AB EH18 1AF EH18 1BH EH18 1BS EH18 1LS EH18 1LT EH18 1LU |
| Polton Road West | EH18 1BZ EH18 1DU EH18 1DZ EH18 1EL |
| Polton Terrace | EH18 1BN |
| Poltonhall Industrial Estate | EH18 1BW |
| Ramsay Terrace | EH18 1DL |
| School Green | EH18 1NB |
| School Green Close | EH18 1NF |
| St Annes Avenue | EH18 1DT |
| St Annes Path | EH18 1DR |
| Stevenson Place | EH18 1JZ |
| The Nursery | EH18 1BB |
| Viewbank View | EH18 1AL |
| Wadingburn Lane | EH18 1HG |
| Wadingburn Road | EH18 1HP EH18 1HR EH18 1HS |
| Walker Place | EH18 1DS |
| West Mill Court | EH18 1LH |
| West Mill Pend | EH18 1LQ |
| West Mill Road | EH18 1LX |
| West Mill Wynd | EH18 1LZ |
| EH18 1AJ EH18 1AY EH18 1BF EH18 1DX EH18 1DY EH18 1HA EH18 1HD EH18 1JT EH18 1LN EH18 1LP EH18 1LR EH18 1LW |
Transport near Bonnyrigg
-
Eskbank Station
-
Newtongrange Station
-
Shawfair Station
-
Gorebridge Station
-
Newcraighall Station
-
Musselburgh Station
-
Brunstane Station
- FAQ
- Price Paid By Year
Frequently asked questions about Bonnyrigg
What is the average price for a property for sale in Bonnyrigg?
The average price for a property for sale in Bonnyrigg is £365,465. This amount is 10% lower than the average price in Lasswade. There are 277 property listings for sale in Bonnyrigg.
What streets have the most expensive properties for sale in Bonnyrigg?
The streets with the most expensive properties for sale in Bonnyrigg are Wadingburn Road at an average of £1,200,000, Grove End at an average of £707,500 and Kevock Road at an average of £519,500.
What streets have the most affordable properties for sale in Bonnyrigg?
The streets with the most affordable properties for sale in Bonnyrigg are Polton Gardens at an average of £166,919, Polton Road West at an average of £205,612 and Walker Place at an average of £210,000.
Which train stations are available in or near Bonnyrigg?
Some of the train stations available in or near Bonnyrigg are Eskbank, Newtongrange and Shawfair.
Property Price Paid in Bonnyrigg by Year
The average sold property price by year was:
| Year | Average Sold Price | Price Change |
Sold Properties
|
|---|---|---|---|
| 2025 | £422,000 | 12% |
10 Properties |
| 2024 | £372,136 | 15% |
9 Properties |
| 2023 | £317,359 | -8% |
13 Properties |
| 2022 | £343,821 | -14% |
36 Properties |
| 2021 | £393,497 | 19% |
39 Properties |
| 2020 | £316,796 | 20% |
22 Properties |
| 2019 | £252,737 | -64% |
32 Properties |
| 2018 | £415,627 | 21% |
48 Properties |
| 2017 | £326,381 | 22% |
43 Properties |
| 2016 | £253,548 | -4% |
67 Properties |
| 2015 | £264,329 | 21% |
29 Properties |
| 2014 | £209,470 | -34% |
23 Properties |
| 2013 | £281,420 | 16% |
32 Properties |
| 2012 | £236,170 | -12% |
16 Properties |
| 2011 | £263,441 | 29% |
17 Properties |
| 2010 | £186,952 | -68% |
18 Properties |
| 2009 | £314,194 | 21% |
25 Properties |
| 2008 | £248,488 | -10% |
32 Properties |
| 2007 | £272,717 | -115% |
46 Properties |
| 2006 | £587,332 | 40% |
37 Properties |
| 2005 | £350,563 | 43% |
35 Properties |
| 2004 | £199,707 | 17% |
32 Properties |
| 2003 | £166,029 | 20% |
41 Properties |
| 2002 | £133,117 | 16% |
39 Properties |
| 2001 | £111,420 | 63% |
13 Properties |
| 2000 | £40,760 | - |
2 Properties |

