
Houses for sale & to rent in Loanhead, Midlothian
House Prices in Loanhead
Properties in Loanhead have an average house price of £247k and had 192 Property Transactions within the last 3 years.¹
Loanhead is an area in Midlothian with 2,814 households², where the most expensive property was sold for £720k.
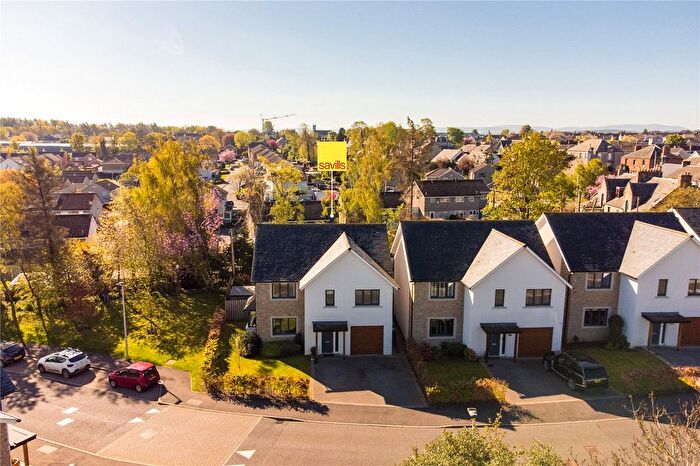
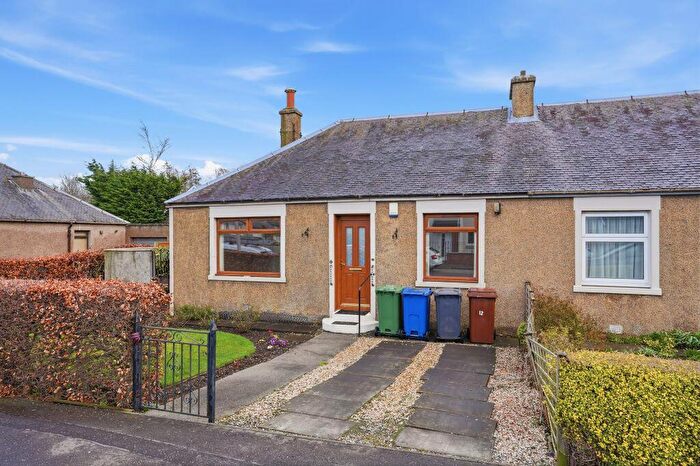
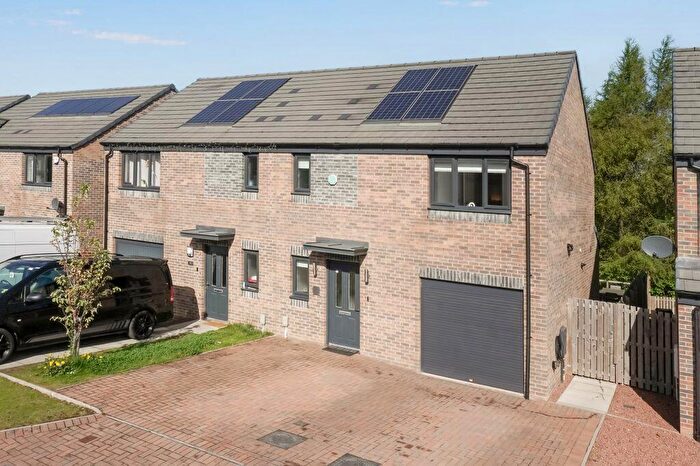
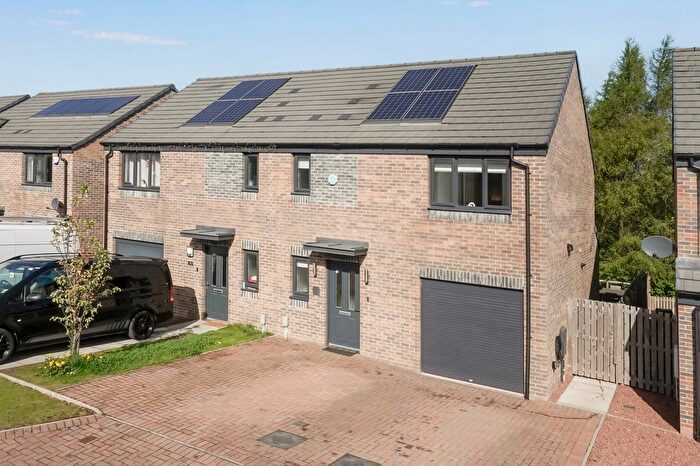
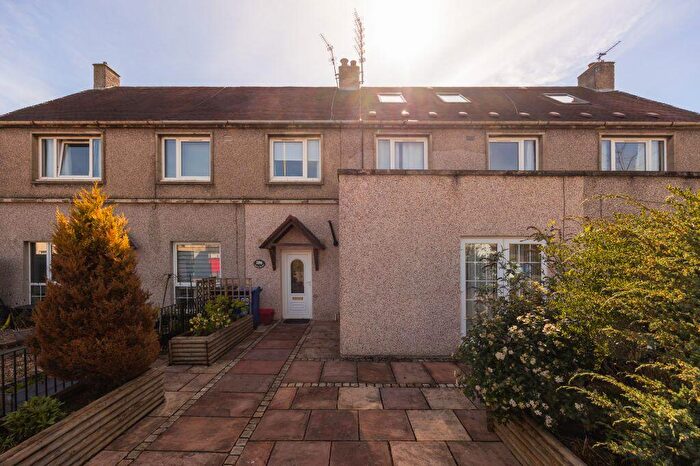
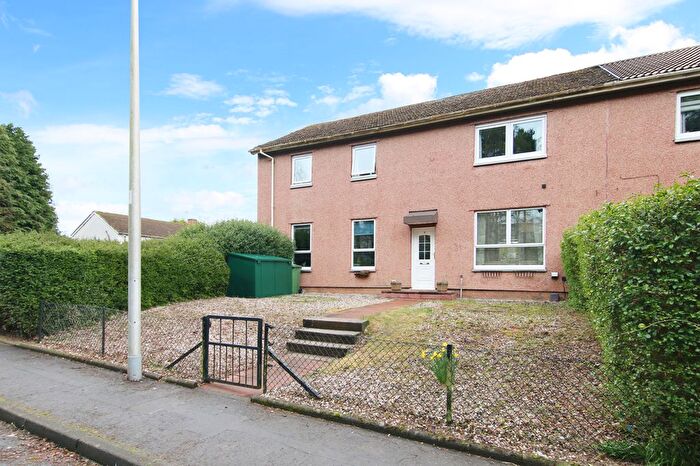
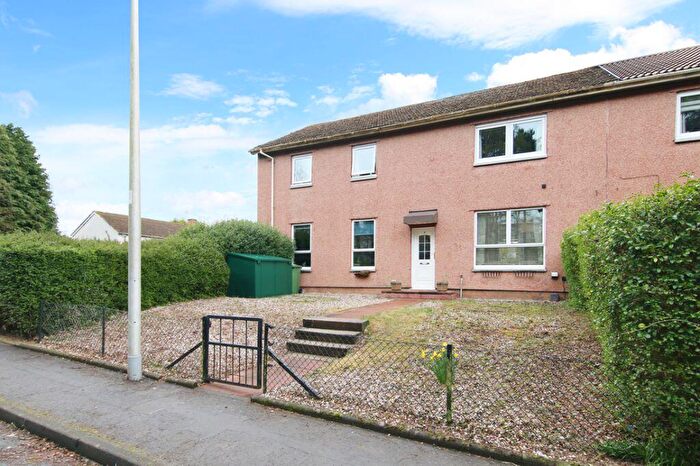
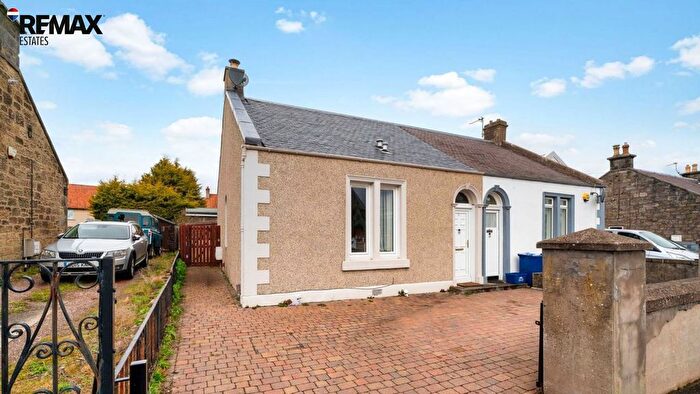
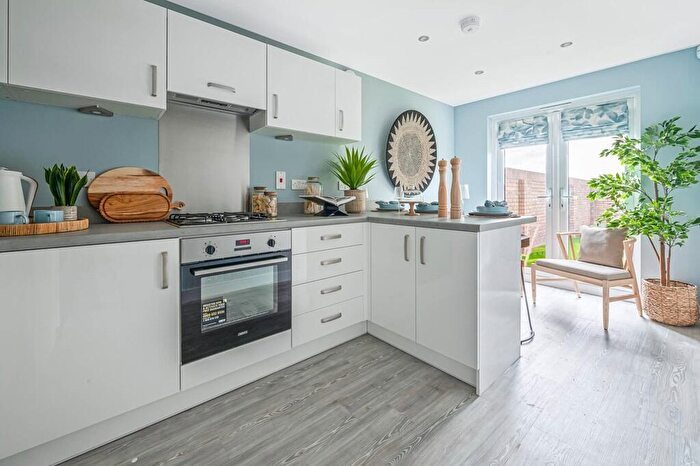
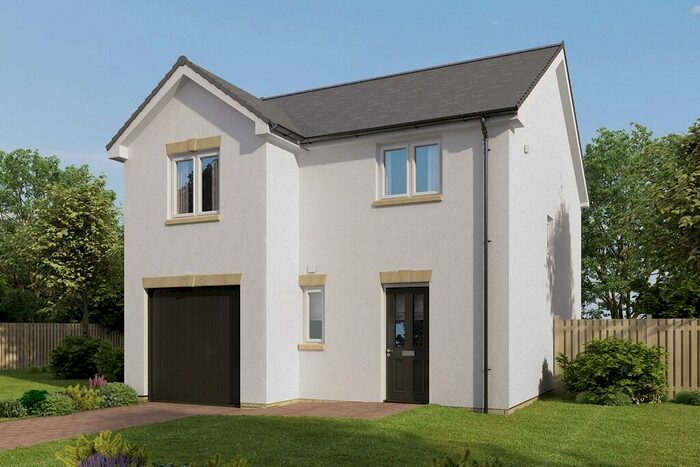
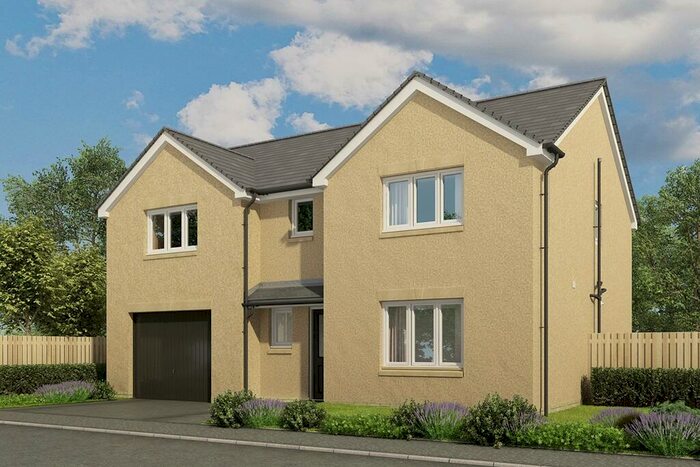
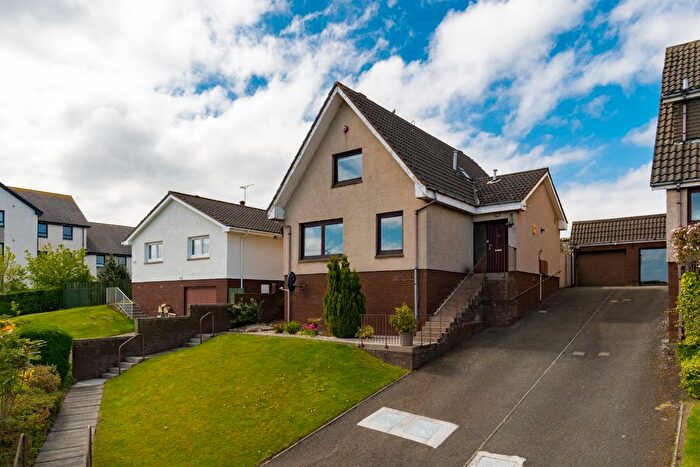
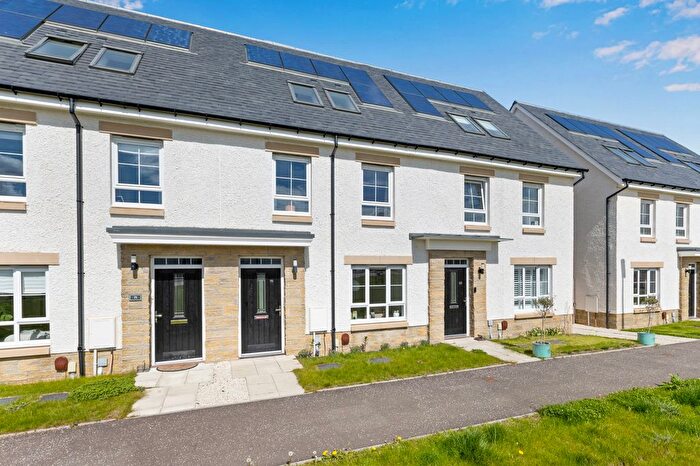
Properties for sale in Loanhead
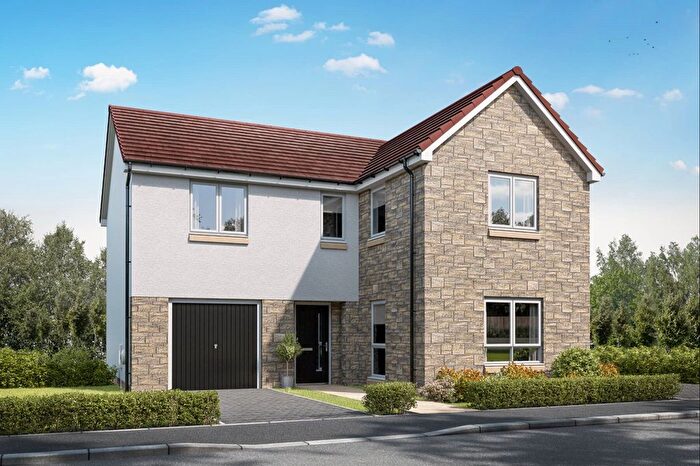

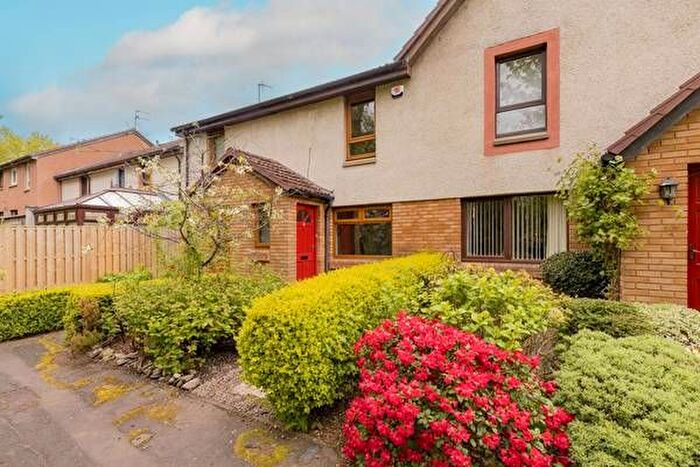
![]()
If you are looking to sell your house, let it out, or receive a property valuation, an expert can help you.
Click the button below to get started.


Neighbourhoods in Loanhead
Navigate through our locations to find the location of your next house in Loanhead, Midlothian for sale or to rent.
Transport in Loanhead
Please see below transportation links in this area:
-
 Eskbank Station
 -
Newtongrange Station
-
Shawfair Station
-
Newcraighall Station
-
Slateford Station
-
Brunstane Station
- FAQ
- Price Paid By Year
Frequently asked questions about Loanhead
What is the average price for a property for sale in Loanhead?
The average price for a property for sale in Loanhead is £247,470. This amount is 3% higher than the average price in Midlothian. There are 1,676 property listings for sale in Loanhead.
Which train stations are available in or near Loanhead?
Some of the train stations available in or near Loanhead are Eskbank, Newtongrange and Shawfair.
Property Price Paid in Loanhead by Year
The average sold property price by year was:
| Year | Average Sold Price | Price Change |
Sold Properties
|
|---|---|---|---|
| 2025 | £275,381 | 16% |
69 Properties |
| 2024 | £232,007 | 0,2% |
66 Properties |
| 2023 | £231,587 | -15% |
57 Properties |
| 2022 | £266,857 | 15% |
113 Properties |
| 2021 | £227,585 | 5% |
162 Properties |
| 2020 | £216,126 | -9% |
98 Properties |
| 2019 | £235,157 | -5% |
137 Properties |
| 2018 | £247,810 | 4% |
138 Properties |
| 2017 | £238,504 | 15% |
163 Properties |
| 2016 | £203,520 | 19% |
158 Properties |
| 2015 | £165,843 | -5% |
106 Properties |
| 2014 | £174,221 | -3% |
91 Properties |
| 2013 | £179,456 | 24% |
72 Properties |
| 2012 | £136,350 | -1% |
69 Properties |
| 2011 | £137,532 | -34% |
47 Properties |
| 2010 | £184,360 | 5% |
72 Properties |
| 2009 | £175,127 | -5% |
44 Properties |
| 2008 | £183,171 | 13% |
107 Properties |
| 2007 | £158,450 | -296% |
140 Properties |
| 2006 | £627,028 | 82% |
137 Properties |
| 2005 | £114,546 | 3% |
136 Properties |
| 2004 | £110,831 | -17% |
146 Properties |
| 2003 | £129,303 | 13% |
201 Properties |
| 2002 | £112,641 | 14% |
148 Properties |
| 2001 | £96,472 | 52% |
9 Properties |
| 2000 | £46,740 | - |
5 Properties |