
Houses for sale in Midlothian East, Pathhead
House Prices in Midlothian East
Properties in Midlothian East have an average house price of £284k and had 16 Property Transactions within the last 3 years¹.
Midlothian East is an area in Pathhead, Midlothian with 675 households², where the most expensive property was sold for £691k.
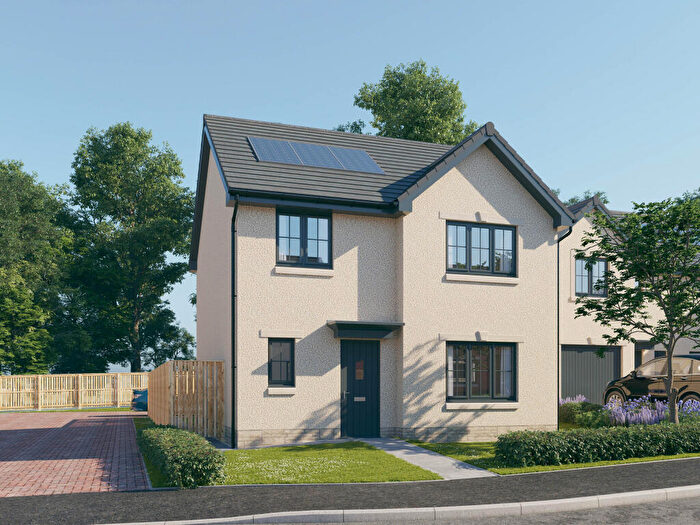
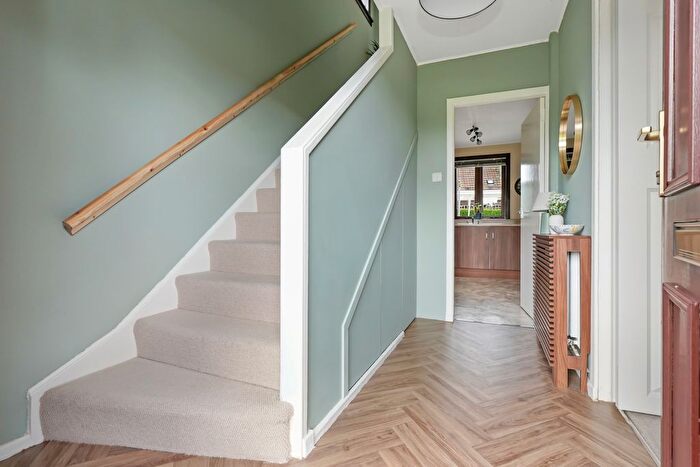
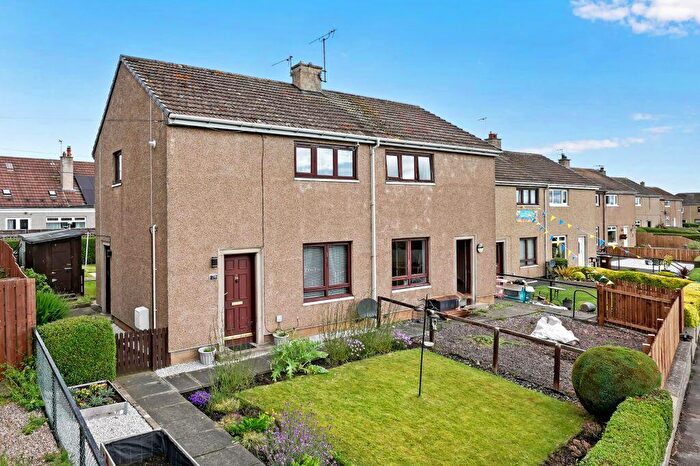
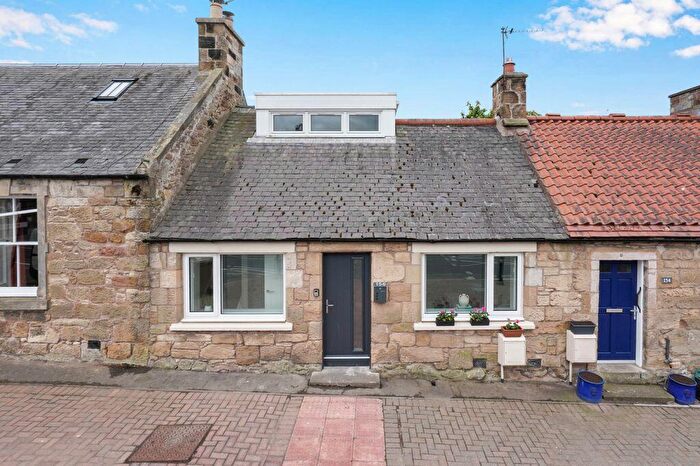
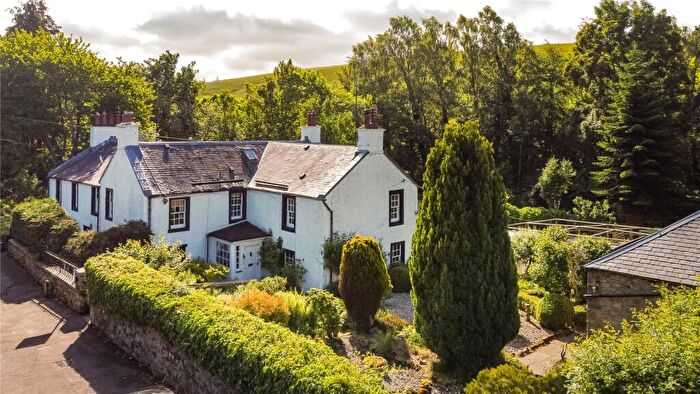
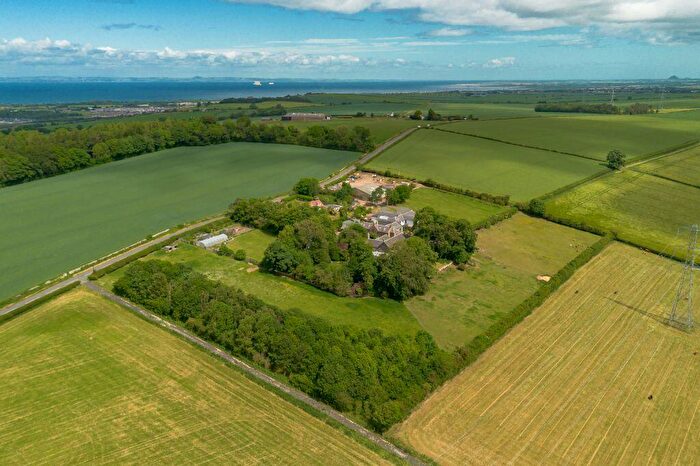
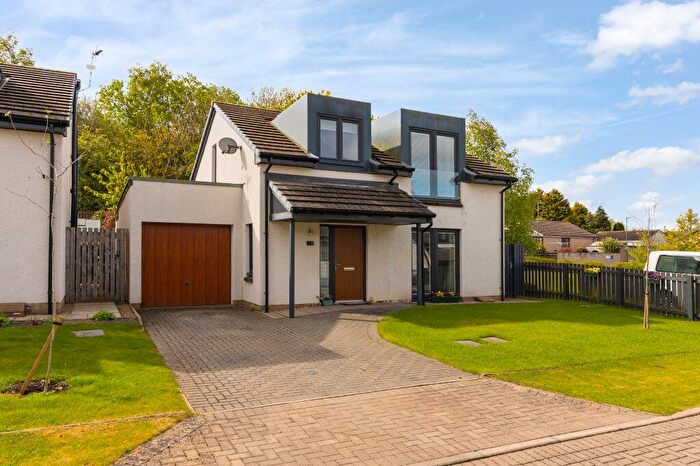
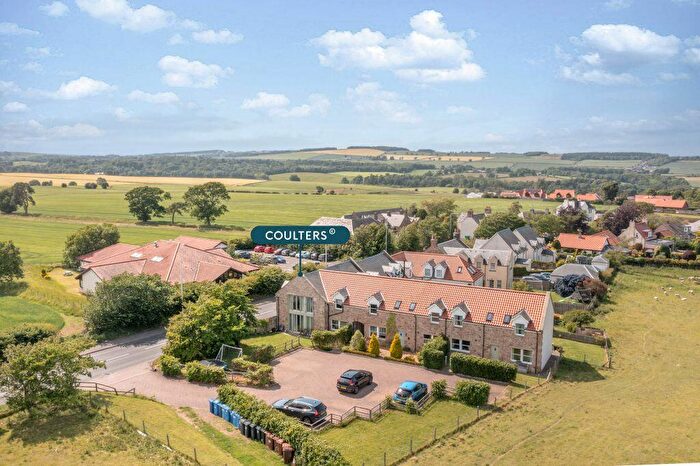
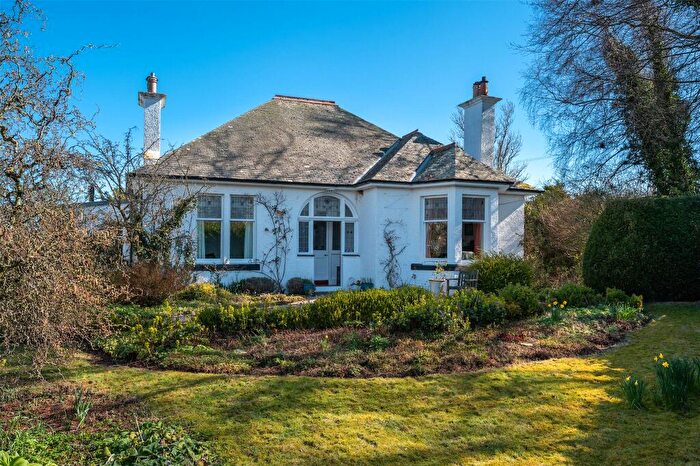
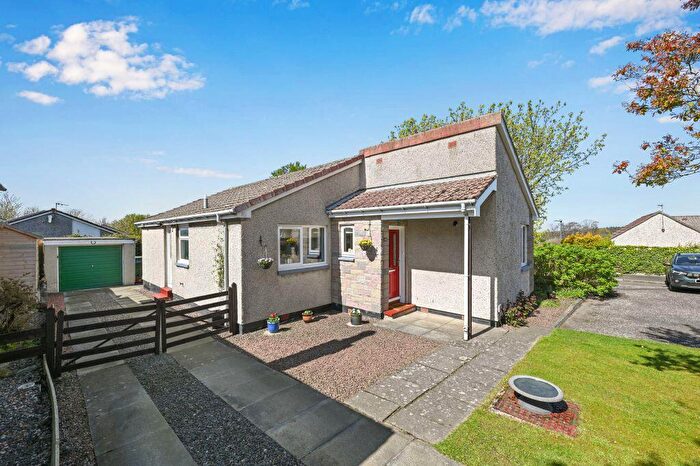
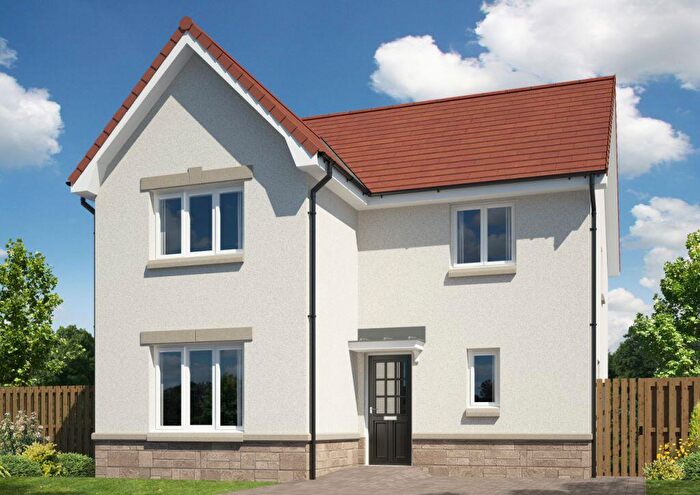
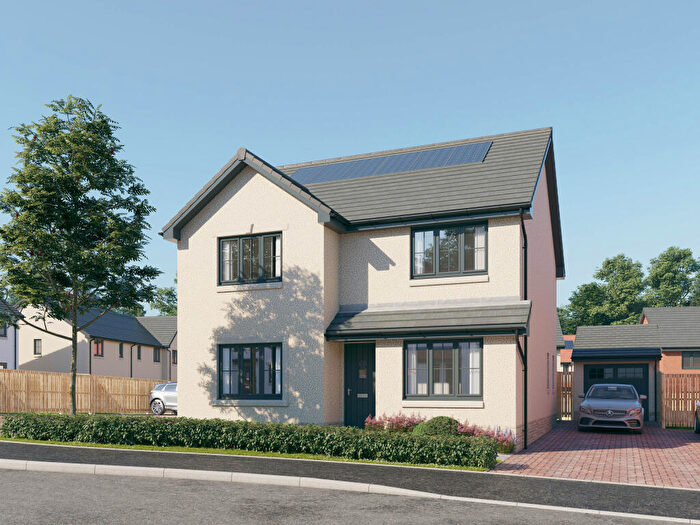
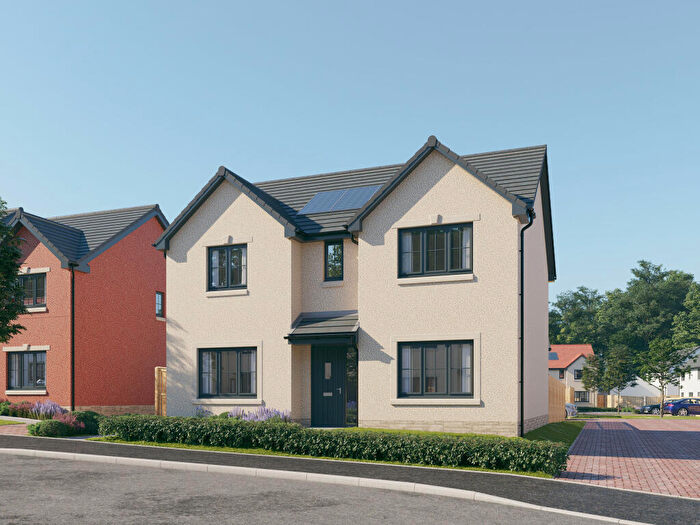
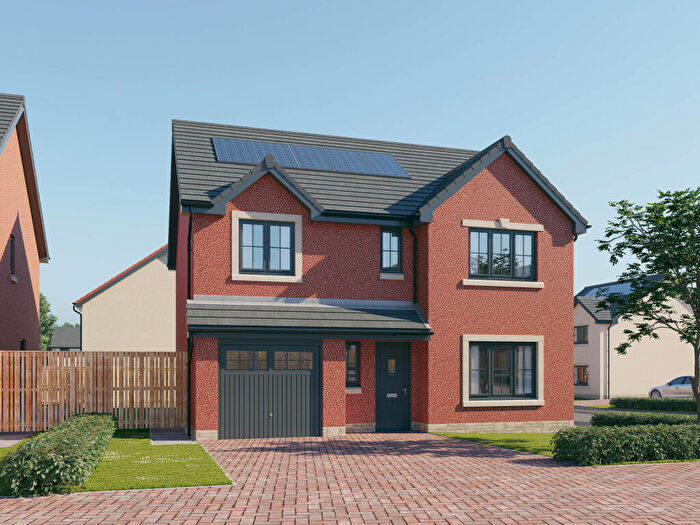
Properties for sale in Midlothian East
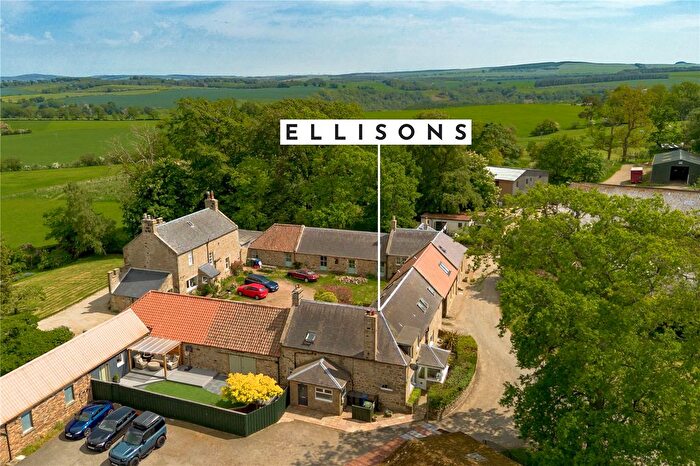
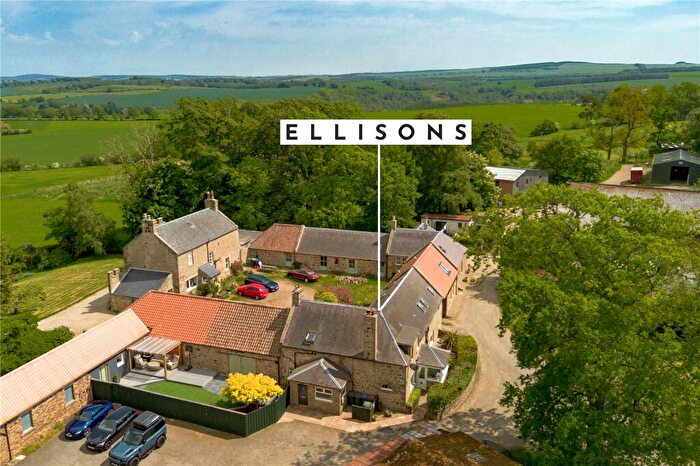
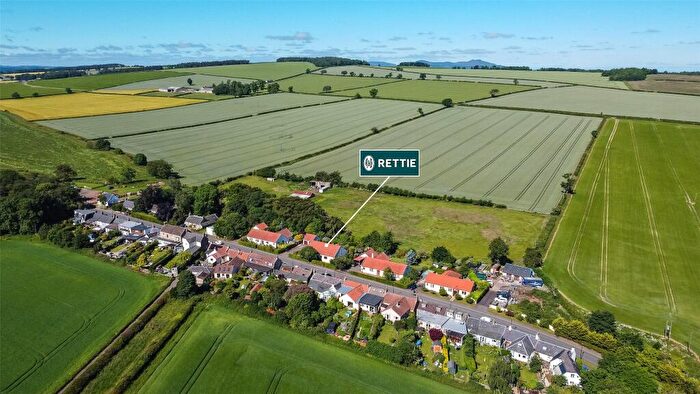
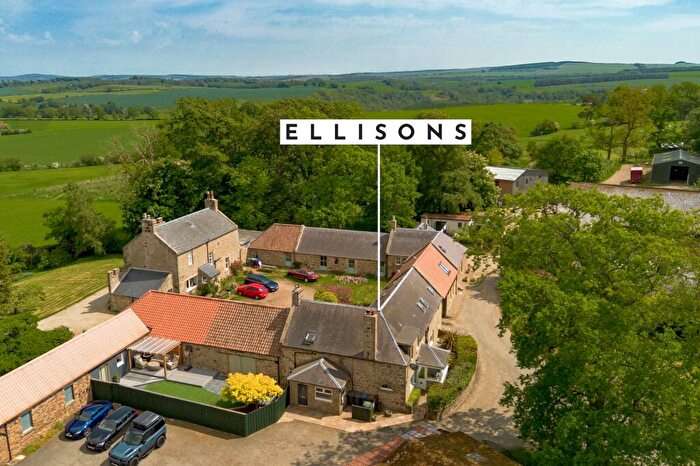
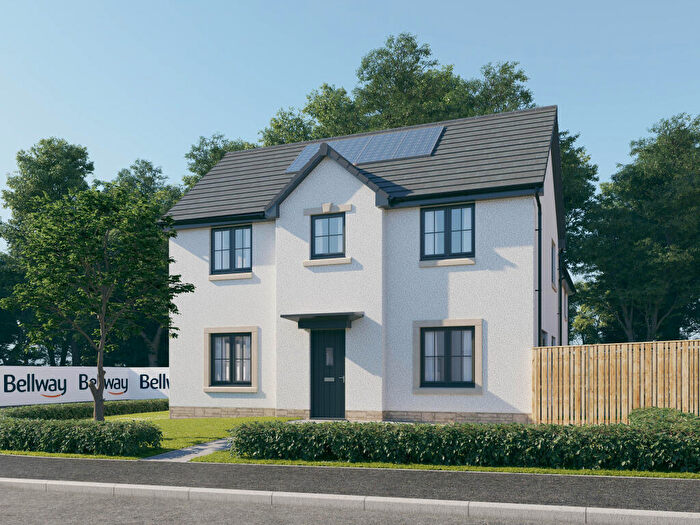
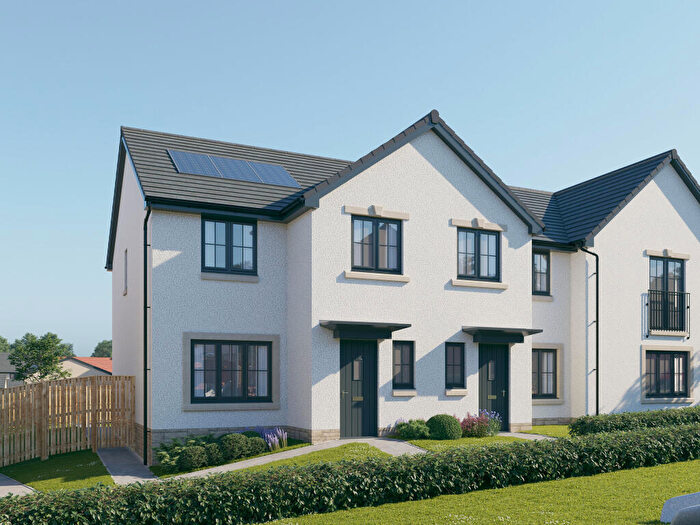
![]()
If you are looking to sell your house, let it out, or receive a property valuation, an expert can help you.
Click the button below to get started.
Roads and Postcodes in Midlothian East
Navigate through our locations to find the location of your next house in Midlothian East, Pathhead for sale or to rent.
Property price trends in Midlothian East
According to the latest Registers of Scotland data, the average home in Midlothian East sold for £171,216 in 2025. That figure comes from 417 sales logged over the past 25 years.
Prices have fallen back over the last three years. Compared with 2022, when the typical sale came in around £345,273, that's a fall of roughly 50.4%.
Looking back five years, average prices are down about 39.4% since 2020, a drop of around £111,285 in cash terms.
Zoom out to the past decade for the fuller picture. Back in 2015, homes here averaged £268,688, so the typical sold price has fallen about 36.3% since then, around 4.4% a year lower. Stretch the view to fifteen years and that annual pace edges up closer to -0.2%.
Frequently asked questions about Midlothian East
What is the average price for a property for sale in Midlothian East?
The average price for a property for sale in Midlothian East is £284,300. There are 413 property listings for sale in Midlothian East.
What streets have the most expensive properties for sale in Midlothian East?
The streets with the most expensive properties for sale in Midlothian East are Fala Dam at an average of £460,000, Roman Court at an average of £390,000 and Main Street at an average of £268,841.
What streets have the most affordable properties for sale in Midlothian East?
The streets with the most affordable properties for sale in Midlothian East are Oxenfoord Drive at an average of £159,000, Crichton Terrace at an average of £183,275 and Crichton Avenue at an average of £184,567.
Which train stations are available in or near Midlothian East?
Some of the train stations available in or near Midlothian East are Gorebridge, Newtongrange and Eskbank.
Property Price Paid in Midlothian East by Year
The average sold property price by year was:
| Year | Average Sold Price | Price Change |
Sold Properties
|
|---|---|---|---|
| 2025 | £171,216 | -88% |
4 Properties |
| 2024 | £322,456 | 0,3% |
6 Properties |
| 2023 | £321,533 | -7% |
6 Properties |
| 2022 | £345,273 | 1% |
26 Properties |
| 2021 | £340,763 | 17% |
8 Properties |
| 2020 | £282,501 | -9% |
15 Properties |
| 2019 | £309,269 | -8% |
17 Properties |
| 2018 | £334,765 | 8% |
14 Properties |
| 2017 | £309,238 | 7% |
27 Properties |
| 2016 | £288,994 | 7% |
26 Properties |
