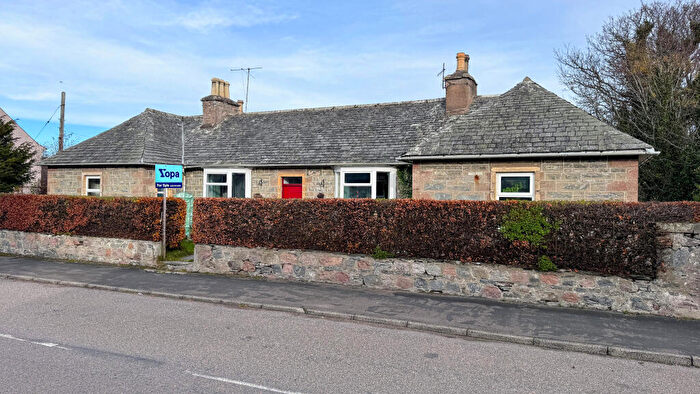
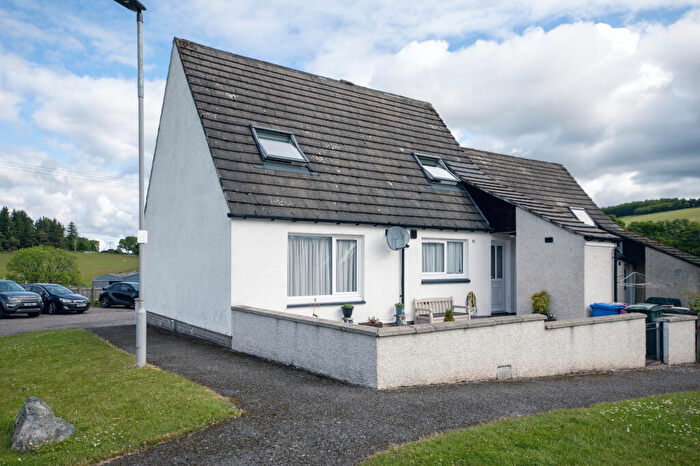
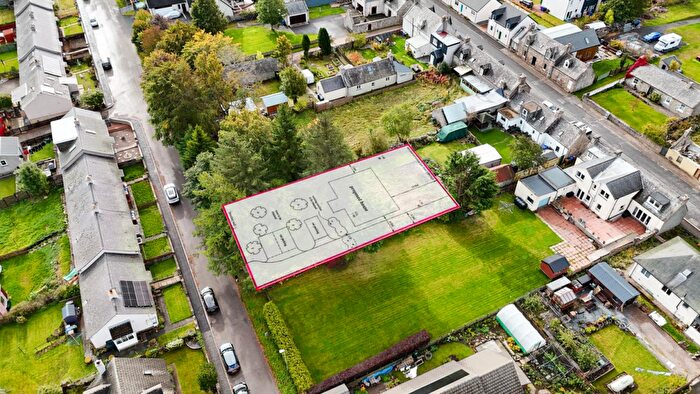
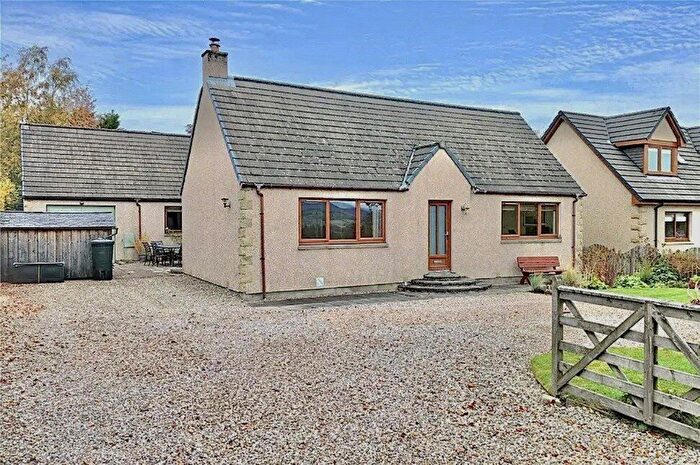
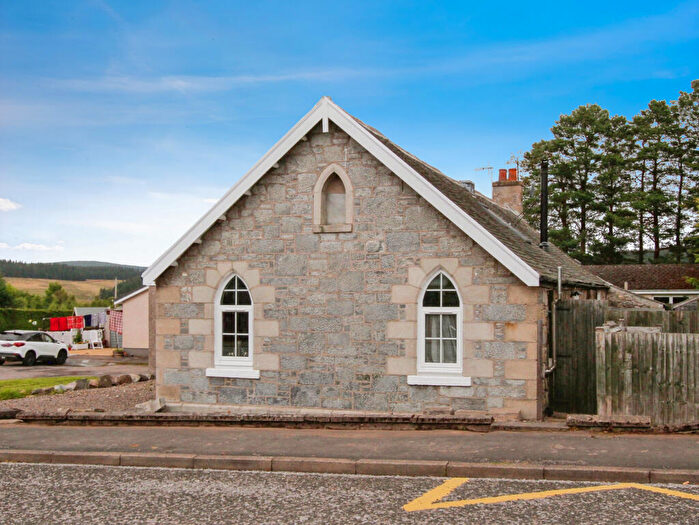
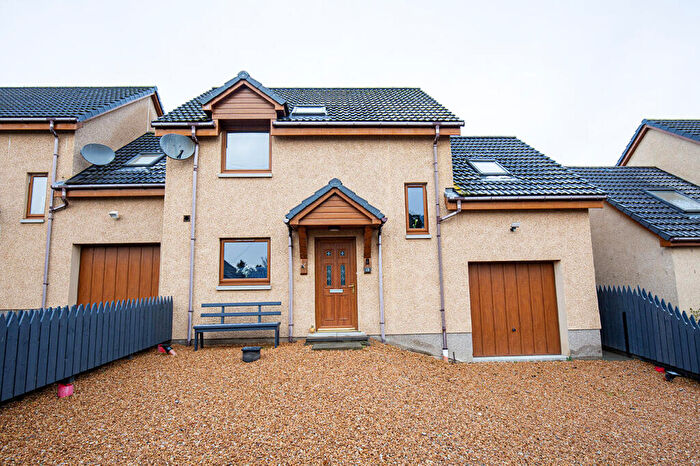
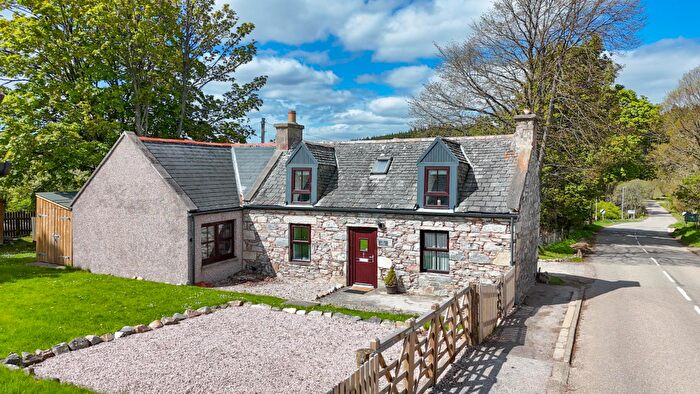
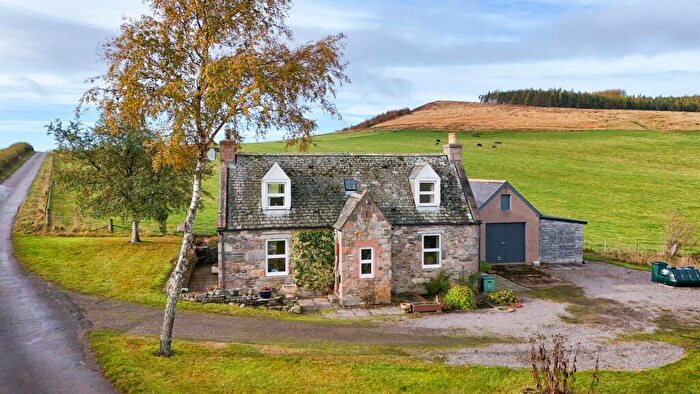
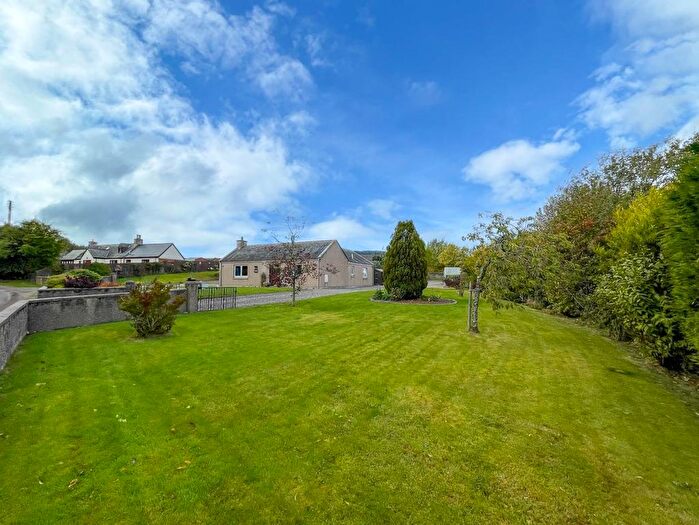
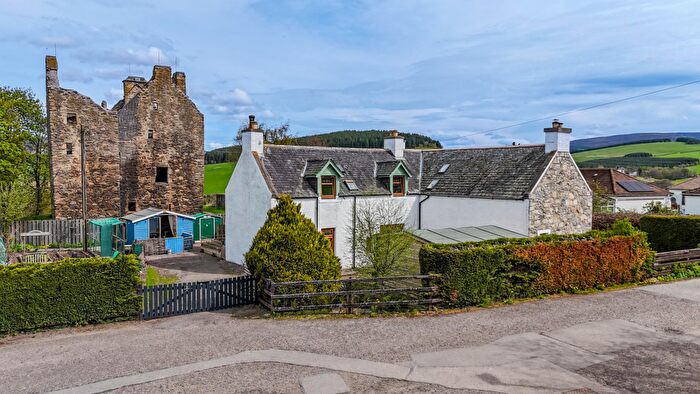
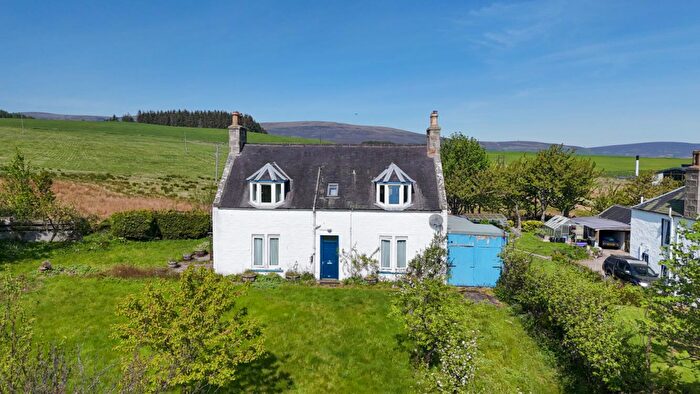
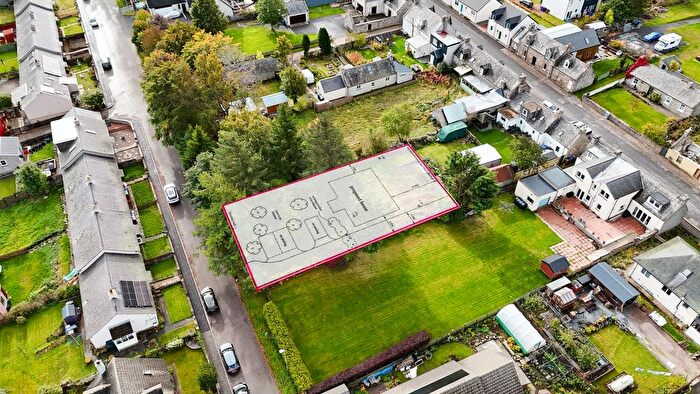
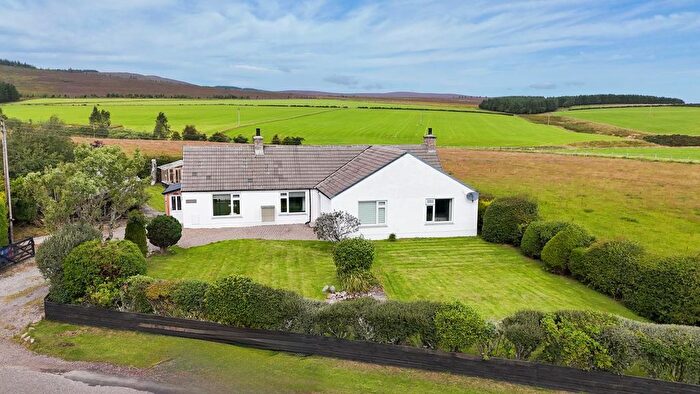
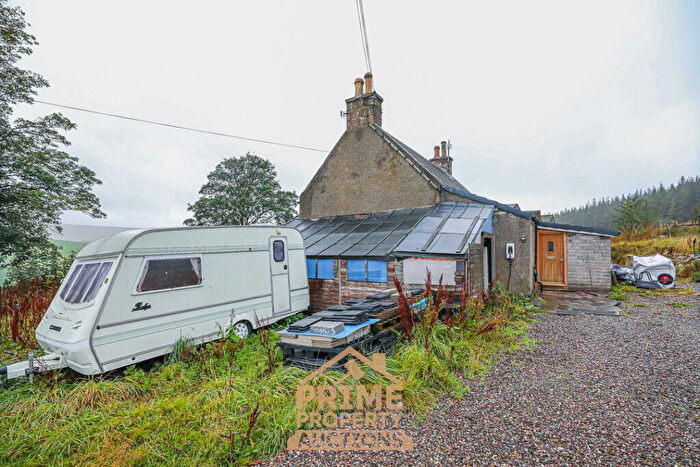
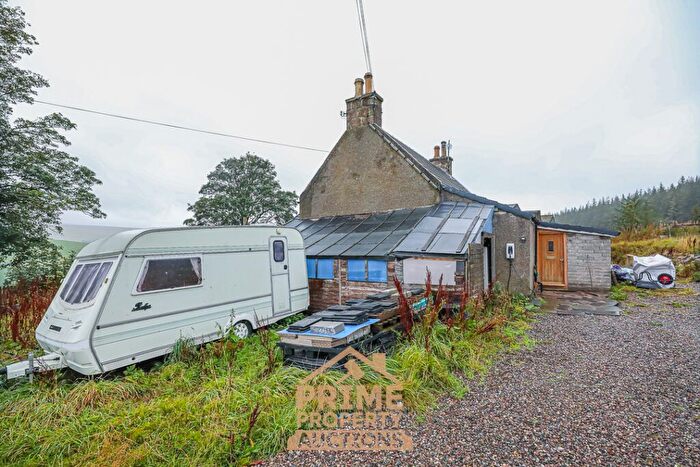
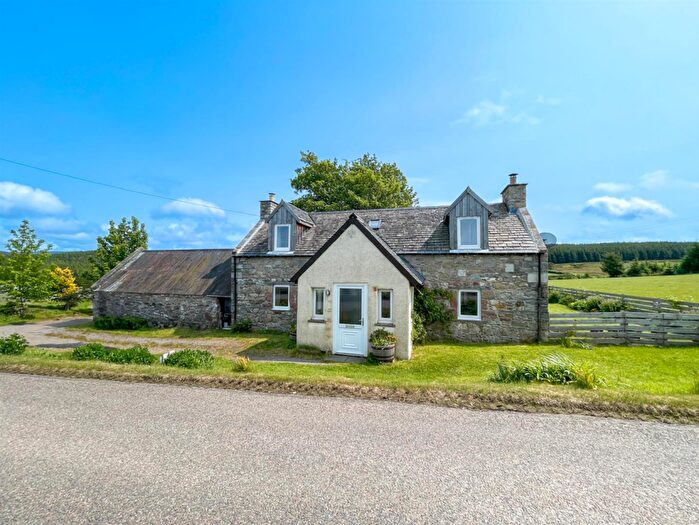
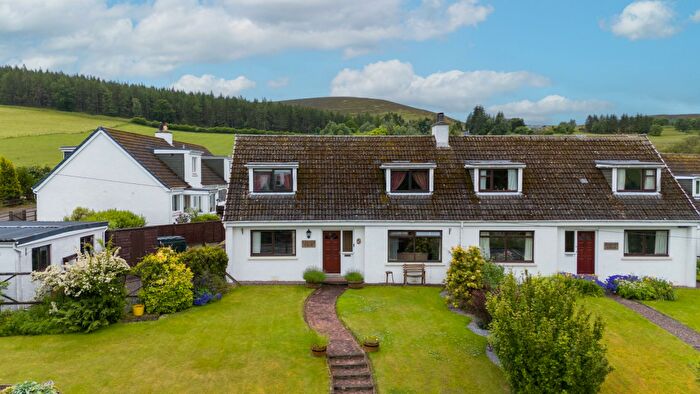
Houses for sale & to rent in Speyside Glenlivet, Ballindalloch
House Prices in Speyside Glenlivet
Properties in Speyside Glenlivet have an average house price of £240,563.00 and had 42 Property Transactions within the last 3 years¹.
Speyside Glenlivet is an area in Ballindalloch, Moray with 670 households², where the most expensive property was sold for £565,000.00.
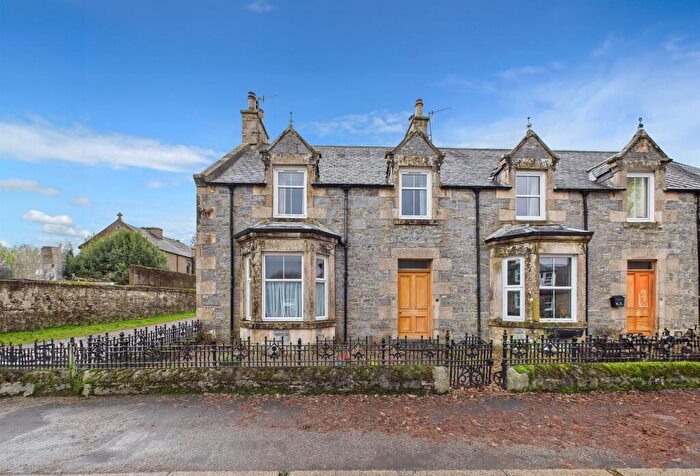
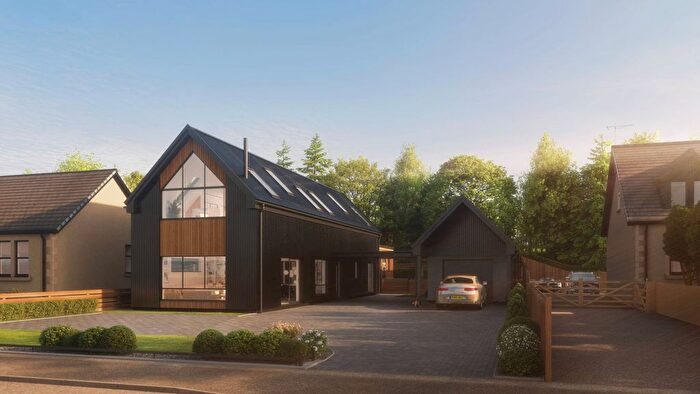
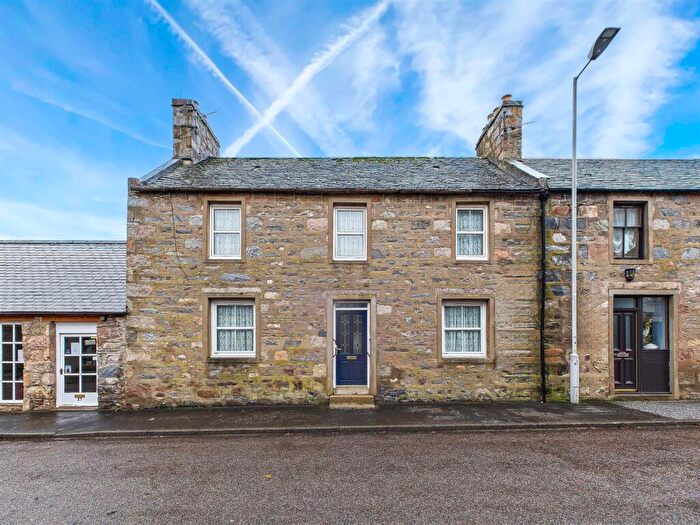
Properties for sale in Speyside Glenlivet
Previously listed properties in Speyside Glenlivet
Roads and Postcodes in Speyside Glenlivet
Navigate through our locations to find the location of your next house in Speyside Glenlivet, Ballindalloch for sale or to rent.
Transport near Speyside Glenlivet
-
Carrbridge Station
-
Aviemore Station
-
Keith Station
-
Elgin Station
-
Forres Station
-
Huntly Station
-
Nairn Station
-
Insch Station
- FAQ
- Price Paid By Year
Frequently asked questions about Speyside Glenlivet
What is the average price for a property for sale in Speyside Glenlivet?
The average price for a property for sale in Speyside Glenlivet is £240,563. There are 246 property listings for sale in Speyside Glenlivet.
Which train stations are available in or near Speyside Glenlivet?
Some of the train stations available in or near Speyside Glenlivet are Carrbridge, Aviemore and Keith.
Property Price Paid in Speyside Glenlivet by Year
The average sold property price by year was:
| Year | Average Sold Price | Price Change |
Sold Properties
|
|---|---|---|---|
| 2023 | £296,733 | 22% |
6 Properties |
| 2022 | £231,201 | 8% |
36 Properties |
| 2021 | £211,645 | 6% |
28 Properties |
| 2020 | £199,780 | 18% |
17 Properties |
| 2019 | £163,823 | 5% |
25 Properties |
| 2018 | £156,396 | -12% |
17 Properties |
| 2017 | £174,409 | -5% |
11 Properties |
| 2016 | £183,140 | 20% |
29 Properties |
| 2015 | £147,285 | -4% |
28 Properties |
| 2014 | £153,342 | 17% |
19 Properties |
| 2013 | £127,157 | 16% |
25 Properties |
| 2012 | £107,255 | -38% |
19 Properties |
| 2011 | £147,881 | 19% |
16 Properties |
| 2010 | £119,091 | -28% |
16 Properties |
| 2009 | £152,930 | 6% |
20 Properties |
| 2008 | £143,665 | -40% |
24 Properties |
| 2007 | £201,723 | 33% |
33 Properties |
| 2006 | £134,458 | 4% |
29 Properties |
| 2005 | £128,747 | 31% |
33 Properties |
| 2004 | £88,689 | 34% |
43 Properties |
| 2003 | £58,873 | -44% |
44 Properties |
| 2002 | £84,750 | 39% |
2 Properties |
| 2001 | £51,916 | -36% |
6 Properties |
| 2000 | £70,625 | - |
2 Properties |

