
Houses for sale in Moray, Scotland
House Prices in Moray
Properties in Moray have
an average house price of
£186k
and had 2,358 Property Transactions
within the last 3 years.¹
Moray is a location in
Scotland with
39,952 households², where the most expensive property was sold for £1.09M.
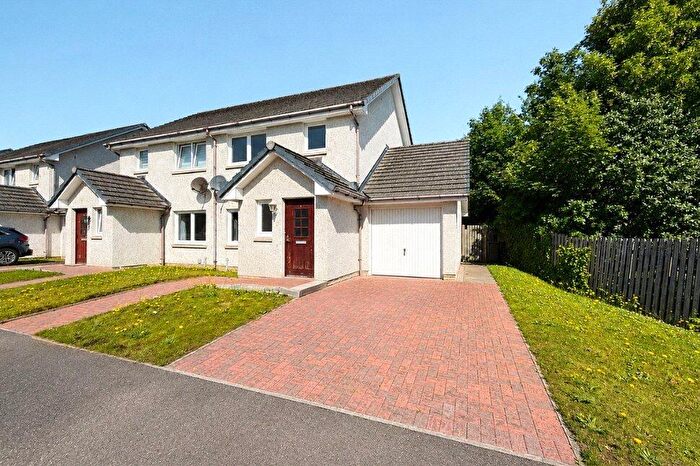
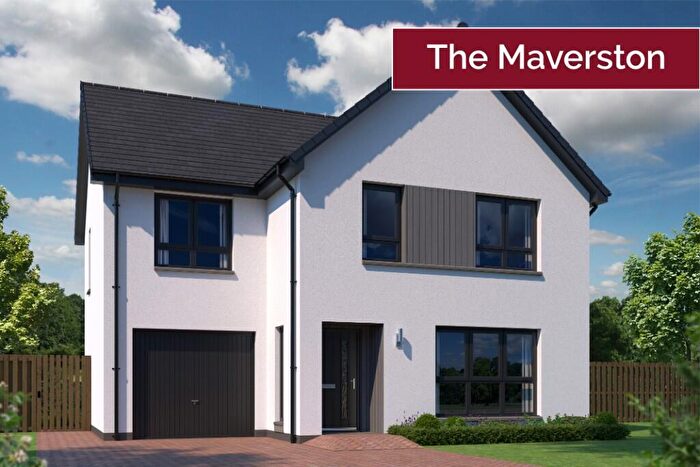
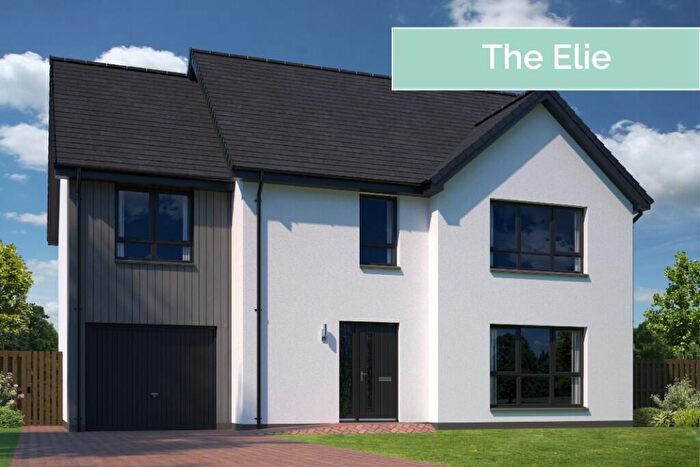
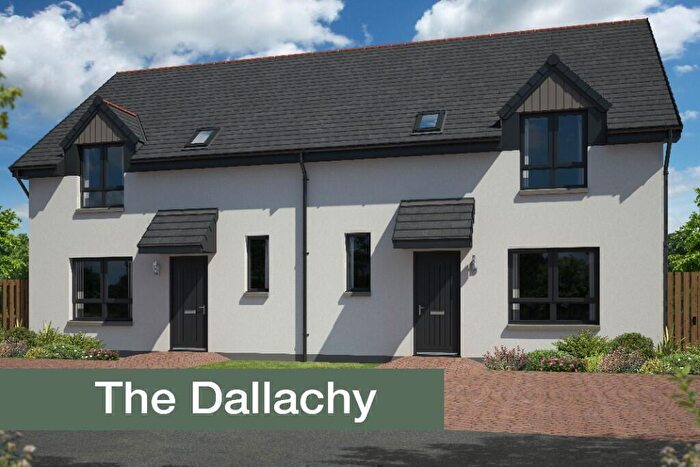
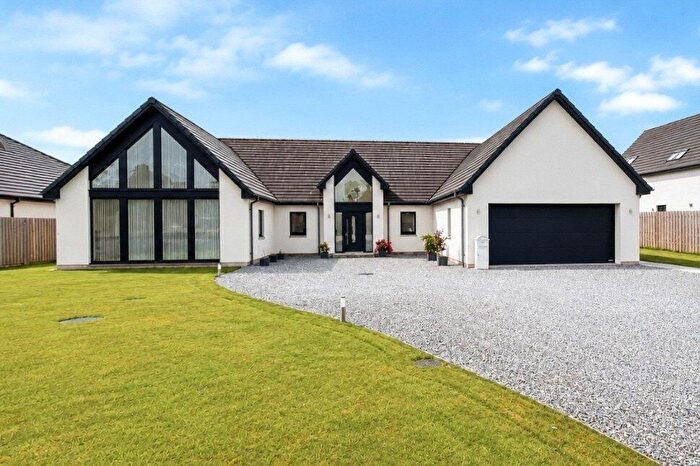
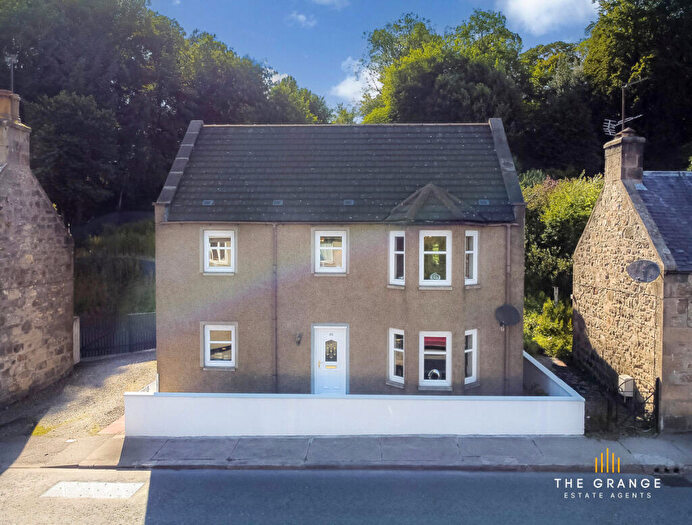
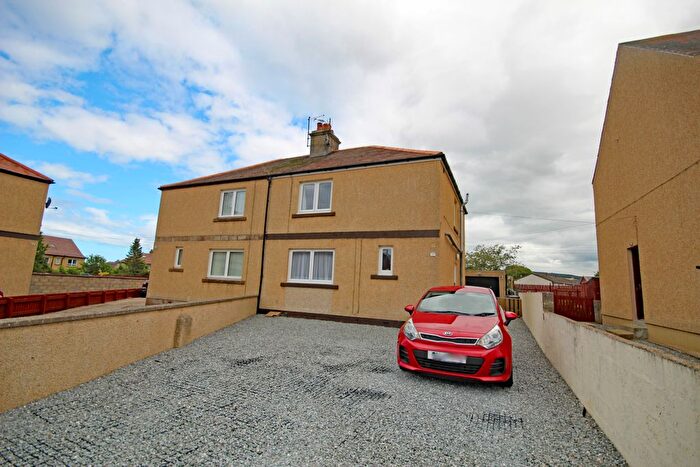
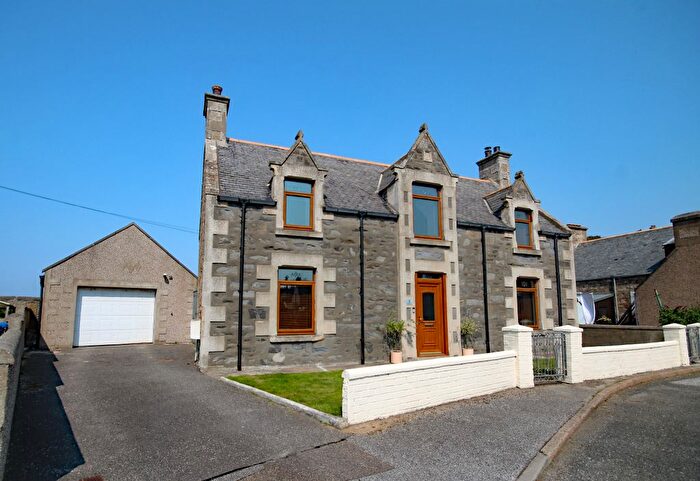
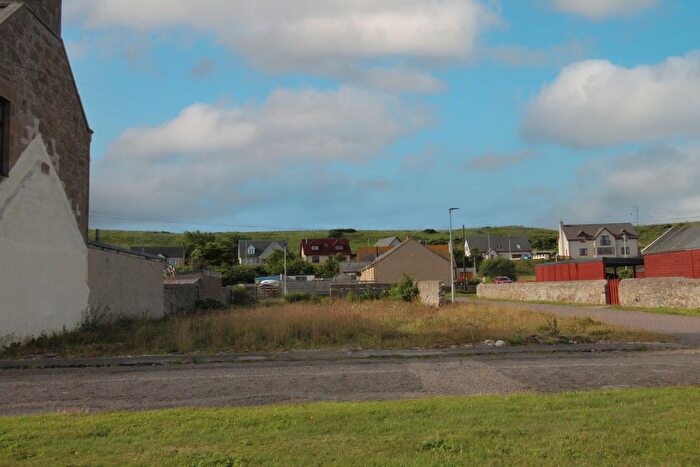
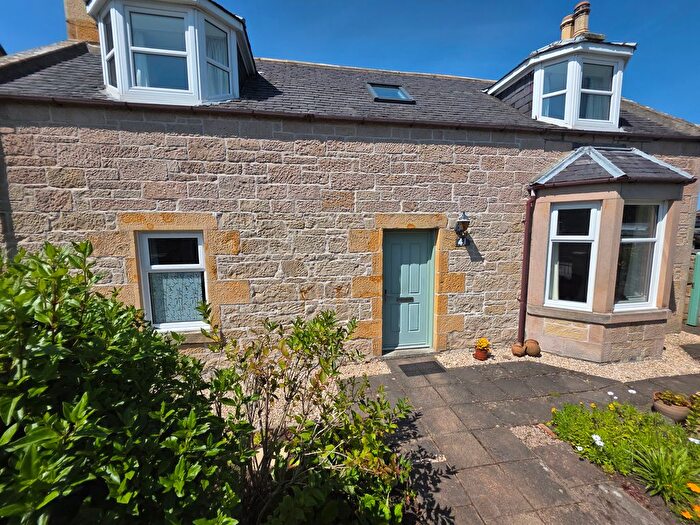
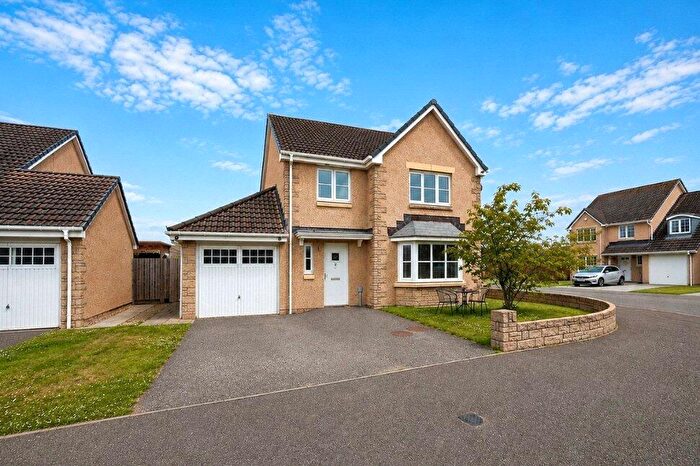
Properties for sale in Moray
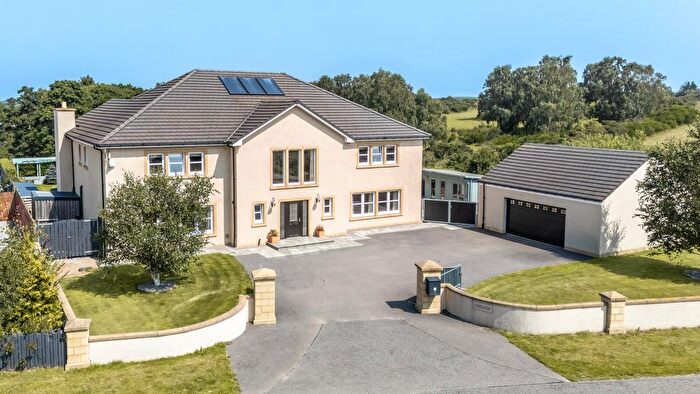

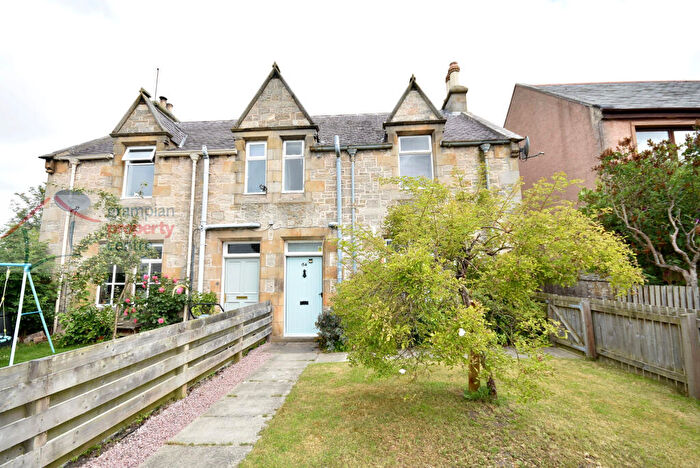
![]()
If you are looking to sell your house, let it out, or receive a property valuation, an expert can help you.
Click the button below to get started.

Towns in Moray
Navigate through our locations to find the location of your next house in Moray, Scotland for sale or to rent.
Property price trends in Moray
According to the latest Registers of Scotland data, the average home in Moray sold for £188,425 in 2026. That figure comes from a substantial record of 37,624 sales logged over the past 26 years.
Prices have moved up over the last three years. Compared with 2023, when the typical sale came in around £184,596, that's a rise of roughly 2.1%.
Looking back five years, average prices are up about 1.4% since 2021, a gain of around £2,658 in cash terms.
Zoom out to the past decade for the fuller picture. Back in 2016, homes here averaged £154,421, so the typical sold price has climbed about 22% since then, roughly 2% a year. Stretch the view to fifteen years and that annual pace holds at about 2%.
Frequently asked questions about Moray
What is the average price for a property for sale in Moray?
The average price for a property for sale in Moray is £185,599. This amount is 8% lower than the average price in Scotland. There are 9,518 property listings for sale in Moray.
What locations have the most expensive properties for sale in Moray?
The locations with the most expensive properties for sale in Moray are Ballindalloch at an average of £285,988, Fochabers at an average of £229,676 and Elgin at an average of £192,735.
What locations have the most affordable properties for sale in Moray?
The locations with the most affordable properties for sale in Moray are Keith at an average of £156,443, Buckie at an average of £167,386 and Aberlour at an average of £175,321.
Which train stations are available in or near Moray?
Some of the train stations available in or near Moray are Elgin, Keith and Forres.
Property Price Paid in Moray by Year
The average sold property price by year was:
| Year | Average Sold Price | Price Change |
Sold Properties
|
|---|---|---|---|
| 2026 | £188,425 | 0,1% |
131 Properties |
| 2025 | £188,177 | 3% |
749 Properties |
| 2024 | £183,285 | -1% |
625 Properties |
| 2023 | £184,596 | -8% |
853 Properties |
| 2022 | £199,371 | 7% |
1,742 Properties |
| 2021 | £185,767 | 4% |
1,948 Properties |
| 2020 | £177,408 | 4% |
1,443 Properties |
| 2019 | £169,679 | 2% |
1,688 Properties |
| 2018 | £166,229 | 5% |
1,695 Properties |
| 2017 | £158,544 | 3% |
1,754 Properties |
Transport in Moray
Please see below transportation links in this area:
