
Houses for sale & to rent in Fochabers Lhanbryde, Buckie
House Prices in Fochabers Lhanbryde
Properties in Fochabers Lhanbryde have an average house price of £185k and had 35 Property Transactions within the last 3 years¹.
Fochabers Lhanbryde is an area in Buckie, Moray with 584 households², where the most expensive property was sold for £550k.
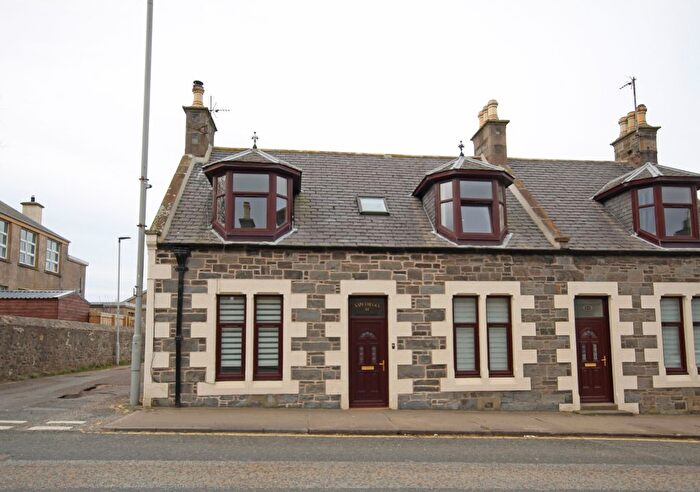
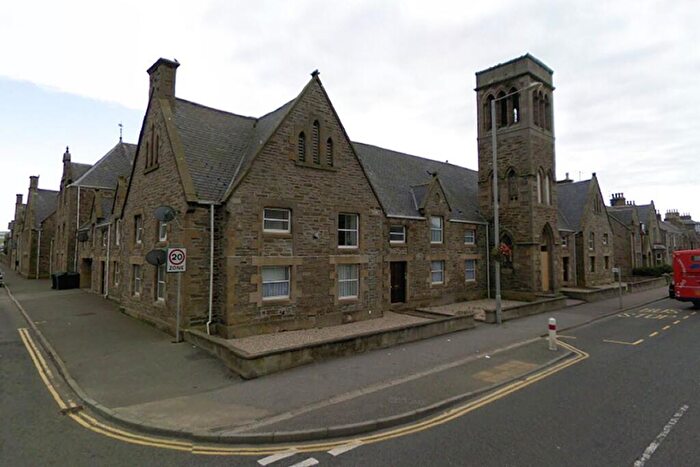
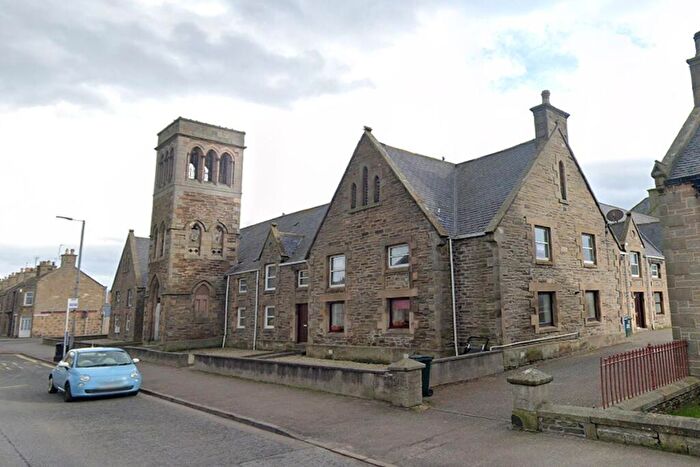
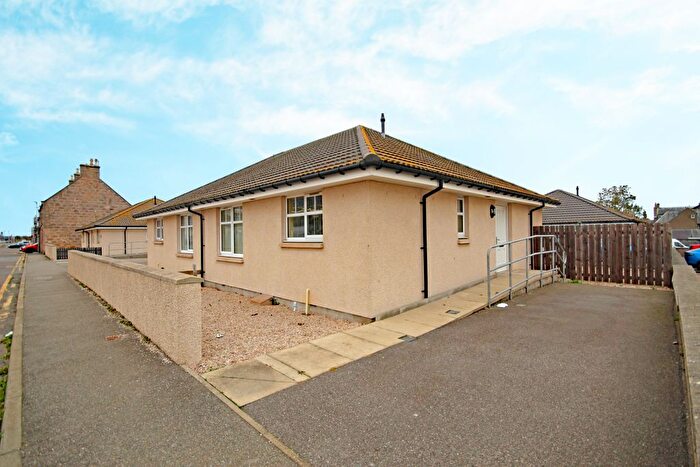
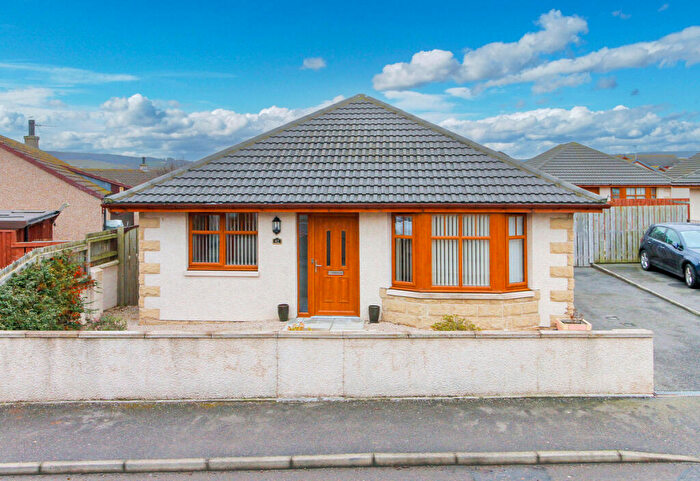
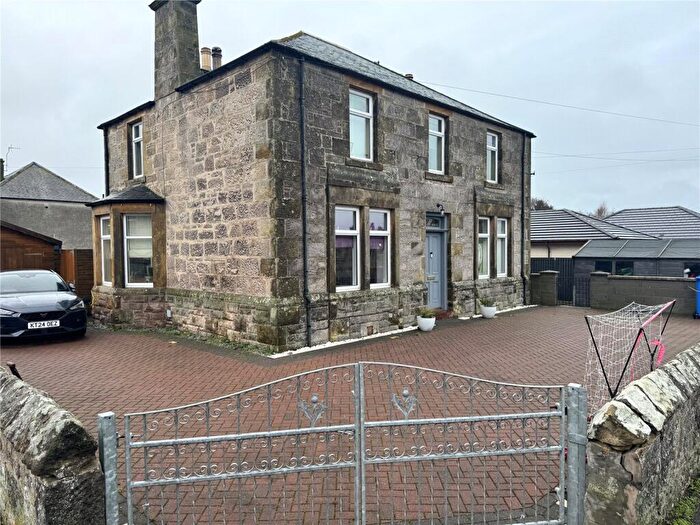
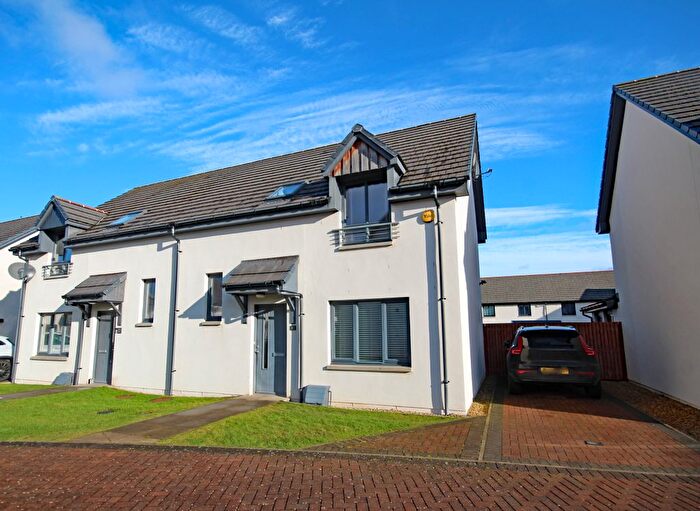
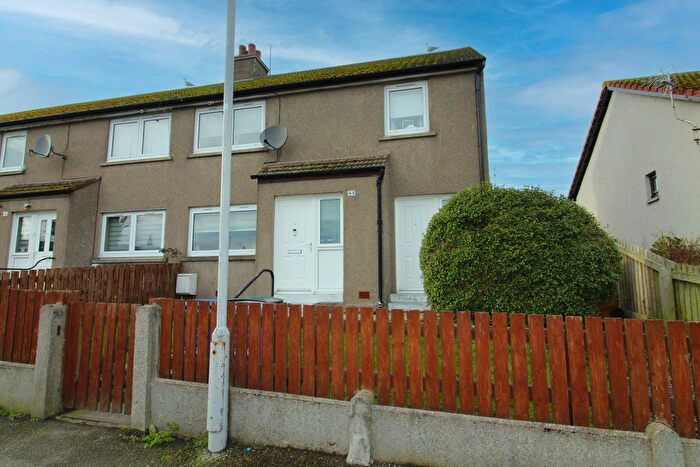
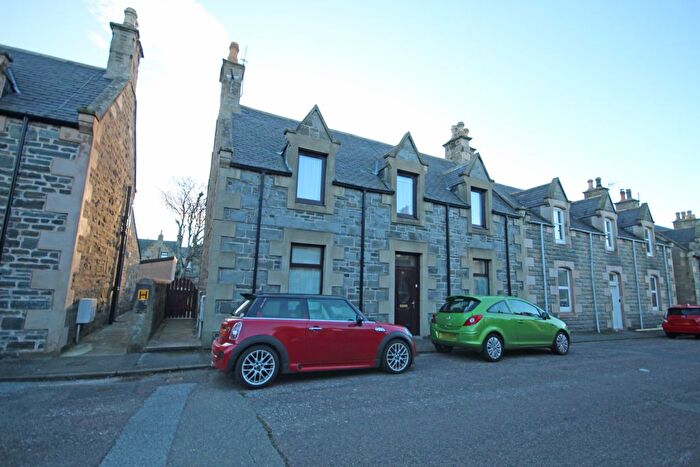
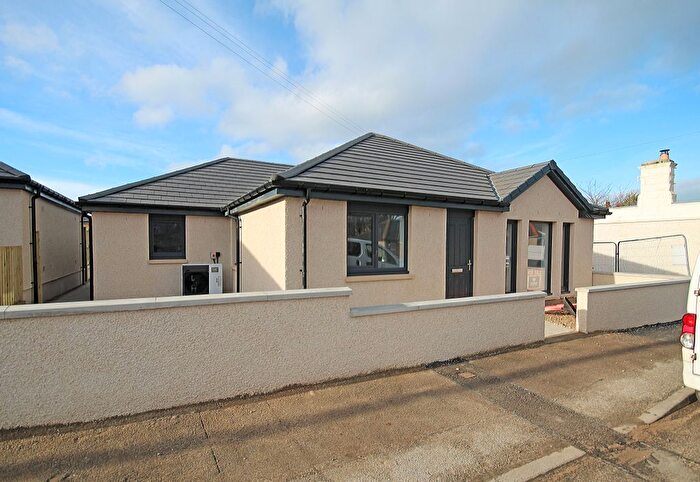
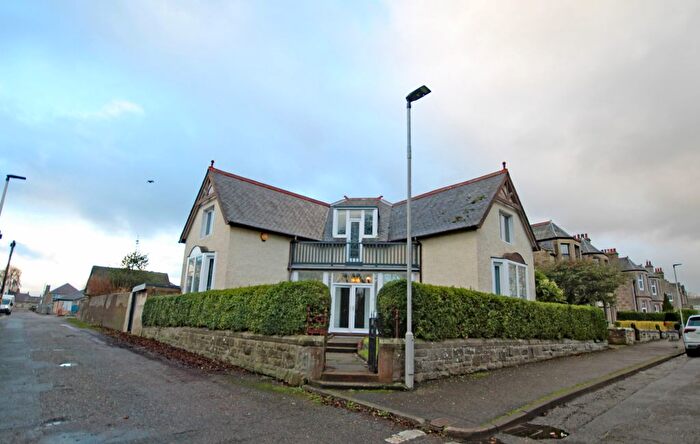
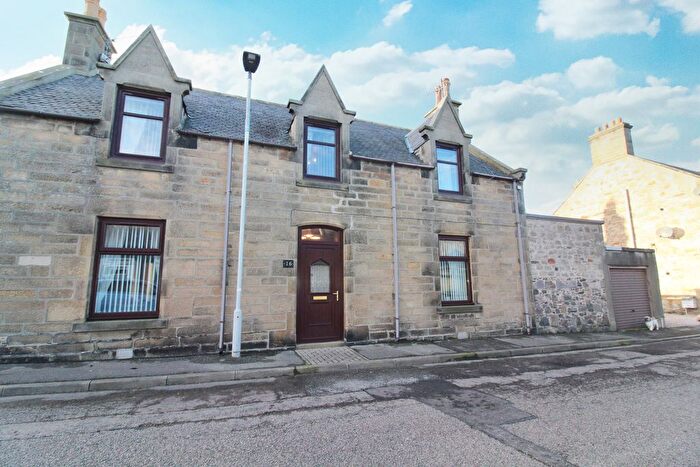
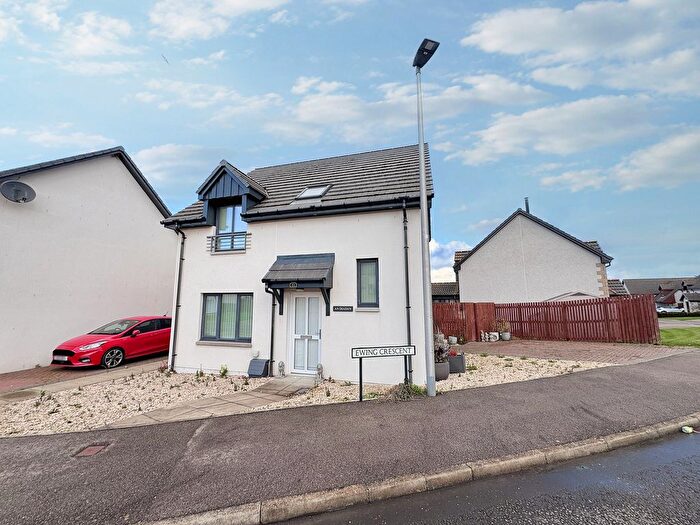
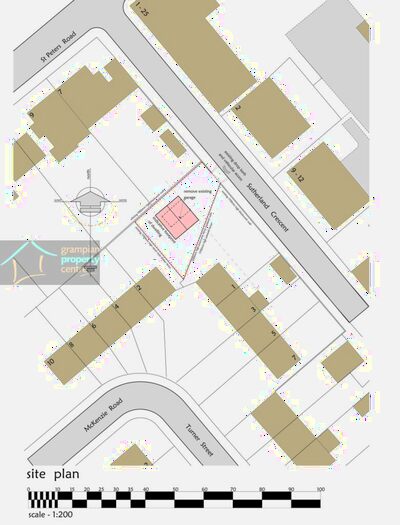
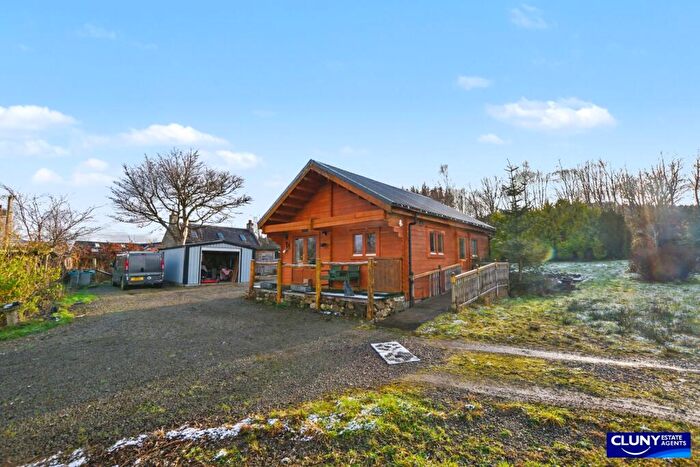
Properties for sale in Fochabers Lhanbryde
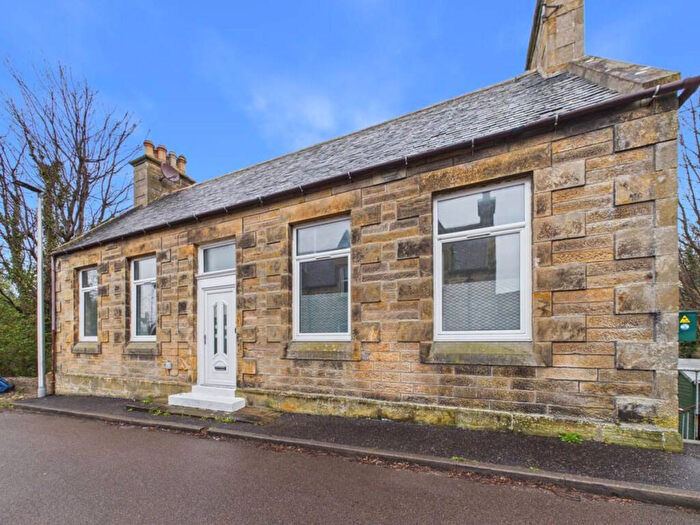

![]()
If you are looking to sell your house, let it out, or receive a property valuation, an expert can help you.
Click the button below to get started.


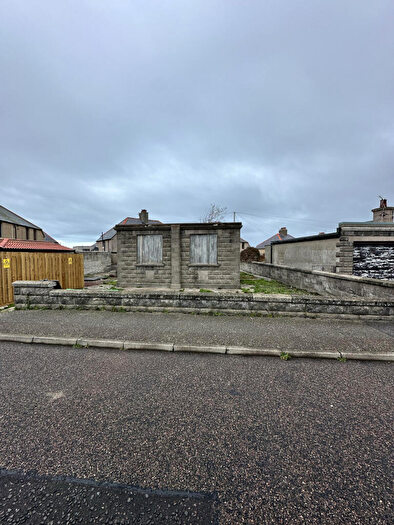


Previously listed properties in Fochabers Lhanbryde
Roads and Postcodes in Fochabers Lhanbryde
Navigate through our locations to find the location of your next house in Fochabers Lhanbryde, Buckie for sale or to rent.
Transport near Fochabers Lhanbryde

- FAQ
- Price Paid By Year
Frequently asked questions about Fochabers Lhanbryde
What is the average price for a property for sale in Fochabers Lhanbryde?
The average price for a property for sale in Fochabers Lhanbryde is £184,585. This amount is 10% higher than the average price in Buckie. There are 601 property listings for sale in Fochabers Lhanbryde.
What streets have the most expensive properties for sale in Fochabers Lhanbryde?
The streets with the most expensive properties for sale in Fochabers Lhanbryde are Drybridge at an average of £550,000, Earls View at an average of £360,000 and Harbour Head at an average of £255,000.
What streets have the most affordable properties for sale in Fochabers Lhanbryde?
The streets with the most affordable properties for sale in Fochabers Lhanbryde are Duke Street at an average of £126,500, Crown Terrace at an average of £128,666 and Tannachy Terrace at an average of £137,000.
Which train stations are available in or near Fochabers Lhanbryde?
Some of the train stations available in or near Fochabers Lhanbryde are Keith, Elgin and Huntly.
Property Price Paid in Fochabers Lhanbryde by Year
The average sold property price by year was:
| Year | Average Sold Price | Price Change |
Sold Properties
|
|---|---|---|---|
| 2025 | £196,035 | 13% |
14 Properties |
| 2024 | £171,055 | -6% |
9 Properties |
| 2023 | £181,375 | -2% |
12 Properties |
| 2022 | £185,286 | 6% |
37 Properties |
| 2021 | £173,621 | 3% |
30 Properties |
| 2020 | £168,038 | 11% |
28 Properties |
| 2019 | £150,102 | -39% |
22 Properties |
| 2018 | £208,016 | 38% |
25 Properties |
| 2017 | £128,943 | -15% |
23 Properties |
| 2016 | £148,891 | -3% |
23 Properties |
| 2015 | £154,022 | -2% |
22 Properties |
| 2014 | £156,870 | 21% |
22 Properties |
| 2013 | £123,555 | -18% |
23 Properties |
| 2012 | £146,097 | 23% |
18 Properties |
| 2011 | £112,558 | -11% |
22 Properties |
| 2010 | £125,400 | 7% |
15 Properties |
| 2009 | £116,766 | 1% |
16 Properties |
| 2008 | £115,384 | -3% |
28 Properties |
| 2007 | £119,118 | 25% |
25 Properties |
| 2006 | £89,482 | 17% |
41 Properties |
| 2005 | £74,002 | 12% |
43 Properties |
| 2004 | £65,210 | 19% |
36 Properties |
| 2003 | £52,867 | 24% |
34 Properties |
| 2002 | £40,010 | 12% |
7 Properties |
| 2001 | £35,066 | -57% |
12 Properties |
| 2000 | £55,000 | - |
1 Property |