
Houses for sale & to rent in Irvine West, Irvine
House Prices in Irvine West
Properties in Irvine West have an average house price of £106k and had 448 Property Transactions within the last 3 years¹.
Irvine West is an area in Irvine, North Ayrshire with 7,174 households², where the most expensive property was sold for £420k.
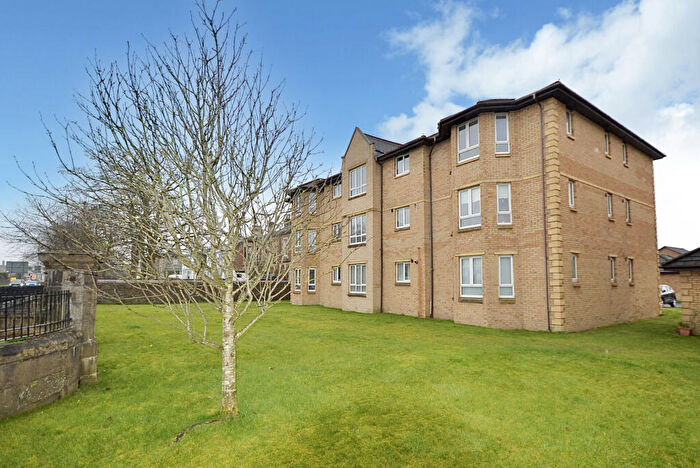
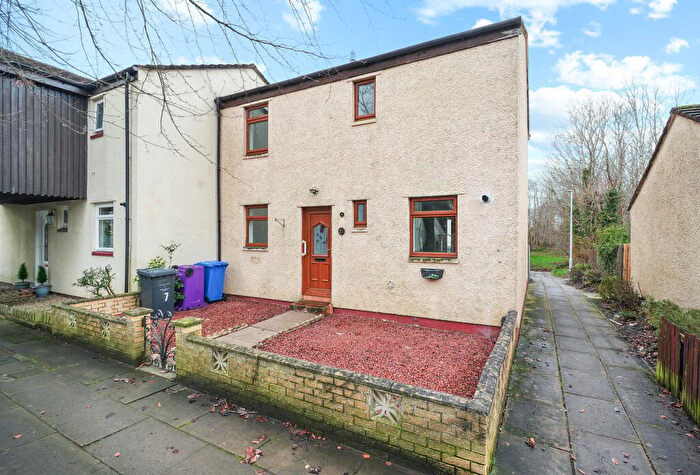
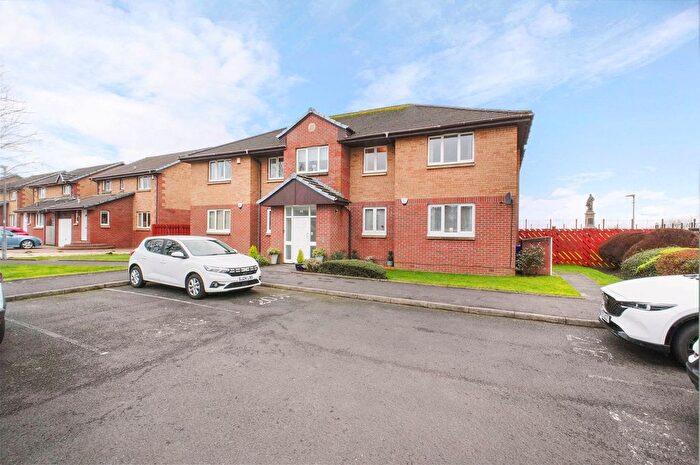
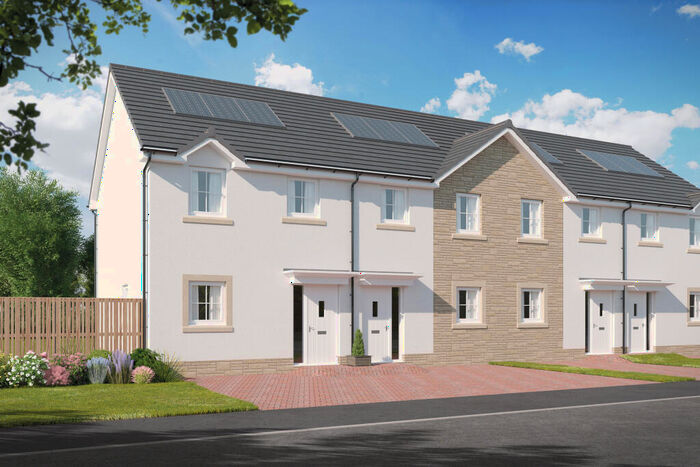
Properties for sale in Irvine West
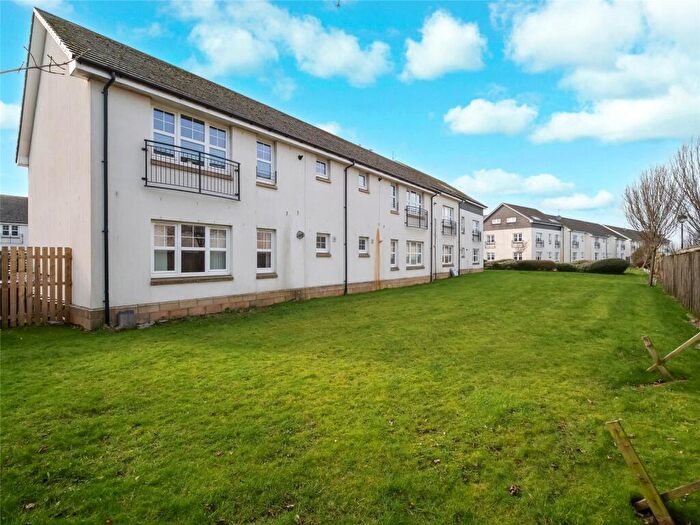
![]()
If you are looking to sell your house, let it out, or receive a property valuation, an expert can help you.
Click the button below to get started.


Roads and Postcodes in Irvine West
Navigate through our locations to find the location of your next house in Irvine West, Irvine for sale or to rent.
Transport near Irvine West

- FAQ
- Price Paid By Year
Frequently asked questions about Irvine West
What is the average price for a property for sale in Irvine West?
The average price for a property for sale in Irvine West is £105,511. This amount is 17% lower than the average price in Irvine. There are 1,517 property listings for sale in Irvine West.
What streets have the most expensive properties for sale in Irvine West?
The streets with the most expensive properties for sale in Irvine West are Racecourse Place at an average of £340,050, Williamfield Grove at an average of £304,725 and Carrick Drive at an average of £288,284.
What streets have the most affordable properties for sale in Irvine West?
The streets with the most affordable properties for sale in Irvine West are High Street at an average of £46,309, Dunvegan Place at an average of £49,000 and Hill Street at an average of £50,553.
Which train stations are available in or near Irvine West?
Some of the train stations available in or near Irvine West are Irvine, Kilwinning and Stevenston.
Property Price Paid in Irvine West by Year
The average sold property price by year was:
| Year | Average Sold Price | Price Change |
Sold Properties
|
|---|---|---|---|
| 2025 | £105,867 | 8% |
139 Properties |
| 2024 | £97,538 | -14% |
134 Properties |
| 2023 | £111,334 | 1% |
175 Properties |
| 2022 | £109,952 | 2% |
226 Properties |
| 2021 | £107,615 | 11% |
262 Properties |
| 2020 | £95,852 | -4% |
166 Properties |
| 2019 | £99,594 | 10% |
224 Properties |
| 2018 | £89,892 | -8% |
240 Properties |
| 2017 | £97,235 | 10% |
237 Properties |
| 2016 | £87,965 | -11% |
245 Properties |
| 2015 | £97,628 | -0,4% |
183 Properties |
| 2014 | £97,975 | 11% |
193 Properties |
| 2013 | £87,343 | 13% |
208 Properties |
| 2012 | £75,785 | -13% |
173 Properties |
| 2011 | £85,391 | -13% |
145 Properties |
| 2010 | £96,458 | 7% |
139 Properties |
| 2009 | £89,830 | -11% |
147 Properties |
| 2008 | £99,997 | 4% |
252 Properties |
| 2007 | £96,303 | 6% |
484 Properties |
| 2006 | £90,372 | -10% |
431 Properties |
| 2005 | £99,051 | 37% |
403 Properties |
| 2004 | £62,393 | 21% |
360 Properties |
| 2003 | £49,028 | 7% |
404 Properties |
| 2002 | £45,353 | -41% |
414 Properties |
| 2001 | £63,782 | - |
28 Properties |