
Houses for sale & to rent in Irvine, North Ayrshire
House Prices in Irvine
Properties in Irvine have an average house price of £128k and had 1,087 Property Transactions within the last 3 years.¹
Irvine is an area in North Ayrshire with 17,495 households², where the most expensive property was sold for £481k.
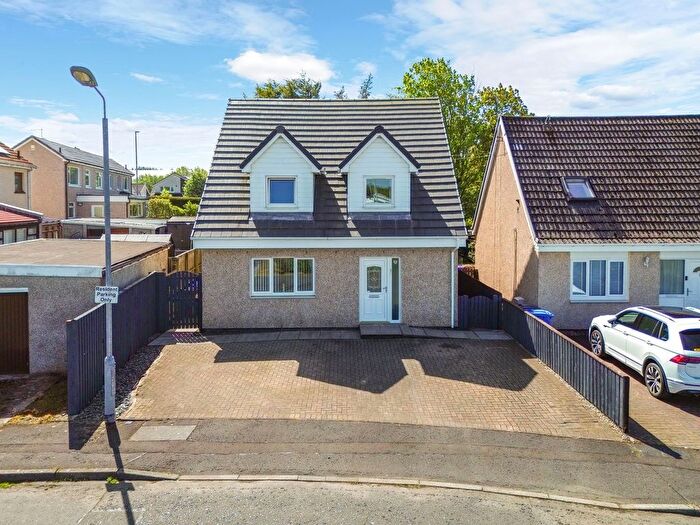
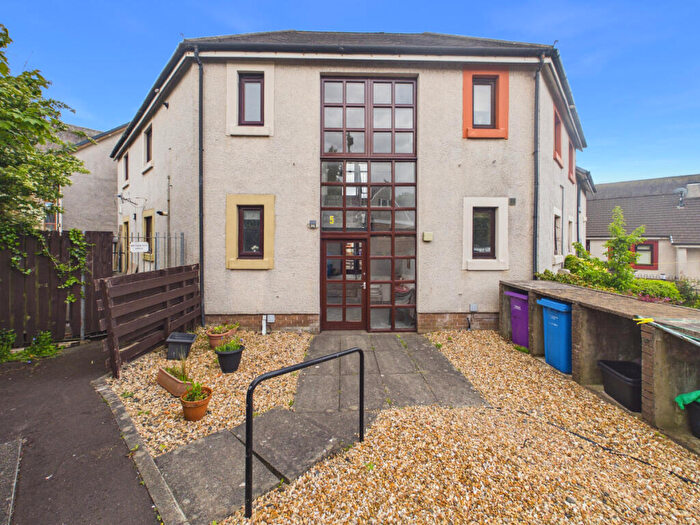
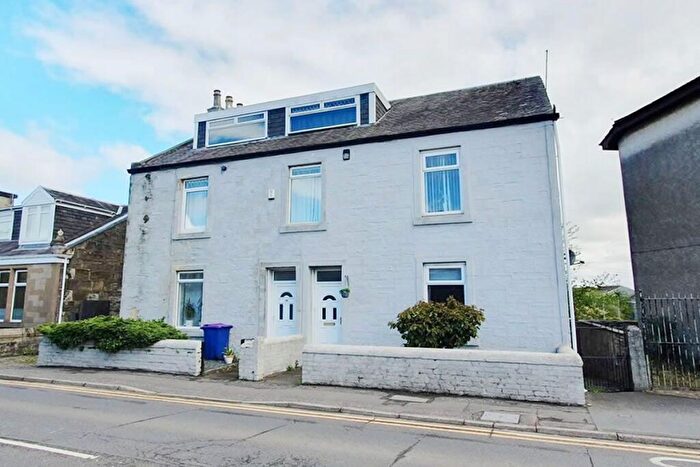
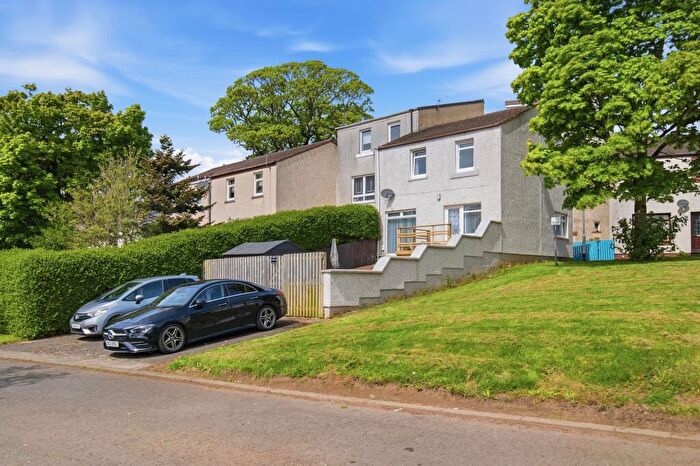
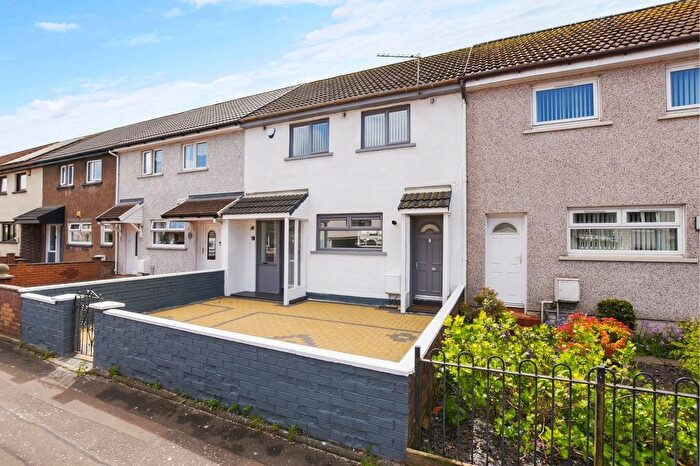
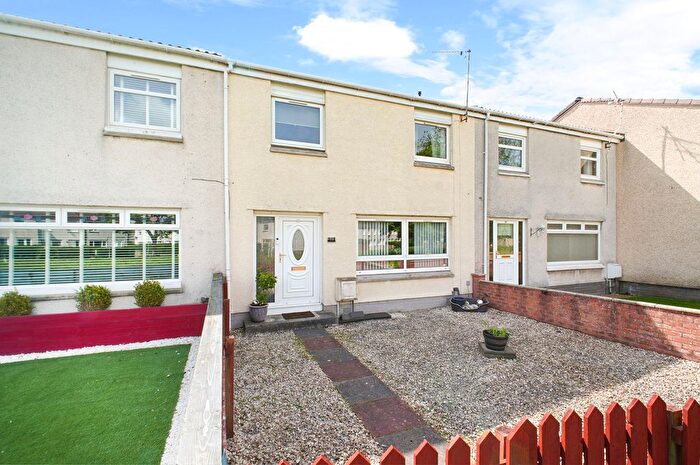
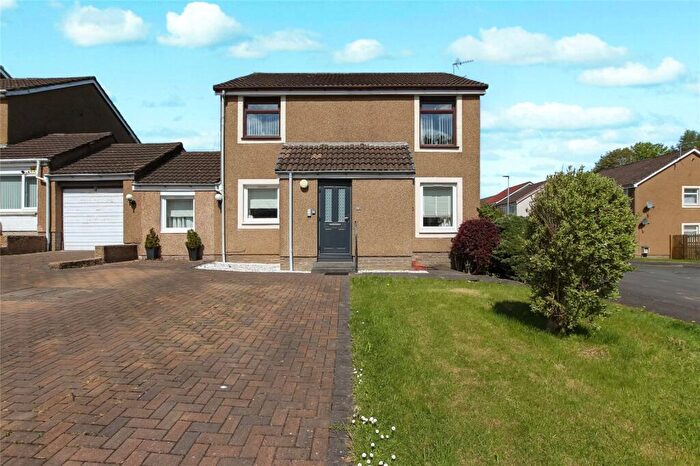
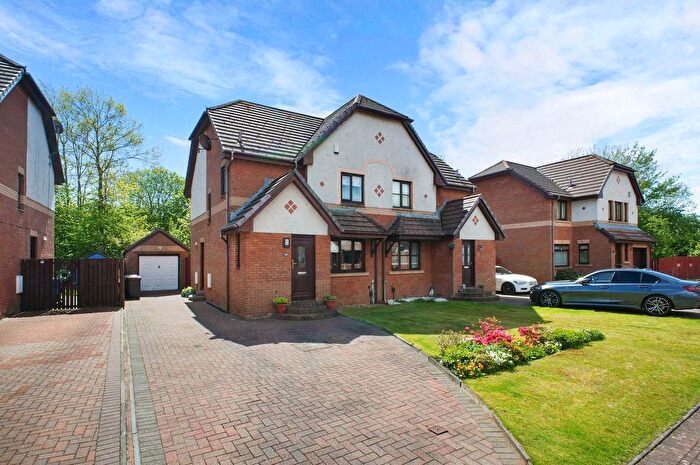
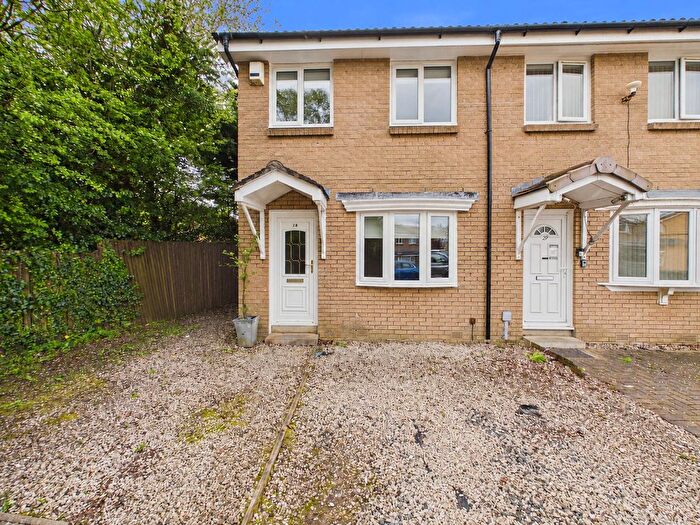
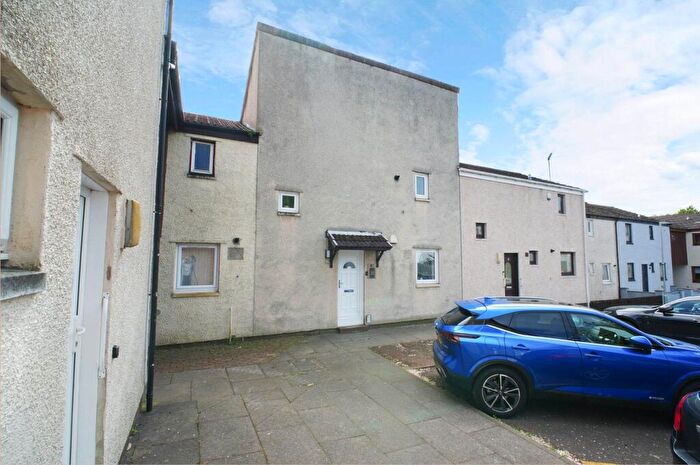
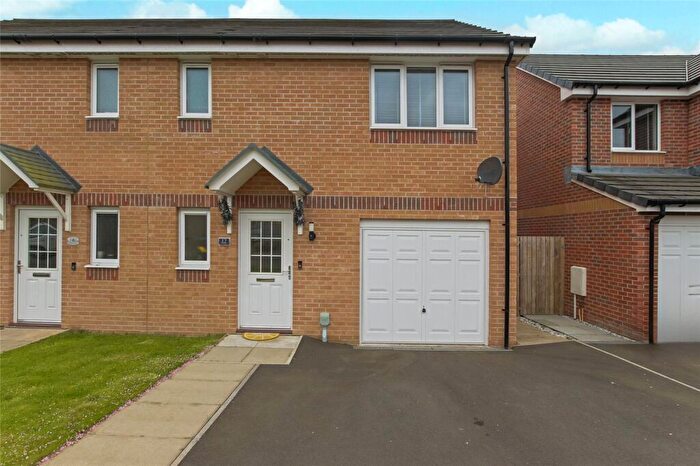
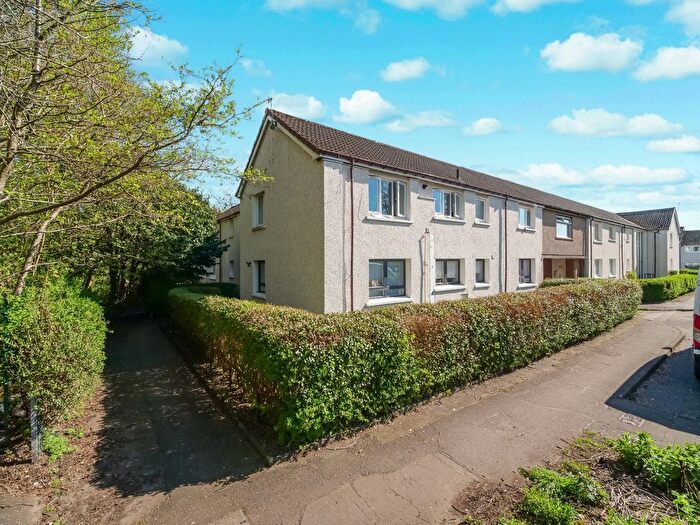
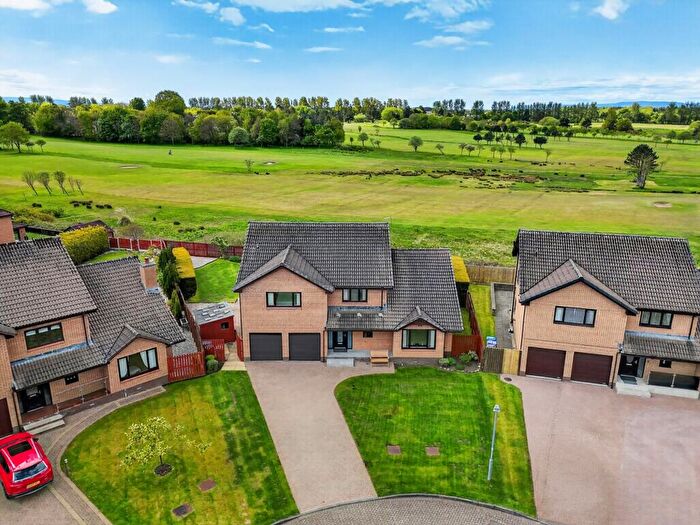
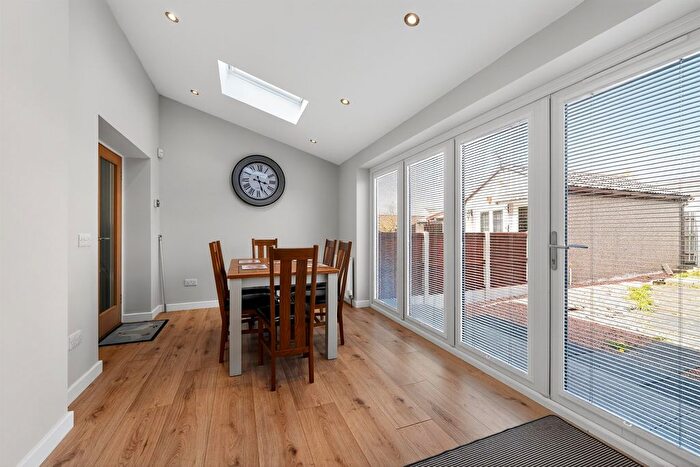
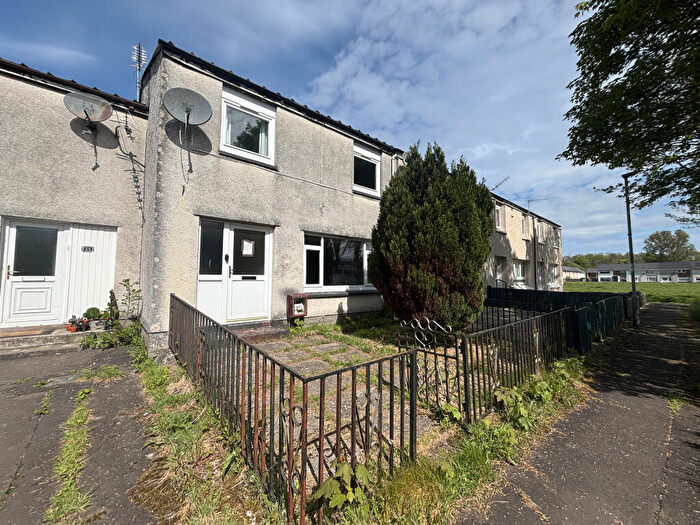
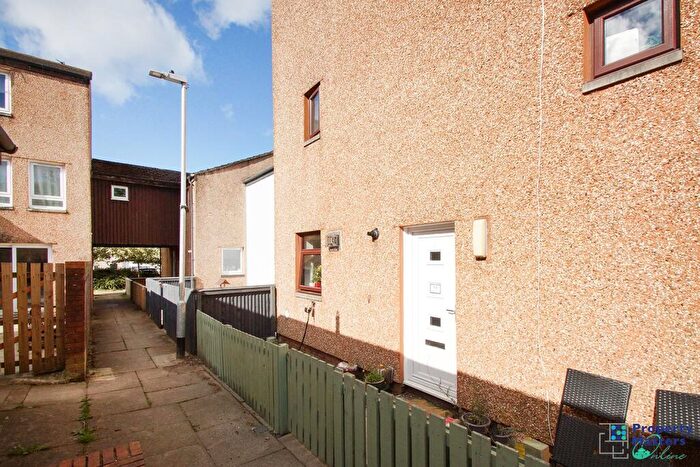
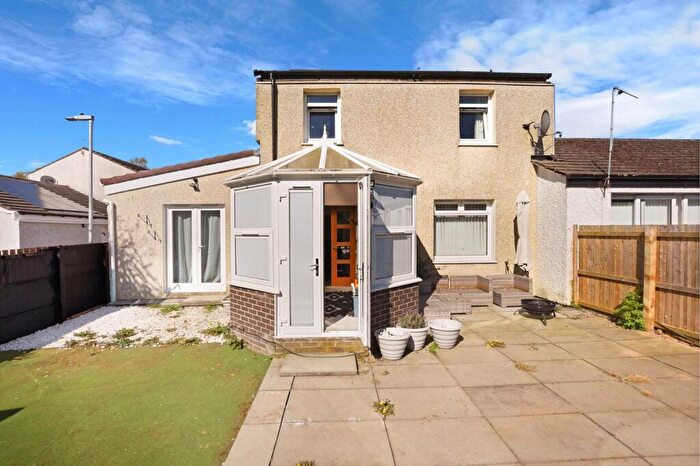
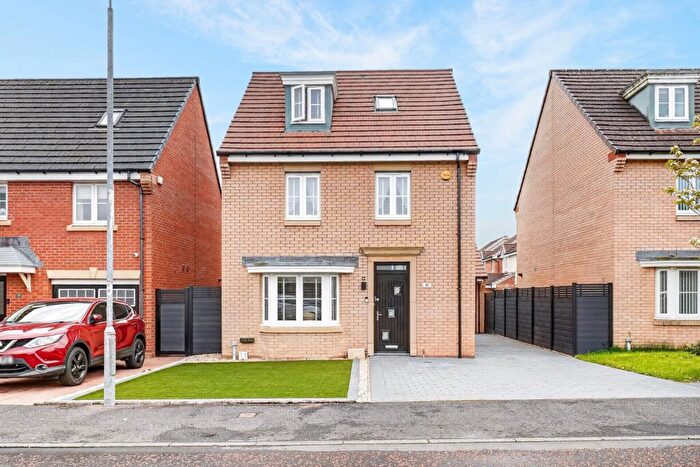
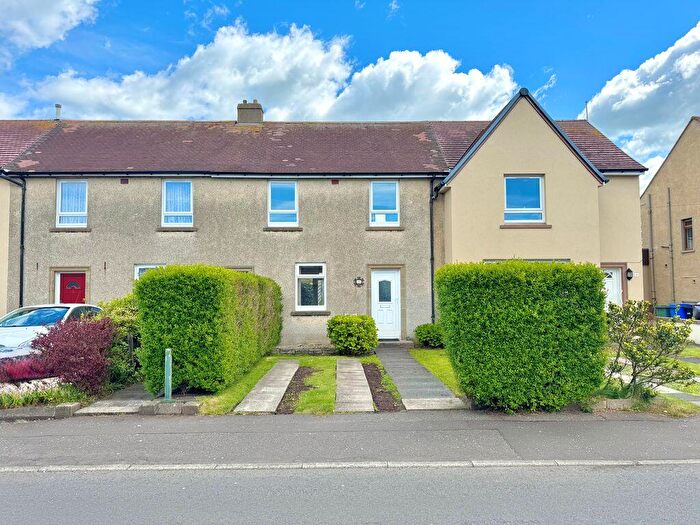
Properties for sale in Irvine

![]()
If you are looking to sell your house, let it out, or receive a property valuation, an expert can help you.
Click the button below to get started.


Neighbourhoods in Irvine
Navigate through our locations to find the location of your next house in Irvine, North Ayrshire for sale or to rent.
Transport in Irvine
Please see below transportation links in this area:

- FAQ
- Price Paid By Year
Frequently asked questions about Irvine
What is the average price for a property for sale in Irvine?
The average price for a property for sale in Irvine is £128,304. This amount is 10% lower than the average price in North Ayrshire. There are 2,921 property listings for sale in Irvine.
What locations have the most expensive properties for sale in Irvine?
The locations with the most expensive properties for sale in Irvine are Irvine East at an average of £161,657 and Irvine South at an average of £124,133.
What locations have the most affordable properties for sale in Irvine?
The location with the most affordable properties for sale in Irvine is Irvine West at an average of £105,871.
Which train stations are available in or near Irvine?
Some of the train stations available in or near Irvine are Irvine, Kilwinning and Barassie.
Property Price Paid in Irvine by Year
The average sold property price by year was:
| Year | Average Sold Price | Price Change |
Sold Properties
|
|---|---|---|---|
| 2025 | £131,205 | 6% |
393 Properties |
| 2024 | £123,668 | -5% |
323 Properties |
| 2023 | £129,268 | -2% |
371 Properties |
| 2022 | £131,353 | 6% |
608 Properties |
| 2021 | £124,100 | -2% |
663 Properties |
| 2020 | £127,034 | 5% |
540 Properties |
| 2019 | £120,726 | 4% |
619 Properties |
| 2018 | £116,196 | 3% |
649 Properties |
| 2017 | £113,261 | 5% |
653 Properties |
| 2016 | £107,906 | -4% |
658 Properties |
| 2015 | £111,802 | 9% |
556 Properties |
| 2014 | £101,530 | 6% |
497 Properties |
| 2013 | £95,642 | 2% |
493 Properties |
| 2012 | £93,346 | -91% |
409 Properties |
| 2011 | £178,029 | 41% |
349 Properties |
| 2010 | £104,251 | 11% |
366 Properties |
| 2009 | £92,938 | -19% |
362 Properties |
| 2008 | £110,443 | 5% |
648 Properties |
| 2007 | £105,444 | 5% |
1,122 Properties |
| 2006 | £100,309 | 3% |
1,028 Properties |
| 2005 | £97,676 | 29% |
1,016 Properties |
| 2004 | £69,741 | 24% |
962 Properties |
| 2003 | £52,790 | -12% |
912 Properties |
| 2002 | £58,927 | 11% |
936 Properties |
| 2001 | £52,191 | - |
78 Properties |