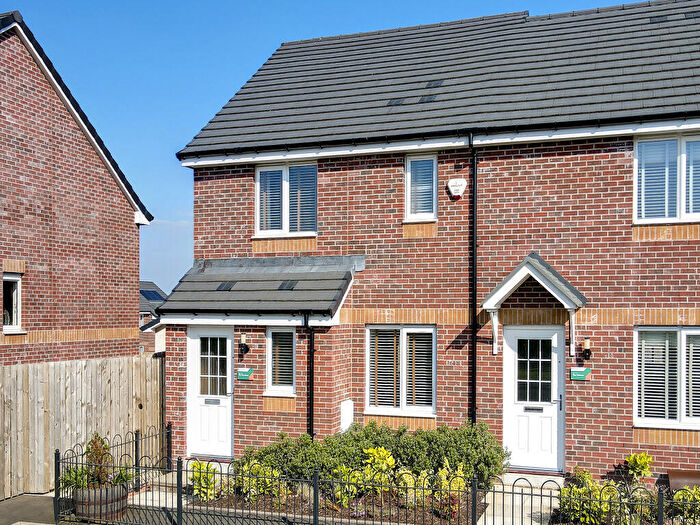
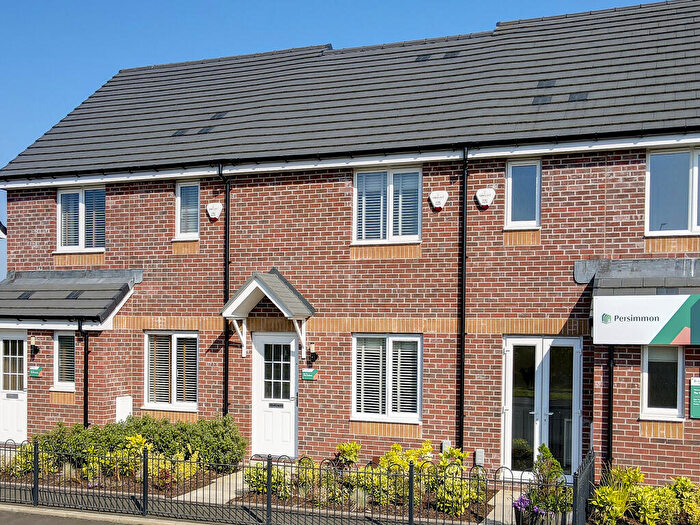
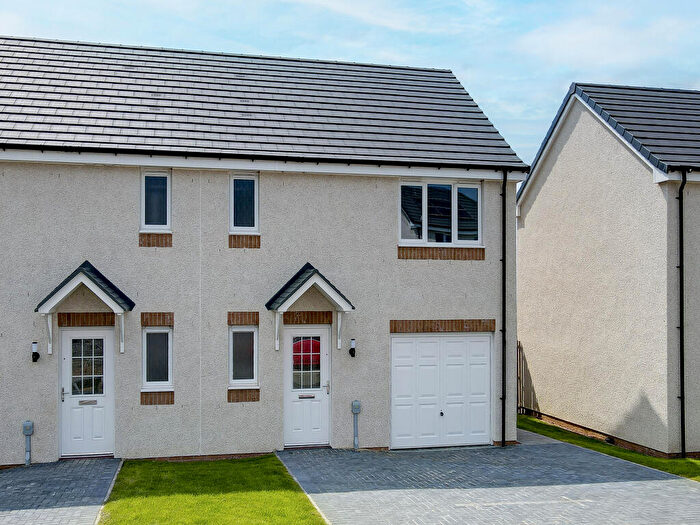
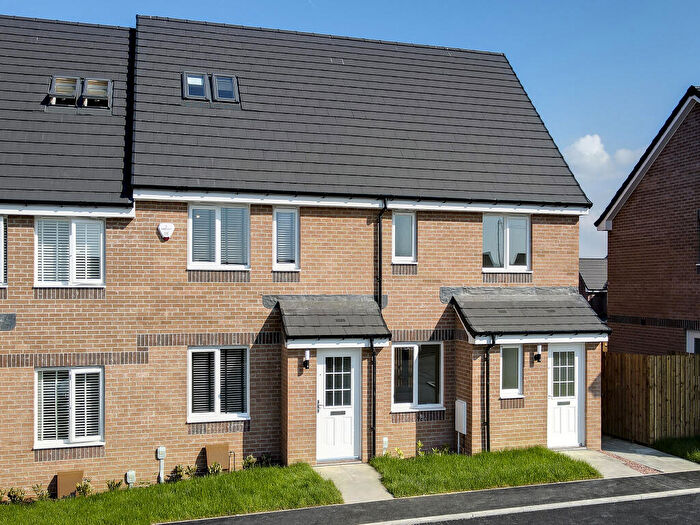
Houses for sale & to rent in Stevenston, Saltcoats
House Prices in Stevenston
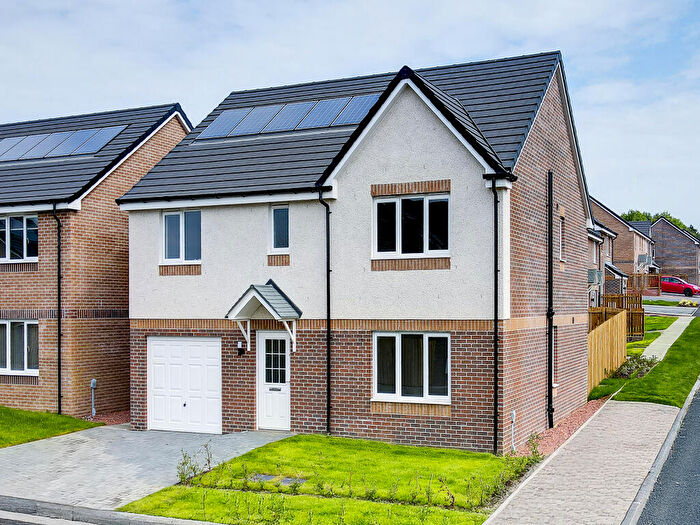
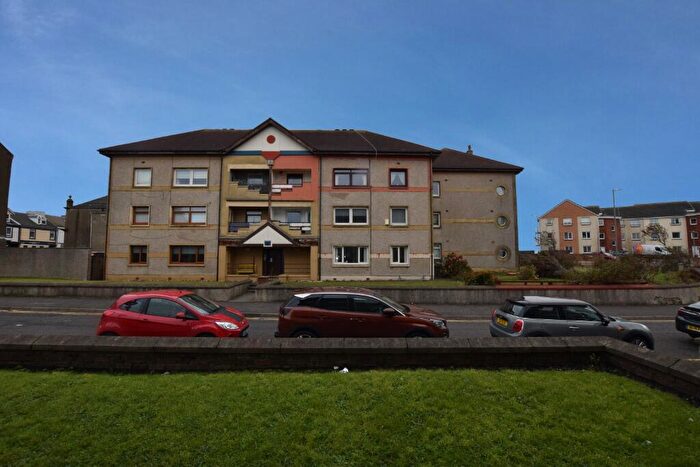
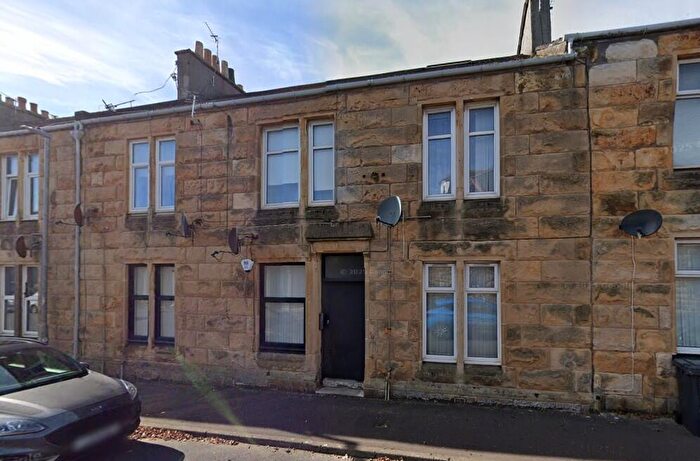
Properties in Stevenston have an average house price of £90,156.00 and had 15 Property Transactions within the last 3 years¹.
Stevenston is an area in Saltcoats, North Ayrshire with 1,541 households², where the most expensive property was sold for £178,995.00.
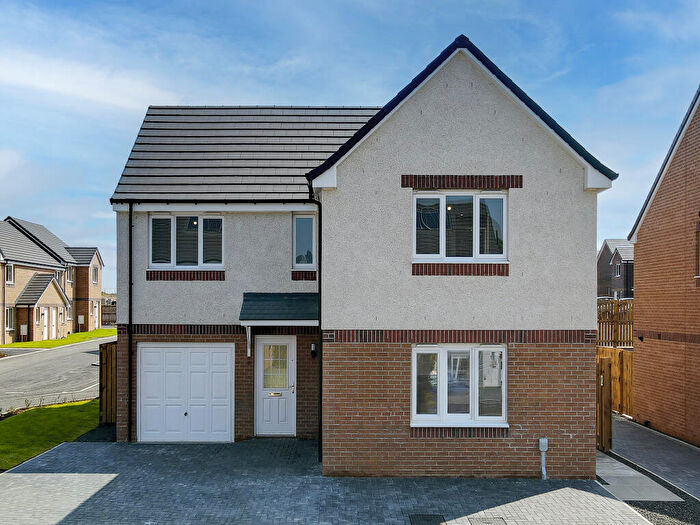
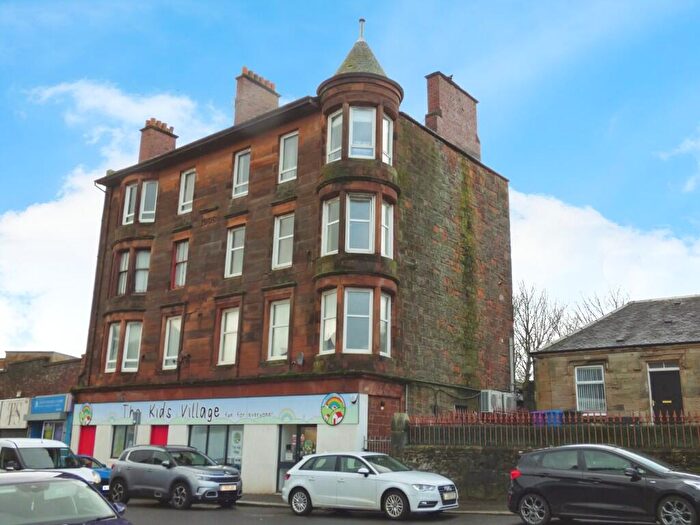
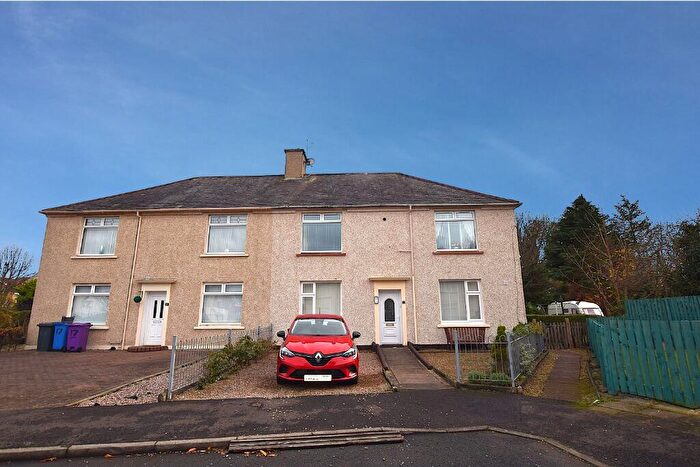
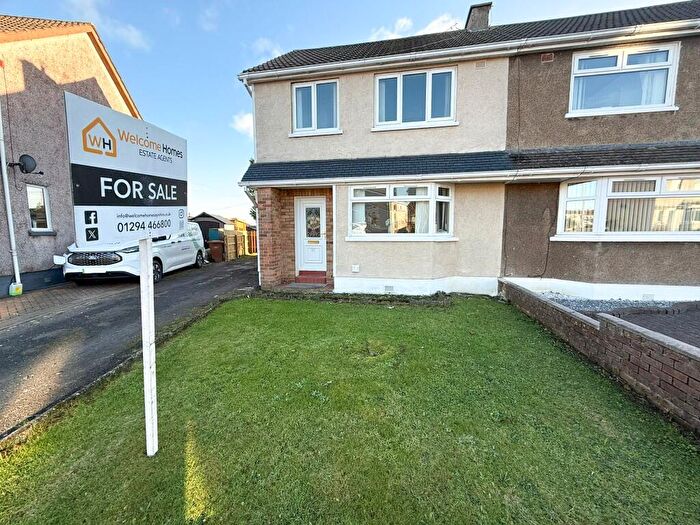
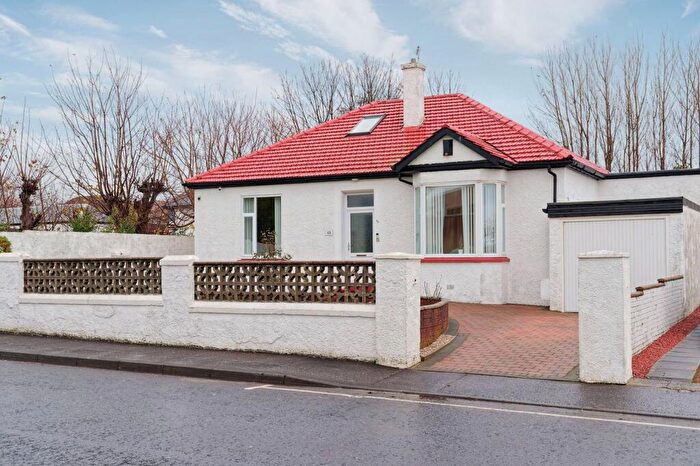
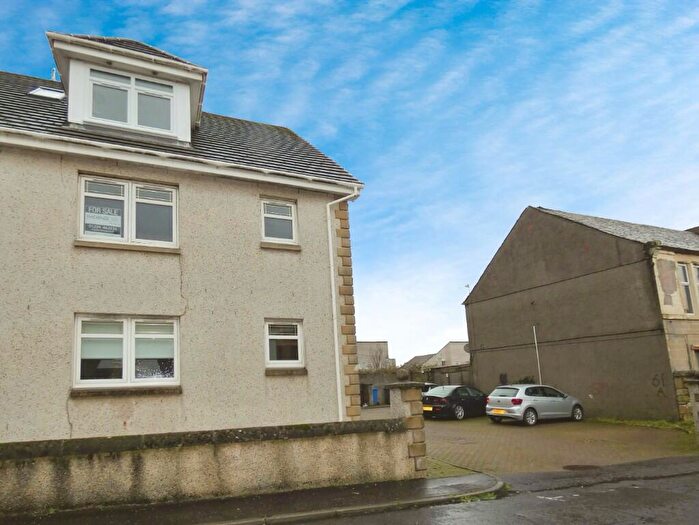
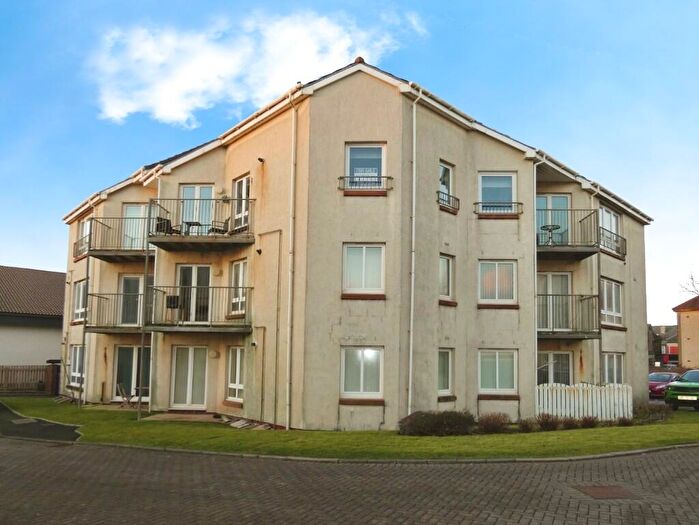
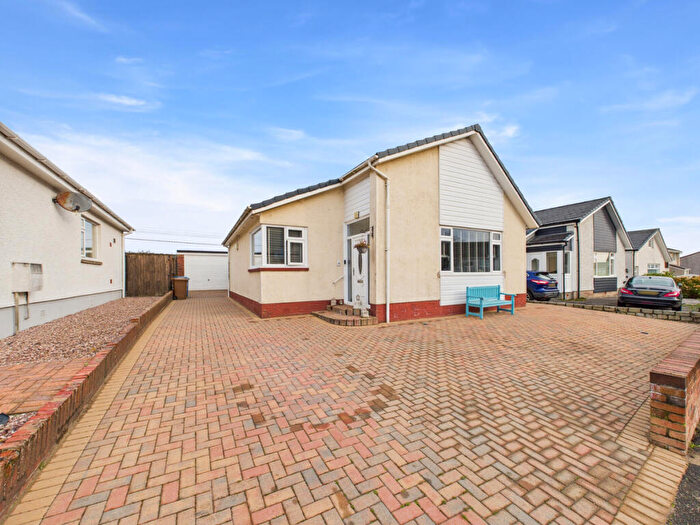
Properties for sale in Stevenston
Roads and Postcodes in Stevenston
Navigate through our locations to find the location of your next house in Stevenston, Saltcoats for sale or to rent.
| Streets | Postcodes |
|---|---|
| Abbotsford Place | KA21 6HR |
| Ailsa Road | KA21 6LR |
| Auchenharvie Road | KA21 5RJ KA21 5RL KA21 5RN |
| Barnett Crescent | KA21 5JP |
| Blakely Road | KA21 5JQ |
| Braehead Place | KA21 5LB |
| Canal Street | KA21 5HY KA21 5HZ KA21 5JA KA21 5JB |
| Canal View | KA21 5PD |
| Craigs Place | KA21 5RW |
| Cunninghame Crescent | KA21 5PE |
| Cunninghame Road | KA21 5PZ |
| Dalry Road | KA21 6HL KA21 6HN KA21 6JZ KA21 6LD KA21 6LE |
| Duguid Drive | KA21 6LW |
| Factory Place | KA21 5LA KA21 5LZ |
| Fleck Avenue | KA21 6LJ |
| Giffen Road | KA21 5QX |
| Gilfillan Avenue | KA21 6LF |
| Gladstone Road | KA21 5LD KA21 5LF |
| Guthrie Road | KA21 5PN |
| Halkett Place | KA21 5QE |
| High Road | KA21 5QP KA21 5RD KA21 5RE KA21 5RP KA21 6JX |
| Ivanhoe Drive | KA21 6LS KA21 6LT KA21 6LU KA21 6LX |
| Kenilworth Drive | KA21 6HS |
| Kerr Avenue | KA21 5PR KA21 5PS KA21 5PT KA21 5PU |
| Kinnier Road | KA21 5QF KA21 5QG KA21 5QQ |
| Kyleshill Court | KA21 5GS |
| Martin Square | KA21 6HW |
| Mayfield Place | KA21 5RH |
| Mayfield Road | KA21 5RG KA21 5RQ |
| Mcisaac Road | KA21 5PF |
| Middlepart Crescent | KA21 6LL KA21 6LN |
| Millar Road | KA21 5QA KA21 5QB |
| Mulgrew Avenue | KA21 6HP |
| Munro Place | KA21 6LG |
| Munro Walk | KA21 6HU |
| Nelson Road | KA21 5RF |
| Old Raise Road | KA21 5QY KA21 5QZ KA21 5RB |
| Parkend Avenue | KA21 5HX |
| Parkend Gardens | KA21 5PH |
| Parkend Road | KA21 5JR KA21 5PJ KA21 5PL KA21 5PP |
| Parkend Terrace | KA21 5JL |
| Primrose Place | KA21 6LH |
| Prospecthill Road | KA21 6LP |
| Raise Street | KA21 5JY KA21 5JZ |
| Rennie Place | KA21 5JW |
| Robertson Crescent | KA21 5JD |
| Sandylands Caravan Park | KA21 5JN |
| Seabank Street | KA21 5JF |
| Sharphill Road | KA21 5NW KA21 5QU |
| Shaw Place | KA21 6LQ |
| Smith Drive | KA21 5QD |
| St Lawrence Place | KA21 5RA |
| Talisman Walk | KA21 6HT |
| Thomas Campbell Street | KA21 5PG |
| Townhead Road | KA21 5PX |
| Victoria Road | KA21 5LG |
| Wyllie Road | KA21 5PQ |
Transport near Stevenston
-
Saltcoats Station
-
Ardrossan South Beach Station
-
Stevenston Station
-
Ardrossan Town Station
-
Ardrossan Harbour Station
-
Kilwinning Station
- FAQ
- Price Paid By Year
Frequently asked questions about Stevenston
What is the average price for a property for sale in Stevenston?
The average price for a property for sale in Stevenston is £90,156. This amount is 27% lower than the average price in Saltcoats. There are 778 property listings for sale in Stevenston.
Which train stations are available in or near Stevenston?
Some of the train stations available in or near Stevenston are Saltcoats, Ardrossan South Beach and Stevenston.
Property Price Paid in Stevenston by Year
The average sold property price by year was:
| Year | Average Sold Price | Price Change |
Sold Properties
|
|---|---|---|---|
| 2023 | £90,156 | -6% |
15 Properties |
| 2022 | £95,483 | 22% |
48 Properties |
| 2021 | £74,546 | 11% |
58 Properties |
| 2020 | £66,301 | -0,2% |
32 Properties |
| 2019 | £66,466 | 2% |
53 Properties |
| 2018 | £64,878 | 0,3% |
44 Properties |
| 2017 | £64,669 | 3% |
43 Properties |
| 2016 | £62,915 | -5% |
44 Properties |
| 2015 | £65,992 | 13% |
32 Properties |
| 2014 | £57,429 | -1% |
36 Properties |
| 2013 | £58,288 | -3% |
26 Properties |
| 2012 | £60,216 | -8% |
35 Properties |
| 2011 | £64,912 | -14% |
22 Properties |
| 2010 | £74,312 | 13% |
24 Properties |
| 2009 | £64,828 | -8% |
31 Properties |
| 2008 | £69,830 | 2% |
49 Properties |
| 2007 | £68,525 | 10% |
83 Properties |
| 2006 | £61,980 | 6% |
88 Properties |
| 2005 | £58,078 | 24% |
85 Properties |
| 2004 | £43,917 | -32% |
92 Properties |
| 2003 | £58,120 | 43% |
101 Properties |
| 2002 | £33,207 | -28% |
66 Properties |
| 2001 | £42,549 | - |
5 Properties |

